Using Open Source Tools for Spatial Temporal Querying and
Knowledge Discovery from Moving Object Data
Zia Ur Rehman, Aneeq Ahmad and Shahzad Saleem
School of Electrical Engineering & Computer Science, National University of Science & Technology, Islamabad, 44000 Pakistan Email: {14msiszrehman, 14msisaahmad, shahzad.saleem}@seecs.edu.pk
Abstract
Geospatial information overload has become an issue in recent years. It is fuelled in part by the widespread availability of mobility data from a variety of sources, such as ubiquitous mobile computing devices, geographic positioning systems, and traces from digital map interactions. The article describes a data analysis technique for extracting knowledge from mobility data. Data from mouse movements over digital maps were analysed for their spatial-temporal content to reveal user behavior. Although the trajectories are from mouse movements in Human-Computer Interaction domain, they can also serve as a proxy for physical trajectories in the real world. The article presents the methodology to reduce information overload and convert raw trajectory data into useful knowledge. This geographic knowledge discovery process was realised using Secondo, a highly specialised open source tool that allows developing specific spatio-temporal queries to analyse trajectories. The results indicate that Secondo can be intelligently exploited for identifying specific movement patterns and behavior and ultimately extract knowledge which can be used in personalised web maps, spatial recommender systems, event detection and crime monitoring tasks.
Keywords:Geo-visualisation; Human-Computer Interaction (HCI); Knowledge Discovery from Databases (KDD), Secondo.
experienced [5]. However, the functionality was limited to the existing tool as it was built on top of a spatial DBMS that had no built-in support for temporal and/or spatio- temporal querying.
In this article, we use Secondo [6], an open source and extensible tool, to perform spatio-temporal analysis of trajectory data. Secondo is a specialised Database Management System (DBMS) for storing and processing trajectories, on top of which customised applications can be built. We demonstrate the power of the Secondo [6] system to extract knowledge from large datasets of moving objects by showing several case studies that identify trajectories which exceed predefined spatial and temporal thresholds. This valuable information can be used to classify user behavior, describe the experience level of users, and determine important spatial regions and points. This knowledge could, in turn, be used to personalise web map content in order to improve the user experience. In this article, we discuss several use cases that show the benefits of trajectory analysis using Secondo.
The main contribution of this paper is the demonstration of the potential of Secondo as a very powerful open source tool for the discovery of important knowledge from spatio-temporal trajectories. This knowledge can be intelligently exploited in several critical applications. We hope this research will promote the use of Secondo as a valuable resource for research and applications involving spatio-temporal data analysis and encourage its continued extension and improvement.
The remainder of this article is organised as follows. To provide the background for our work, some related
1. Introduction
Information overload is an ever-growing phenomenon. This is particularly true in the spatial domain where geographical information about moving objects is collected continuously. Location aware smart devices such as smartphones, GPS, RFID technology, bar codes and cameras all collect large volumes of data about moving objects. The problem of analyzing such data is exacerbated as the data contain both spatial and temporal information. Specialized algorithms and techniques are therefore required to extract meaning from such data. Typically, movement data are collected in the form of locations and timestamps, which are ordered temporally to form a data structure known as a trajectory. While spatial-temporal trajectories are generally recorded in the physical world by the movement of animals, humans, machines, or natural phenomenon, they may also be generated in the context of Human-Computer Interaction (HCI) [1].
A typical example of this is when users interact with a digital map on a computer screen to perform spatial tasks using a computer mouse or touch gestures. Analysing such HCI movements in the spatial domain are beneficial to identify the usage patterns and ultimately deliver an improved user experience. This analysis can be achieved using specialized data mining techniques [2] and machine learning algorithms [3]. In previous research, we developed a geo-visual analytics tool (GIIViz) using open source geospatial technologies [4]. The tool contained features such as density maps, speed maps, and a space-time cube to visually provide insight into user interaction with web-based maps. Additionally, clustering techniques were used to identify common patterns and to determine novice and
DOI: http://dx.doi.org/10.24949njes.v10i2.236
Ali Tahir
literature is presented in Section 2. The overall methodology that includes a description of collected data, the temporal extensible database and the formulation of spatio-temporal queries is described in Section 3. Section 4presents experimental results and the evaluation we have conducted. Finally, Section 5 outlines the conclusions and directions for future work.
2. Related Work
Given the value of movement data and the surge in devices, which can collect such data frequently and efficiently [7], many techniques to process, store and analyse it has been proposed in recent years. The importance of this research area can be seen, for instance, through the emergence of GeoPKDD, a large EU project which aims to discover useful knowledge about movement data from semantic rich mobility data stored in the form of trajectories [8]. It is recognised that traditional database management systems are not suited for storing trajectories efficiently. The problem of modelling and representing trajectories in the context of database systems is discussed by Guting [9].
Traditional database systems lack the ability to deal with the spatial component of the moving objects while spatial databases do not cater for the temporal component of moving objects. This has led to the development of extensible database systems, which describe moving objects as abstract data types with complete movements histories. Examples of these database management systems include Secondo and Hermes [10].
Secondo supports continuously changing
geometries by considering spatial and spatio-temporal operations. In Secondo, movements in free, constrained and network environments can be represented as database structures. The unique feature of Secondo is the spatio-temporal data types it supports. These include moving point, moving the line and moving regions. Furthermore, Secondo supports relational, spatial, and temporal algebras, which makes the DBMS powerful when querying moving objects. Secondo is open source software and contains a graphical user interface to visualise the contents of the database. Like Secondo, Hermes also deals with moving objects and is implemented on top of the Oracle 10g database system. Hermes is an object-relational DBMS that aids in modelling, constructing and querying a database with dynamic objects that change location, shape, and size, either discretely or continuously in time [10]. However, Hermes lacks the interface to visually represent the contents of the database. Therefore, Secondo is a preferred choice over Hermes.
CommonGIS is another geo-visual analytics tool. Unlike Secondo, it is not an open source tool and is limited for customization. Therefore, Secondo can be a preferred choice. However, whatever tool one chooses, it is necessary to transform raw trajectories into formats usable by other systems. Gerasimos [11] describe aspects related to data collection and handling to generate trajectories that are compliant with database standards. Typically, this involves trajectory reconstruction and transformation by applying data cleansing, data compression, and map matching to produce noise-free and meaningful trajectories. Other types
of trajectory data that have been collected and analysed include eye movement data as described by [16-19]. All these studies investigated the gaze movements and patterns that depict certain behaviors.
The advent of specialised moving object databases has facilitated an interest in discovering collective behaviours in trajectory datasets. For instance, finding groups of objects that move along a specified path for a certain time at a fixed distance from each other or identifying other patterns such as clusters or convoys [7], flocking, leadership, convergence, and encounters [12]. Alongside the DBMS for storing and processing movement data, other techniques such as visual analytics [13] and more specifically geo-visual analytics have emerged to facilitate reasoning about the spatio-temporal data which can be used to guide the design of queries to extract meaning from large datasets of moving objects.
In this article, we use a dataset collected in our previous work [5] obtained by collecting computer mouse trajectories of users completing spatial tasks on web maps to demonstrate the power of Secondo in providing insight into user map browsing behavior. By analysing the trajectories produced by such interaction, collective behavior and techniques can be identified. We also use such a dataset to simulate GPS trajectories of users in a real environment to simulate a crime-tracking scenario. We present several queries designed to classify behavior patterns. The results produced by these trajectory analysis queries can be used to personalise or recommend spatial content and can be applied to many scenarios, some of which are described in Section 4.
3. System Description
While spatio-temporal trajectories are generally recorded in the physical world by the movement of animals, humans, machines, or natural phenomenon, they may also be generated in the context of HCI in a virtual environment [5]. A typical example of this is when users interact with a digital map (such as Google Maps, Bing Maps, and MapQuest) on a computer screen to perform spatial tasks (such as location search or route planning) using a computer mouse or touch gestures. Time stamped screen coordinates can be recorded which translate into real world coordinates to reveal intrinsic spatial movement. Spatial interactions with maps can be categorised into tasks such as search and locate, orientation, symbol interpretation, and more complex tasks involving combinations of basic tasks.
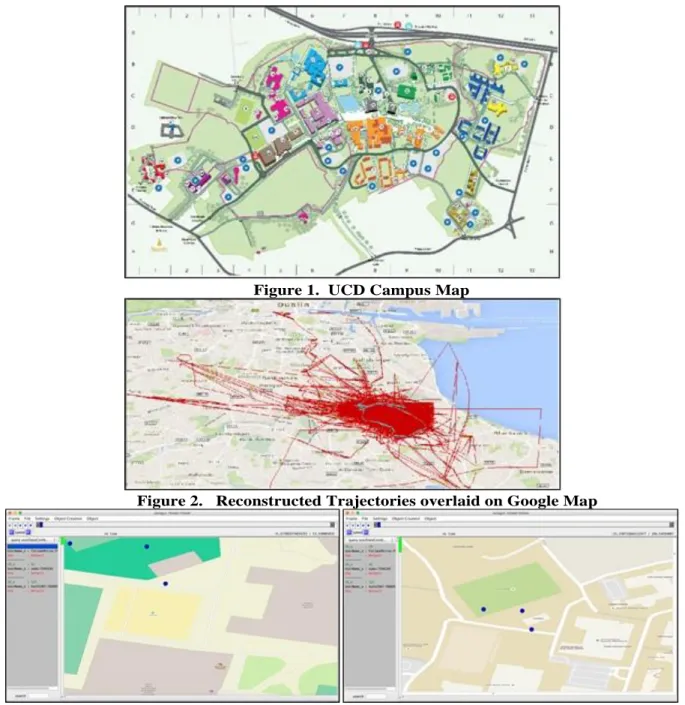
web map, a set of tasks and a text box to provide answers for such tasks. The tasks ensured completing a variety of real-world scenarios using a web map of the chosen study area, the campus at University College Dublin (UCD) as shown in (Figure 1). The total area of UCD is 148 hectares (370 acres) which was deemed suitable for assessing how users move their mouse while completing the spatial tasks. The tasks involved solving common spatial queries such as locating, object counting and planning. The trial consisted of 27 users completing 10 tasks hence each user generated 10 files representing the 10 tasks. However, in some isolated cases, the trajectories were invalid as the user did not complete a specific task or performed insufficient mouse movement. The ten tasks are shown below:
Task 1: As a new student, you are required to open up a student account with the bank located at the campus. Find the bank on the campus map? On your way back, you would also like to get some food. Which is the nearest restaurant to the bank?
Task 2 : You finish a lecture at the John Henry Newman Building (Arts) and need to catch a bus to the city centre (all bus stops connect to the city). Find the bus stop that suits you on campus? How many bus stops are there on campus? Task 3 :Name the building closest to the largest car park on campus.
Task 4 :In order to attend a service at the church located on campus, you need to find the closest car park to the church. Find your way to this car park if you are driving from Stillorgan Road/N11 entrance.
Task 5 :You need to attend a graduation ceremony at UCD. You will be driving to UCD and will enter from the Stillorgan Road/N11 entrance. Locate the reception and O Reilly Hall and find the shortest route between the two. Task 6 :You need to drive to the student bar in the evening. You are required to enter the UCD campus from Wynsward Drive entrance. Follow the path to find the closest car park to the student bar. How many pubs are shown on map in this building?
Task 7 :You finish a lecture in Computer Science and Informatics (CSI) building. You need to meet your friend in front of the Health Science Centre and go together to the James Joyce Library (close to the central largest lake - coloured blue) in order to return a book. Plan the route. Task 8 :In order to post a letter to your friend, plan the route to cycle from Charles Institute located at North West of the central lake (coloured in blue) to Belfield Post Office. Find the nearest bicycle parking stand to the post office? Task 9 :You need to meet your friends at the sports centre building (coloured in green). How would you get to the Glenomena student residence (south east of the central lake) from the sports centre?
Task 10 :Count the number of roads crossing the UCD boundary (as outlined by the black line)
Each user session recorded a series of spatiotemporal sequences in the form of latitude, longitude, and timestamp. Before uploading the data to the moving object database, some pre-processing was necessary to transform the data into the relevant format. This pre-
processing involved flattening directory structures, file merging, removing blank rows, data compression by removing unrelated data columns and encoding using grep in UNIX terminal. In the resulting final data, the CSV file size was reduced from 236.1 MB to 16.4 MB and contained 289,409 records.
The spatio-temporal data obtained after
preprocessing was loaded onto a database created in Secondo. User data included the location in the form of latitude and longitude. Similarly, the date and time for each location were recorded. As any moving object at any instance of time can only exist at one and only one location, the spatial data was expressed as a function of the temporal data to create moving points. Secondo supports abstract data types of moving point, moving the line and moving region. Moving points (mpoint) were used to generate the trajectories corresponding to mouse movements of users completing their tasks. The trajectories created from moving points data were overlaid onto a map as shown in Figure 2. A total of 261 valid trajectories were created and stored.
This spatio-temporal data contains implicit information that can be discovered by applying various temporal query designs. These can be spatio-temporal queries based on predefined spatial and spatio-temporal thresholds, queries analysing which moving objects passed by a specific location, identifying points of interests based on the duration of stay at a specific location, etc. The output of such queries can reveal interesting patterns of how users interact with maps, including identifying similar users. For example, looking at the correlation between the length of a trajectory and the time it took to complete a task can reveal user’s intentions and level of expertise. The analysis we carried out using HCI generated trajectories can also be applied for analysis of user behaviour in the real environment. We show one such example in the following section where the HCI generate dataset used in this paper was used as a proxy to simulate GPS trajectories of users walking on the UCD campus. Their movements were analysed to provide insight into a simulated crime investigation scenario. The following section presents the various ways the collected HCI data was manipulated to extract knowledge.
4. Results and Discussion.
In this section, we present an evaluation carried out to assess the power of Secondo in analysing spatio-temporal data. We discuss the implementation of a series of spatio-temporal queries we applied to the HCI data described in section 3. The discussion primarily involves the visual interpretation of each query, the numeric results of queries, and any insight into a particular behaviour, which was discovered. The queries have been categorised into various types based on the semantic output they represent.
4.1 Sensitive Area Analysis + Personalisation
noticed. This is useful in several application areas. For example, map servers can develop map personalisation for users and recommend sites and places like their interests. Similarly, security agencies can determine how long a user is visiting an area; tourist agencies can learn the areas of interest of various categories of people. One such scenario we considered focuses on the UCD Bowl Area as a sensitive location. Using the query shown below, all users who have visited the sensitive area on the map and stayed there for more than 20-time units can be discovered.
query userDataCombAll feed {o} userTrajectory feed {p} product filter[.SessionID_o=.TrajID_p] extend[Stations:
breakpoints(.Traj_p, create_duration(0,2000))] project[ID_o,
UserName_o,SessionID_o,Stations] projectextendstream[ID_o,
UserName_o ; StopPoints:
components(.Stations)]
projectextend[ID_o, UserName_o; Sta: get(.StopPoints,0)] filter[.Sta inside BowlReg] consume
The output revealed that three users visited the sensitive area and explored it for more than 20-time units (see Figure 3). By increasing the temporal threshold to 50 units, only one user was found.
4.2 Business Intelligence
To demonstrate the benefits of this approach for business intelligence applications, we consider a scenario to compare the merits of two distinct locations to establish a new business. For this analysis, the UCD Bowl and the UCD stadium are considered as locations for a new cafe that requires a high footfall of visitors. To understand the level of interest in the areas, a buffer region of 100 meters around each of selected location is determined. The number of moving objects passing through these regions is calculated using the query shown below. The output showed that 115
user trajectories entered UCD Bowl Region whereas 118
user trajectories entered UCD Stadium Region as illustrated in Figure 4. This knowledge can be used in conjunction with other geo-intelligence factors such as proximity to sports facilities, cinema, bus stands, etc. to decide regarding the location for the new business. Using this information, the UCD Stadium could be chosen for a new cafe.
let BowlReg = circle(UCDbowl,0.001,50) query userTrajectory feed filter [.Traj passes BowlReg] count
4.3 Social behaviour analysis: identifying the common point of interest.
While the business intelligence example described above focuses specific regions of the map, other applications need to examine complete trajectories of many users to identify spatial-temporal behavioral patterns. Examples include scenarios where a logistic fleet manager wants to identify the stops made by drivers for longer than the authorised time; a tourist development council interested in identifying spots
within an area where tourists spent a long time; a security agency trying to identify individuals who spend a long time examining sensitive areas on digital maps.
A common query for these scenarios may be to find all places where a particular moving object spent more than a number of time units during its journey. This query, shown below, was applied to the set of trajectories corresponding to the completion of a single user task. The output reveals various points or groups of points on the map that were of potential interest to users.
query userDataCombF feed {o} filter [.TaskName_o = "Task01"] userTrajectory feed {p}
Product
filter[.SessionID_o=.TrajID_p] extend[Stations:
breakpoints(.Traj_p, create_duration(0,200))]
project[ID_o,UserName_o,Sessi onID_o,Stations]
consume
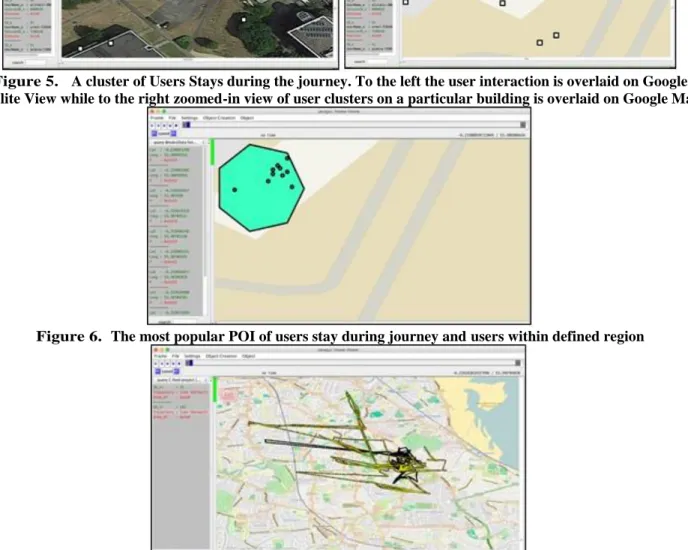
In this query, user data were used to relate user trajectories with their corresponding user ID and task. Only those trajectories which involved the first task were filtered. Two relations userDataCombF and userTrajectory are differentiated by using aliases o, p. Cross product of the relations using common IDs was carried out using product filter operator. The complete stream of data was then extended with Station's attribute which are geographical points calculated using breakpoints operator. The operator computes all geographic points where the moving points (mpoint) stops longer than the given duration. The output of the query was then overlaid on Google satellite imagery as shown in Figure 5. It was revealed that the point of greatest interest was a bank.
To further investigate, a few regions of the UCD campus (i.e., bank, Starbucks coffee shop, Arts cafe, bus stop and library) were selected. A query was designed to find how many users visited the selected regions of interests while performing all tasks as shown below:
let StayPoints = userDataCombF feed {o} userTrajectory feed {p} product
filter[.SessionID_o=.TrajID_p] extend[Stations: breakpoints (.Traj_p, create_duration(0,200))] project[ID_o,UserName_o,Sessi onID_o,Stations]
projectextendstream[ID_o;StopP oints:
components(.Stations)]
projectextend [ID_o; Sta:
get(.StopPoints,0)]
filter [.Sta inside DefinedRegion] consume
from all user’s trajectories against all tasks they performed. Such information could be valuable, for example, in training a personalisation algorithm. Map items can be rated based on the information collected from Table 1. For example, if a user is interacting with cafe, the highest interest score will be assigned to the cafe as opposed to other map items. The information gained from this spatio-temporal query could be fed to personalization algorithms [4] and collaborative filtering techniques [20].
4.4 Crime Event Simulation
Most of the crimes are being conducted with the help of cell phones. The use of GSM technology in crimes and terrorism has expanded to such an extent that the government has no other way to handle this and it resorts to shutting down the service when the threat is higher. Some of the high profile crime cases in the past were solved by analyzing the data from GSM telecommunication towers. The procedure adopted by law enforcement agencies is totally manual and because of lack of use of modern technology, misses key information that could have been extracted by using modern data mining techniques. Cellular data can be used to determine the movement of individuals in the area where a crime/terrorist incident occurred and their call and messaging/social behaviour. The law enforcement agencies generally use CDRs (Call Detail Records) to aid their investigation. The movement behaviour that can be extracted from CDRs is very coarse and does not offer exact location of individuals. Currently there exists no research which can aid analysis of movement and social behaviour in relation to occurrence of a criminal/terrorist incident using coarse movement and social data. As part of this research, we simulated a use case with respect to the occurrence of a criminal/terrorist incident. The cellular data also corresponds to trajectories which are discussed here.
Crime investigation is an important data analysis task, which makes use of various statistical analysis approaches like hotspot analysis or geo-visualization techniques. Although they present a good approximation, these techniques can be improved using spatial-temporal analysis. Mobility data analysis using Secondo offers many of the pattern analysis techniques, which can be applied to find a flock, convergence, leadership, and convoy patterns [12] [7]. Using the HCI-collected dataset as a proxy data for this scenario, we considered a hypothetical crime
investigation case where a heist occurs at a bank within the study area. The objective of this analysis is to identify a list of suspected individuals who visited an area within ten meters of the crime scene between 31st July 2012 Midnight to 07 Aug 2012 Midnight. This time window is large due to the user’s trial data being collected over a period of several months. The design of the query includes two parts. Firstly, a buffer of 10 meters around the bank is created to restrict the spatial extent of the region of interest and to limit the list of suspects to users who passed within this region. Secondly, the time window is defined to restrict the query to individuals present during the crime period. The intersection of these two queries revealed all those suspects who were present within ten meters of the bank during the specified time. Only two individuals match the criteria (see Figure 7). When we increased the time window to 10 July 2012 and 15 August 2012, the number of suspects increased to 13.
let suspects = trip feed {tr} buffer feed {bf} symmjoin [.TripData_tr passes ..Area_bf]
extend [
Range:theRange(inst(initial(.Trip Data_trat.Area_bf)),
inst(final(.TripData_tr at
.Area_bf)), FALSE,TRUE),
Trajectory:
trajectory(.TripData_tr)] filter[
.Range intersects
theRange( [const instant value "2012-08-07"],
[const instant value
"2012-07-31"],FALSE, TRUE)] consume
Figure 1. UCD Campus Map
Figure 2. Reconstructed Trajectories overlaid on Google Map
Figure 3. Sensitive areas highlighted on the map based on user interactions. Visual interpretation shows the buildings and areas where more activities are performed by users and for a longer
duration.
Figure 4. Areas highlighted using business intelligence. A buffer is drawn around two locations (left); the zoomed-in view (right) represents the buffers around areas visited by more users hence revealing
Figure 5. A cluster of Users Stays during the journey. To the left the user interaction is overlaid on Google Satellite View while to the right zoomed-in view of user clusters on a particular building is overlaid on Google Maps.
Figure 6. The most popular POI of users stay during journey and users within defined region
Figure 7. Crime scene investigation showing two potential suspects. The individual tracks of these suspects can be extracted from the underlying database and further scrutinised. The visual representation shows a complete user
movement pattern over a certain period.
Table 1: Map items and number of visits
Task Bank Starbucks ArtsCafe BusStop Library
1 15 3 14 1 26
2 0 11 20 10 8
3 0 11 1 3 11
4 0 3 6 5 4
5 0 1 2 1 1
6 0 15 8 0 20
7 0 0 3 3 1
8 0 0 1 0 0
9 0 0 3 3 1
10 0 0 1 0 0
5. Conclusions
This article discusses the application of advanced data analysis techniques for mobility data. The purpose of such techniques is to gain knowledge from movement data to develop services such as personalised maps. Such analysis can quickly and effectively be applied to several domains including event detection and crime analysis. In this paper, we focus on demonstrating and evaluating the functionality available in Secondo, an open source tool for trajectory storage and manipulation. Several spatio-temporal queries are presented which reveal the spatial and temporal characteristics of individuals and groups. The queries relate to real life examples of movement behavior and patterns. The results indicate that Secondo can be used as a powerful tool for designing and running basic and advanced queries using the built-in spatial and temporal operators.
In our previous work, we had developed a geo-visual analytics tool [5]. While such a tool proved very useful for visual inspection of trajectory data, it did not provide any support for designing and implementing complex spatio-temporal database queries. Such a tool could be combined with Secondo to offer sophisticated geo-visual analysis of the query results, like CommonGIS [14] with the advantage of being open source.
Although Secondo is a powerful tool, which supports built-in spatio-temporal data types, there is a learning curve to become familiar with the range of functions it provides. We are exploring Secondo further to perform more extensive and advanced analysis on user interaction data. For example, we will examine the use of Parallel Secondo, which is an extension of Secondo that supports distributed processing when the volume of spatial data becomes very large. For example, user-generated map trajectories within a non-constrained environment and which are not constrained by specific tasks are random and may become very large. Processing these complex spatio-temporal data is very computationally intensive. We aim to explore Parallel Secondo in the context of spatial big data [15]. Parallel Secondo which is based on HADOOP 0.20.2 in a cloud environment provides a mechanism to process large datasets by performing map reduce operations on a cluster of computers. Overall our proposed research dimensions can assist in various fields including personalising map content and support the completion of spatial tasks by improved understanding of user behaviour through their usage patterns in space and time.
Acknowledgements
The authors gratefully acknowledge Dr. Thomas Behr and Dr. Ralf Hartmut Gu¨ting from Faculty of Mathematics and Informatics, University of Hagen, Germany for their technical support and answering queries related to Secondo.
References
[1] Dix, A., Finlay, J. and Abowd, G.
(2004), Human-computer interaction,
Prentice Hall.
[2] Han, J. (2005), Data Mining: Concepts
and Techniques, Morgan Kaufmann
Publishers Inc., San Francisco, CA, USA.
[3] Morris, B., and Trivedi, M. (2009),
Learning trajectory patterns by
clustering: Experimental studies and
comparative evaluation, in ‘IEEE
Conference on Computer Vision and Pattern Recognition, 2009. CVPR 2009.’ pp. 312 –319.
[4] Ballatore, A., Tahir, A., McArdle, G.
and Bertolotto, M. (2011), “A comparison of open source geospatial
technologies for web mapping”,
International Journal of Web Engineering and Technology, Vol. 6, Inderscience Publishers, pp. 354–374.
[5] Tahir, A., McArdle, G. and Bertolotto,
M. (2011), Visualising user interaction history to identify web map usage patterns, in ‘14th AGILE International
Conference on Geographic Information Science, Advancing Geo-information Science for a Changing World’, Utrecht, The Netherlands.
[6] Guting, R. H., Almeida, V., Ansorge, D., Behr, T., Ding, Z., Hose, T., Hoffmann, F., Spiekermann, M. , and Telle, U. (2005), Secondo: An extensible DBMS platform for research
prototyping and teaching, in ‘Data
Engineering, 2005. ICDE 2005.
Proceedings. IEEE, pp. 1115–1116.
[7] Vieira, M. R., Bakalov, P. and Tsotras,
V. J. (2009), the On-line discovery of flock patterns in spatio-temporal data,
in ‘Proceedings of the 17th ACM
SIGSPATIAL international
conference on advances in geographic information systems’, ACM, pp. 286– 295.
[8] Nanni, M., Trasarti, R., Renso, C.,
Giannotti, F. and Pedreschi, D.
(2010), Advanced knowledge
discovery on movement data with the
geopkdd system, in ‘Proceedings of
the 13th International Conference on Extending Database Technology’, ACM, pp. 693–696.
[9] Guting, R., Behr, T. and Duntgen, C.
(2013), Trajectory databases, in
‘Mobility Data: Modeling,
Management and Understanding’, Cambridge University Press, pp. 43– 62.
[10] Pelekis, N., Theodoridis, Y.,
Vosinakis, S. and Panayiotopoulos, T. (2006), Hermes – a framework for
‘Advances in Database Technology-EDBT 2006’, Springer, pp. 1130–1134.
[11] Gerasimos, M., Maria, L. D., Nikos,
P., Yannis, T., and Zhixian, Y. (2013),
Trajectory collection and
reconstruction, in ‘Mobility Data:
Modeling, Management and
Understanding’, Cambridge
University Press, Cambridge, pp. 23– 42.
[12] Gudmundsson, J., van Kreveld, M.
and Speckmann, B. (2004), Efficient detection of motion patterns in spatio-temporal data sets, in ‘Proceedings of
the 12th annual ACM international workshop on Geographic Information Systems’, ACM, pp. 250– 257.
[13] Thomas, J. and Cook, K. (2006), “A
visual analytics agenda”, Computer
Graphics and Applications, IEEE, Vol. 26, IEEE, pp. 10–13.
[14] Andrienko, G., Andrienko, N., Voss, H.
and Michael, P. (2003), “Gis for everyone: the commongis project and
beyond”, Maps and the Internet,
Elsevier Science, Oxford, pp. 131–146.
[15] Shekhar, S., Gunturi, V., Evans, M. R.
and Yang, K. (2012), Spatial big-data challenges intersecting mobility and cloud computing, in ‘Proceedings of
the Eleventh ACM International Workshop on Data Engineering for
Wireless and Mobile Access’, ACM, pp. 1–6.
[16] Reichenbacher, T., and Swienty, O.
(2007), Attention-guiding
geovisualisation, in ‘Proceedings of
the 10th AGILE International
Conference on Geographic
Information Science, 8th-11th May, Aalborg University, Denmark’.
[17] Ooms, K. and De Maeyer, P. (2015),
Georeferencing eye tracking data on interactive cartographic products, in
‘Proceedings of the 27th International Cartographic Conference’.
[18] Jacob, R. and Karn, K. S. (2003), “Eye
tracking in human-computer
interaction and usability research: Ready to deliver the promises”, Mind, Vol. 2, Citeseer, p. 4.
[19] Giannotti, F. and Pedreschi, D. (2008),
Mobility, data mining and privacy: Geographic knowledge discovery, Springer.
[20] Tahir, A., McArdle, G. and Bertolotto, M. (2012), Identifying specific spatial tasks through clustering and geovisual analysis, in
‘Geoinformatics