ISSN: 2347-7474
International Journal Advances in Social Science and Humanities
Available online at: www.ijassh.com
RESEARCH ARTICLE
Work Life Balance of Women Teachers in Educational Institution
of Sivakasi
M. Rifaya Meera1, K. Renuga Devi2, R. Padmaja3*, R. Mohammed Abubakkar Siddiqu3
1Assistant Professor, department of Commerce, Ayya Nadar Janaki Ammal College, Sivakasi, India. 2,3Research Scholar, Department of Commerce, Ayya Nadar Janaki Ammal College, Sivakasi, India.
Corresponding Author: R. Padmaja
Abstract
Today, Work-life balance (WLB) has become a subject of concern for business leaders in view of the contemporary demographic, technological, market, and organizational changes associated with it. Work Life Balance for women employees is highly desirable, if there is no job satisfaction & consistency in life, it can create a dilemma to them. Work Life Balance requires attaining equilibrium between professional work and personal work, so that it reduces friction between official & domestic life. The ultimate performance of any organization depends on the performance of its employees, which in turn depends on numerous factors such as job satisfaction, family or both. A study is conducted among the working women teachers of educational institutions of Sivakasi. Work life Balance has become one of the most important issues these days in every Education Institution. This study on Work life Balance among women teachers at Sivakasi, there is a vital need to know the balance level of teachers with regard to both their work and family or personal life. If the work-life is good, the functioning of the Institution will be in a smooth and proper manner. Primary data were collected with the help of the structured questionnaire from the teachers. Secondary data was collected from earlier research work, various published journals, magazines, websites and online articles. Work Life Balance provides for the balanced relationship among work, non- work and family aspects of life. The sampling method adapted to this study is proportionate random sampling and the sample size considered for the study was 90 teachers (450 total teachers in education institution i.e., 15 institutions). The tools for the analysis include Descriptive analysis, Cross tabulation, Chi-square analysis. This research study will definitely help teachers on balancing towards work-life.
Keywords: Work life balance, Women employees, Sivakasi, Educational institutions, Proportionate random sampling technique.
Introduction
The role of work has changed throughout the world due to economic conditions and social demands. Originally, work was a matter of necessity and survival. Throughout the years, the role of “work” has evolved and the composition of the workforce has changed. Today, work still is a necessity but it should be a source of personal satisfaction as well. Work-Family Life Balance does not mean an equal number of hours for various work and personal activities. It is defined as an individual’s ability to meet their work and family commitments, as well as other non-work responsibilities and activities. In addition to the relations between work and family functions it also involves other roles
in other areas of life. It includes proper prioritizing between "work" (career and ambition) on one hand and "life" (health, pleasure, leisure, family and spiritual development) on the other. Work- life balance is defined as an individual’s ability to meet their work and family commitments, as well as other non-work responsibilities and activities.
hand and "life" (health, pleasure, leisure, family and spiritual development) on the other. Work-life balance means different things to different people and different things at different stages of life. However, any definition for anyone must include the problems of lack of time and exhaustion. Professional life means the aim to grow and earn respect in the organization and society at large and Personal life means taking care of family, children, parents, health and spending the leisure time effectively. With the development in educational, economic and social standards, things have improved to a great extent and the role of faculty in balancing their lifestyle is less taxing.
Work – life balance for teaching professional has become one of the greatest challenges in today‘s world. Teachers work load not only demand their time in the institution but also extend to their home so as to get prepared for the following day, apart from maintaining student records and attending to various institution related functional requirements. Teachers need to spend extra hours every day to be effective and productive in their profession so that they could reach higher levels and face the challenging atmosphere. Moreover, teachers not only look forward towards teaching, but need to also focus on soft skills and life skills so that they not only produce good professionals but also develop good citizens.
Statement of the Problem
Women are making their presence felt on the teaching sense. The percentage of women to total Teachers in Educational Institution is on the increasing trend. Although women teachers in educational institution are bright and hardworking, they have special problems which lead to a high rate of absentees and disinclination to taken on challenges and responsibilities in work- life balance. Work family imbalance occurs when the demands of work are in disharmony with the demands of family. Work family conflict can be time based, strain based and behavior based. Time based conflict arises when the amount of time devoted to work role interferes with performing family related responsibilities or vice versa. Strain based conflict occurs when strain from one role makes it difficult to perform in another role. Behavior based
conflict occurs when the behavior in one role is not compatible with the behavior that is necessary for other role. Research indicates that failure to achieve the correct balance of effort and rest is linked to a feeling of lack of control over the workload, plus lack of energy to fulfill personal goals and commitments. If the balance is wrong, the result may include fatigue, poor performance and a poor quality of life. Hence the Researcher has made an attempt to study the work life balance of women teachers in educational institution of Sivakasi.
Scope of the Study
The study is confined to Sivakasi, Virudhunagar District of Tamilnadu. The scope of the study is very limited and approach of the study focuses mainly on the angle of Private School Teachers.
Objectives of the Study
The following are the specific objectives of the study.
To know the Socio, Economic, Demographic of the respondents.
To measure the level of stress of
respondents in working place.
To measure the factors affecting the Professional and Personal Life of respondents.
To find out the suggestion and conclusion based on the findings of the study.
Hypotheses of the Study
There is no relationship between among the age of the respondents and their opinion on stress level.
There is no significant relationship
between among the marital status of the respondents and their opinion stimulation factors.
There is no significant relationship
between among the spent time with their children of the respondents and their opinion stimulation factors.
Methodology
also been held with the teachers, who are teaching in the matriculation schools for getting required information. Secondary data is also collected from various studies, books, journals, magazines and websites to supplement the present study.
Sources of Data
The present study is based on primary data and secondary data. The data are collected from every possible source.
Primary Data
The primary data were collected from the women teachers in educational institution using questionnaire ways. In the present study utmost care has been taken to reduce the non-sampling errors. The Researcher had paid attention to reduce response error. Secondary Data
The secondary data needed for this study are collected from journals, books, magazines, articles, government records, and websites and so on.
Sampling Design
The study has been undertaking from the point of view of the teachers employed in Matriculation Schools in Sivakasi. There are 450 women teachers are working in Matriculation Schools in Sivakasi. Thus, the researcher was unable to collect the data from the entire population i.e. teachers from Sivakasi. Out of the 450 women teachers the researcher has selected 20% of the population i.e., 90 sample respondents with the help of sampling proportionate random sampling.
Review of Literature
The Researcher has reviewed the following literature related to the study.
Artemis Chang, Paula McDonald and Pauline Burton [1], The way individuals balance their work and non-work lives is an area of academic enquiry that has received increasing scrutiny over the past two decades. Theoretical orientations and the operationalization of their related constructs in empirical research have evolved and developed in response to, or at least in parallel with, the progressively higher profile of work-life balance issues and concerns in the media, the rhetoric of political and business leaders, and
organizational policy and human resource priorities.
R. Baral & S. Bhargava, [2], Family-friendliness of employers in India have been reflected in various welfare provisions which has been a matter of concern for employers since industrialization. With time, the scope and coverage of such initiatives have broadened and have become more individual growth and family well-being oriented. However, these policies and practices are more prominent in new economy organisations such as software and services organisations.
A big section of research focuses on the implications of work-life imbalance or measuring the detrimental impact of work life imbalance on various aspects such as job satisfaction, burnout, Organizational commitment, health issues etc. However, very few studies have focuses on the work life balance issues in the teaching profession.
There is a strong, unmet demand among working parents for shortened working hours, part-time work and flexible working time. Management must communicate their organization’s family-friendliness in such a way that all employees feel that they have equal access to alternative working time provisions.
Other Author has revealed the major factors influencing the Work Life Balance of Women professionals in India such as role conflict, lack of recognition, organizational politics, gender discrimination, elderly and children care issues, quality of health, problems in time management and lack of proper social support.
The Educational institutions should address the Work Life Balance related issues among their staff, specifically women and take a holistic approach to design and implement the policies to support the teaching staff to manage their WLB.
employees and more importantly to help them to maintain work life balance with equal attention on performance and commitment at work.
Other Author suggested that the individual harmony and its effects has developed a new Harmony based on conflict and enrichment. Married women employees indeed experience Work Family Conflict (WFC) while attempting to balance their work and family lives. Thus, Organization needs to formulate guidelines for the management of WFCs since they are related to job satisfaction and performance of the employees.
The work based factors and family related factors that are considered to contribute to work life balance. Work based factors are flexi time, option to work part time and freedom to work from home and the family related factors are child care facility and flexibility to take care of emergencies at home.
Ayesha Tabassumb [3] investigated QWL of employees in the private universities of Bangladesh. She designed a 5- point Likert- scale structured questionnaire and collected the data from the 72 fulltime faculty members among 11 private universities. She analyzed the dimensions of quality of work life and its relationship with job satisfaction. This study concluded that there is positive relationship between the dimensions of QWL and job satisfaction. This study suggested to the management of the institutions that the policies designed in such a way that QWL issues should be concerned. An improved QWL provides a higher level of job satisfaction which in turn reduce faculty member turnover rate.
A literature review on quality of work life in academics and explores earlier research in the academic area. The researcher explains quality of work life on Walton’s eight factors. They establish its relationship with employee demographic variable, stress, satisfaction, commitment, performance, job
satisfaction which reveals that the former are the determinant of QWL.
Seema Arif and Maryam Ilyas [4] focused on quality of work life of private universities in Lahore, Pakistan. They explored various dimensions of quality of work life which affect life and the attitude of teachers. This quantitative study took 360 members of university and analyzes their perception of QWL. This study also investigated the QWL effects on employee commitment, engagement, job involvement and reputation of the university. This research suggested that the perceived value of work, work climate, work-life balance and satisfaction are the main factors which shaped the work attitude and also improve employees work life.Various variables that are responsible for employee satisfaction. The Study concluded that an organization should develop strategies that strengthen the work environment and increase the employee morale and employee satisfaction to enhance employee performance and productivity, which ultimately results in high profits. Influential factors contributing to job satisfaction and dissatisfaction of college teachers of district Faisalabad, Pakistan.
And they examine that there were significant differences in job satisfaction between public and private college teachers. Public college teachers are more satisfied than private college. This study suggested that to increase the satisfaction level of teachers of private colleges a proper attention should be paid so that the employers of private sector colleges will be able to retain teachers.
Results and Discussion
Age Wise Classification of the Respondents
Age plays an important role in balancing Work- life for women teachers. The age of the respondents is classified into four categories. Table 1 shows the age wise classification of the respondents.
Table 1: Age wise classification of the respondents
S. No Age No. of Respondents Per cent to Total
1 Below 25 years 15 16.7
2 25 to 35 years 34 37.8
3 35 to 45 years 28 31.1
4 Above 45 years 13 14.4
Total 90 100.0
It could be noted from Table 1, that 16.7 per cent of the respondents are below 25 years of age, 37.8 per cent of the respondents are in the age group of 25 to 30 years, 31.1 per cent of the respondents are from 35 to 45 years of age, but only 14.4 per cent of the respondents are above 45 years age.
This study analyses the age of the women teachers in Matriculation Schools. The majority 37.8 per cent of the respondents are coming under the age group of 25-35 years. Educational Qualification
Table 2 shows the educational wise classification of the respondents.
Table 2: Educational qualification
S. No Qualification No. of Respondents Per cent to Total
1 Post Graduate 39 43.3
2 Professional 32 35.6
3 Under Graduate 14 15.6
4 Others 05 05.6
Total 90 100.0
Source: Primary data
Table 2 results that are 43.3 per cent of the respondents are Post graduate, 35.6 per cent of the respondents are professional, 15.6 per cent of the respondents are Under Graduate and 5.6 Per cent of the respondents are anther like Teacher Training.
Regarding the educational qualification the majority 43.3 per cent of the respondents are post graduate.
Monthly Income of the Respondents Monthly income of the respondents is analyzed in the Table 3
Table 3: Monthly income of the respondents
S. No Income Level No. of Respondents Per cent to Total
1 4000-6000 28 31.1
2 7000-12000 28 31.1
3 13000-18000 18 20.0
4 19000-24000 16 17.8
Total 90 100.0
Source: Primary Data
The above classification is on the basis of their income earnings. It is classified into 4 categories. 31.1 per cent of the respondents are earning Rs.4000 to Rs.6000, 31.1 per cent of the respondents are earning between Rs.7000 to Rs.12000, 20.0 per cent of the respondents are earning between Rs.13000
to Rs.18000, 17.8 per cent of the respondents are earning between Rs.19000 to Rs.24000. The majority 31.1 per cent of the respondents are earning both level Rs.4000-6000 and 7000-12000.
Marital Status of the Respondents The following Table 4 the marital status of the respondents.
Table 4: Marital status of the respondents
S. No Marital Status No. of Respondents Per cent to Total
1 Married 64 71.1
2 Unmarried 26 28.9
Total 90 100.0
Source: Primary Data
It is observed from Table 4 that 71.1 per cent of the respondents are married and 28.9 per cent of the respondents of unmarried.
Regarding the marital status, the majority 71.1 per cent of the respondents are married.
Employment Status of Respondents Spouse
Table 5 shows the employment status of respondent’s spouse.
Table 5: Employment status of respondents spouse
S. No Occupation No. of Respondents Per cent to Total
1 Employed 20 30.77
2 Business 28 43.08
3 Professional 15 23.08
4 Others 02 03.07
Total 65 100.0
From the above Table 5, it is clear that out of 65 respondents those who are married, 30.77 percent of the respondents’ spouses are employed, 43.08 per cent of the respondents’ spouses are doing business, 23.08 per cent of the respondents’ spouses is professional and remaining 3.07 per cent of
the respondents’ spouses and another category.
The majority 43.08 per cent of the respondents’ spouses are doing business. Information about Children
Table 6 shows information about children.
Table 6: No. of respondents having children
S. No Having Children No. of Respondents Per cent to Total
1 Yes 60 93.75
2 No 04 06.25
Total 64 100.0
Source: Primary Data
From the above Table 3.7, it is clear that out of 64 respondents those who are married, 66.7 per cent of the respondents are having child and remaining 4.4 per cent of the respondents does not have any child.
The majority 93.75 per cent of the respondents are having children.
Time Spent With Children
Table 7 expresses the time spent by the respondents with the children.
Table 7: Time spend with children
S. No Time Spent No. of Respondents Per cent to Total
1 Less than 3 Hours 13 21.31
2 3-6 Hours 30 49.18
3 6-9 Hours 17 27.87
4 9-12 Hours 01 01.64
Total 61 100.0
Source: Primary Data
Table 7 shows that out of 61 respondents those have child, 21.31 per cent of the respondents’ spent less than 3 hours, 49.18 per cent of the respondents’ spent 3-6 hours, 27.87 per cent of the respondents’ spent 6-9 hours and remains 1.64 per cent of the respondents’ spent 9-12 hours with their children during the time. The researcher has also collected data regarding the time spent with their children.
The majority 49.18 per cent are spending 3-6 hours per day.
Family Type of the Respondents
Table 8 gives the classification of the respondents based on the type of family: Joint and Nuclear family.
Table 8: Family type of the respondents
S. No Family Type No. of Respondents Per cent to Total
1 Joint 35 38.9
2 Nuclear 55 61.1
Total 90 100.00
Source: Primary Data
On the basis of the analysis of the table 8 it is understood that 38.9 per cent of the respondents are living with joint family and 61.1 per cent of the respondents are living with nuclear family.
The majority 61.1 per cent of the respondents, women teachers are living with the type of nuclear family.
Years of Working Experience
Table 9 shows the Years of working experience of the respondents.
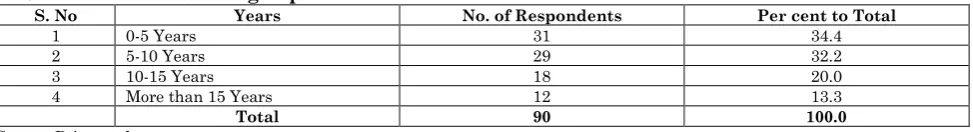
Table 9: Years of working experience
S. No Years No. of Respondents Per cent to Total
1 0-5 Years 31 34.4
2 5-10 Years 29 32.2
3 10-15 Years 18 20.0
4 More than 15 Years 12 13.3
Total 90 100.0
It could be noted from Table 9, that 34.4 per cent of the respondents are having the experience 0 to 5years, 32.2 per cent of the respondents are having the experience the groups of 5 to 10 years, 20.0 per cent of the respondents are having the experience from 10 to 15 years, but only 13.3 per cent of the respondents are having the experience above 15 year.
Regarding the years of working, the majority 32.2 per cent of the respondent are working in 5-10 years in their schools.
Frequency of Depression Due To Work Table 10 shows the frequency of depression due to work
Table 10: Frequency of depression due to work
S. No Depressed No. of Respondents Per cent to Total
1 Never 8 08.9
2 Rarely 35 38.9
3 Sometimes 39 43.3
4 Often 07 07.8
5 Always 01 01.1
Total 90 100.0
Source: Primary Data
Table 10 shows that 8.9 per cent of the respondents do not get any depression, 38.9 per cent of the respondents depressed rarely, 43.3 per cent of the respondents depressed sometimes, 7.8 per cent of the respondents depressed often and 1.1 per cent of the respondents always depressed because of their work.
The researcher has brought out the respondents’ frequency of depression is sometimes, the majority 43.3 per cent respondents are depressed for sometimes. Initiatives of Respondents
Table 11 shows the methods which help the respondents to manage the stress arising from the work.
Table 11: Initiatives of respondents
S. No Methods No. of Respondents Per cent to Total
1 Yoga 10 11.1
2 Meditation 17 18.9
3 Entertainment 19 21.1
4 Music 40 44.4
5 Others 4 04.4
Total 90 100.00
Source: Primary Data
Table 11 shows that 11.1 per cent of the respondents are doing yoga, another 18.9 per cent of the respondents are doing meditation, 21.1 per cent of the respondents using entertainment, 44.4 per cent of the respondents are listening music to reduce the stress and 4.4 per cent of the respondents are spending time with other activities to manage the stress arising from the work.
The researcher has also collected the information viewing the way to manage the stress arising from work. The majority 44.4 per cent of the respondents are managing stress by hearing music.
Ability of Respondents to Balance the Work-Life
Table 12 expresses the ability of the respondents to balance the work-life.
Table 12: Ability to balancing the work-life
S. No Ability to balance No. of Respondents Per cent to Total
1 Yes 70 77.8
2 No 20 22.2
Total 90 100.0
Source: Primary Data
Table 12 shows that 77.8 per cent of the respondents are able to balance the work-life and 22.2 per cent of the respondents are unable to balance the work-life.
The
majority 77.8 per cent of the respondents
are able to balance work- life.
Table 13 shows the respondents who are affected from stress related disease.
Table 13: Information about stress related disease
S. No Stress Related Disease No. of Respondents Per cent to Total
1 Hyper-tension 11 12.2
2 Obesity 13 14.4
3 Diabetes 5 05.6
4 Frequent Headaches 21 23.3
5 None 40 44.4
Total 90 100.0
Source: Primary Data
From the above Table 13 it is clear that 12.2 per cent of the respondents are suffering from Hypertension, 14.4 per cent of the respondents are suffering from Obesity, 5.6 per cent of the respondents are suffering from Diabetes, 23.3 per cent of the respondents are having frequent headaches and mostly 44.4 per cent of the respondents are not suffering from stress related disease.
The majority 44.4 per cent of the
respondents are not suffering from stress
related disease.
Getting Enough Time to Sleep, Exercise and Healthy Foods
Table 14 shows whether the respondents of getting enough sleep, exercise and healthy foods.
Table 14: Getting enough time to sleep, exercise and healthy food
S. No Getting enough time to sleep,
exercise and healthy food No. of Respondents Per cent to Total
1 Yes 65 72.2
2 No 25 27.8
Total 90 100.0
Source:Primary Data
Table 14 expresses that 72.2 per cent of the respondents are getting enough sleep, exercise and healthy foods and 27.8 per cent of the respondents are not getting enough sleep, exercise and healthy foods.
The
majority 72.2 per cent of the respondents
are getting enough sleep, exercise and
healthy foods.
Special Initiatives to Manage Their Diet Table 15 displays the special initiatives taken by them to manage their diet.
Table 15: Special initiatives to manage their diet
S. No Special Initiatives to manage
diet No. of Respondents Per cent to Total
1 Yes 59 65.6
2 No 31 34.4
Total 90 100.0
Source: Primary Data
It could be noted from Table 15 that 65.6 per cent of the respondents are managing diet by taking special initiatives and 34.4 per cent of the respondent are not managing their diet.
The majority 65.6 per cent of the
respondents
are
taking
special
initiatives to manage their diet.
Overcoming Special Initiatives
Table 16 shows the overcoming special initiatives.
Table 16: Take special initiatives
S. No Take Special Initiatives No. of Respondents Per cent to Total
1 Yoga 11 18.64
2 Meditation 15 25.43
3 Avoid fast foods 31 52.54
4 Others 02 03.39
Total 59 100.0
Source: Primary Data
Table 16 shows that 18.64 per cent of the respondents are doing yoga, another 25.43
per cent of the respondents are focused on other initiatives
The majority 52.54 per
cent of the respondents are taking
special initiatives to manage their diet.
Level of Work Load of the Respondents
Table 17 shows the level of work load of the respondent.
Table 17: Level of work load of the respondents
S.NO FACTORS
TIMES
TOTAL
Very High High Medium Low Very Low
1 Work Load 19(21.1) 47(52.2) 18(20.0) 6(6.7) 0 90(100%)
2 Time Management 7(7.8) 47(52.2) 31(34.4) 4(4.4) 1(1.1) 90(100%)
3 Additional Work 8(8.9) 48(53.3) 28(31.1) 5(5.6) 1(1.1) 90(100%)
Source: Primary Data
Table 17 shows that out of 90 respondents, 52.2 per cent of the respondents are highly dominated by work load, 44.4 per cent of the respondents are highly dominated by time management , 53.3 per cent of the respondents are highly dominated because of additional work.
Regarding the level of factors affects the majority 53.3 per cent of the respondents are highly irritated by the additional work.
Factors Affecting Work- Life and Family Commitments
Table 18 expresses how often various factors affecting work- life and family commitments.
SA- Strongly Agree; A- Agree; N- Neutral; DA- Disagree; SDA- Strongly Disagree.
Table 18 Factors affecting work- life and family commitments
S.NO FACTORS TIMES TOTAL
S A A N D A S D A
1 Overtime 22(24.4) 38(42.2) 13(14.4) 17(18.9) 0 90(100%)
2 Work Holidays 20(22.2) 40(44.4) 13(14.4) 11(12.2) 6(6.7) 90(100%)
3 Travelling away from home 15(16.7) 32(35.6) 21(23.3) 20(22.2) 2(2.2) 90(100%)
4 Excessive household work 11(12.2) 35(38.9) 29(32.2) 14(15.6) 1(1.1) 90(100%)
5 Negative attitude of family 9(10.0) 22(24.4) 26(28.9) 18(20.0) 15(16.7) 90(100%)
6 Negative attitude of
colleagues 5(5.6) 21(23.3) 26(28.9) 23(25.6) 15(16.7) 90(100%)
7
Responsibilities at home reduce the effort you can devote to your job
10(11.1) 23(25.6) 32(35.6) 18(20.0) 7(7.8) 90(100%)
8 Pressure to take up
the results 16(17.8) 28(31.1) 30(33.3) 13(14.4) 3(3.3) 90(100%)
9
Work- life balance in the school should be customized to individual needs
9(10.0) 24(26.7) 34(36.8) 20(22.2) 3(3.3) 90(100%
Source: Primary Data
Table 18 shows that out of 90 respondents, 42.2 per cent of the respondents are affected by overtime, 44.4 per cent of the respondents are affected from work on holidays, 38.9 per cent of the respondents are agree because of excessive household work, 28.9 per cent of the respondents are neutral due to negative attitude of family, 28.9 per cent of the respondents are neutral due to negative attitude of colleagues, 35.6 per cent of the respondents are neutral from responsibilities at home reduce the effort respondent can devote to respondent job,
33.3 per cent of the respondents are neutral due to pressure to take up the results and another 36.6 per cent of the respondents are neutral from work life balance policy in the school should be customized to individual needs.
This study analyses the factors affecting work- life and family commitments, the majority 42.2 per cent of them are coming under the agree from overtime.
Hypothesis: 1
“There is no relationship between among the age and depression of work towards factors affecting respondents in balancing work- life balance”.
Table 19 shows age and depression of work of the respondents.
This chi-square is applied to examine the null hypothesis and the computed result
given below.
Table 19: Relationship between age and depression of work cross table
AGE DEPRESS TOTAL
Never Rarely Sometimes Often Always
Below 25 Count 4 5 6 0 0 15
Expected Count 1.3 5.8 6.5 1.2 .2 15.0
25 to 35 Count 3 12 17 2 0 34
Expected Count 3.0 13.2 14.7 2.6 .4 34.0
35 to 45 Count 1 14 9 3 1 28
Expected Count 2.5 10.9 12.1 2.2 .3 28.0
Above 45 Count 0 4 7 2 0 13
Expected Count 1.2 5.1 5.6 1.0 .1 13.0
Total Count 8 35 39 7 1 90
Expected Count 8.0 35.0 39.0 7.0 1.0 90.0
Table 19 (A): Chi- square test result
Value DF Asymp. Sig. (2- Sided)
Pearson Chi- Square Likelihood Ratio
Linear-by-Linear Association N of Valid cases
15.065 15.652 5.121
90
12 12 1
.238 .208 .024
a. 12 cells (60.0%) have expected count less than 5. The minimum expected count is .14.
From the table 19 it is found that the significant value of the chi-square value is 15.065 for the 12 degree of freedom is .238 which is more than acceptable level of 0.05. Hence the null hypothesis framed is accepted. Hence it is concluded that there is no relationship between among age and depression of work.
Hypothesis: 2
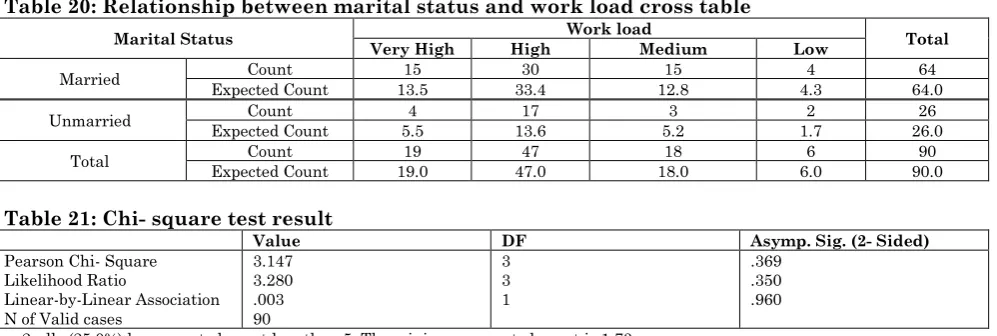
“There is no relationship between among the marital status and workload towards factors affecting respondents in balancing work- life balance”.
Table 20 shows marital status and workload of the respondents.
This chi-square is applied to examine the null hypothesis and the computed result given below.
Table 20: Relationship between marital status and work load cross table
Marital Status Work load Total
Very High High Medium Low
Married Count 15 30 15 4 64
Expected Count 13.5 33.4 12.8 4.3 64.0
Unmarried Count 4 17 3 2 26
Expected Count 5.5 13.6 5.2 1.7 26.0
Total Expected Count Count 19.0 19 47.0 47 18.0 18 6.0 6 90.0 90
Table 21: Chi- square test result
Value DF Asymp. Sig. (2- Sided)
Pearson Chi- Square Likelihood Ratio
Linear-by-Linear Association N of Valid cases
3.147 3.280 .003 90
3 3 1
.369 .350 .960
a. 2cells (25.0%) has expected count less than 5. The minimum expected count is 1.73.
From the table 21 it is found that the significant value of the chi-square value is 3.147 for the 3degree of freedom is .369 which is more than acceptable level of 0.05. Hence the null hypothesis framed is accepted. Hence it is concluded that there is no relationship between the marital status and workload.
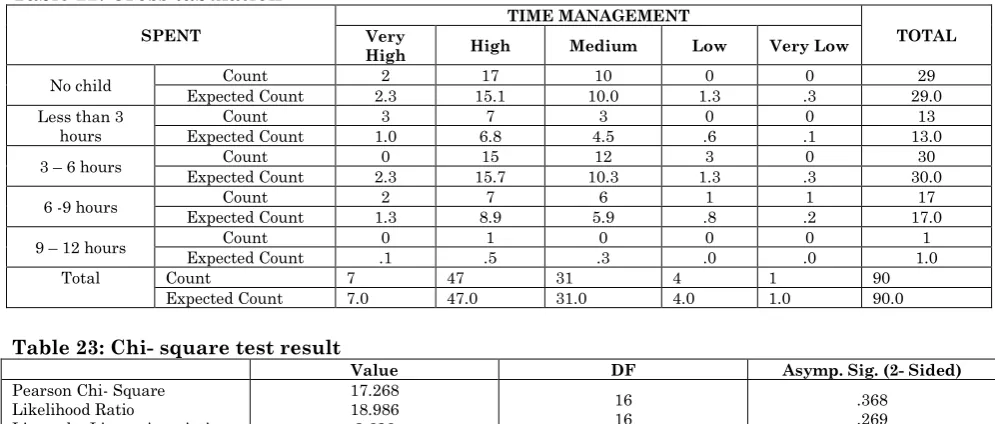
Hypothesis: 3
Table 22 shows spend time with children and level of time management of the respondents. This chi-square is applied to
examine the null hypothesis and the computed result given below.
Table 22: Cross tabulation
SPENT
TIME MANAGEMENT
TOTAL Very
High High Medium Low Very Low
No child Count 2 17 10 0 0 29
Expected Count 2.3 15.1 10.0 1.3 .3 29.0
Less than 3 hours
Count 3 7 3 0 0 13
Expected Count 1.0 6.8 4.5 .6 .1 13.0
3 – 6 hours Count 0 15 12 3 0 30
Expected Count 2.3 15.7 10.3 1.3 .3 30.0
6 -9 hours Expected Count Count 1.3 2 8.9 7 5.9 6 .8 1 .2 1 17.0 17
9 – 12 hours Count 0 1 0 0 0 1
Expected Count .1 .5 .3 .0 .0 1.0
Total Count 7 47 31 4 1 90
Expected Count 7.0 47.0 31.0 4.0 1.0 90.0
Table 23: Chi- square test result
Value DF Asymp. Sig. (2- Sided)
Pearson Chi- Square Likelihood Ratio
Linear-by-Linear Association N of Valid cases
17.268 18.986 2.626
90
16 16 1
.368 .269 .105 a. 18 cells (72.0%) have expected count less than 5. The minimum expected count is .01.
From the table 23 it is found that the significant value of the chi- square value 17.2678 for the 16 degrees of freedom is .368 which is more than the acceptable level of 0.05. Hence the null hypothesis framed is accepted. Hence it is concluded that there is no relationship between among the time spend with children and level of time management.
The researcher has identified the following findings on the basis of analysis and interpretation of the data from the women teachers.
Findings of the Study
This study analyses the age of the women
teachers in matriculation schools. The majority 37.8 per cent of the respondents are coming under the age group of 25-35 years.
Regarding the educational qualification, the majority 43.3 per cent of the respondents are post graduate.
The researcher has also collected the data regarding the income of the Women Teachers in Matriculation Schools. The majority 31.1 per cent of the respondents are earning both level Rs.4000-6000 and 7000-12000.
Regarding the marital status, 71.1 per cent of the respondents are married.
The majority 43.08 per cent of the
respondents’ spouses are doing business.
The researcher has also collected the data regarding the no. of. married respondents having children. The majority 93.75 per cent are having children.
The researcher has also collected data regarding the time spending with their children. The majority 49.18 per cent are spending 3-6 hours per day.
The majority 61.1 per cent of the women teachers are living in the type of nuclear family.
The researcher has bought out the
respondents’ frequency of depression due to work 43.3 per cent respondents are depression sometimes.
The researcher has also collected the information viewing the way to manage the stress arising from work. The majority 44.4 per cent are managing stress by hearing music.
The majority 77.8 per cent of the
respondents are able to balance work- life.
The majority 44.4 per cent of the
The majority 72.2 per cent of the respondents are getting enough sleep, exercise and healthy foods.
The majority 65.6 per cent of the
respondents are taking special initiatives to manage their diet.
Mostly 52.54 per cent of the respondents are taking special initiatives to manage their diet.
Regarding the level of factors affects, the majority 53.3 per cent of the respondents are highly feel because of additional work.
This study analyses the factors affecting work- life and family commitments, the majority 42.2 per cent of them are coming under the agree from overtime.
From the above analysis, the researcher found that there is no significant relationship between age, educational level, monthly income, family type, and year of working of the respondents and their level work- life balance of women teachers.
Recommendations
From the above discussion, it is reasonable to suggest that modern organizations, especially educational institutions, should address the Work Life Balance related issues among their staff, specifically women and take a holistic approach to design and implement policies to support the teaching staff to manage their work life balance which would add to the performance of these staff members. The present study suggests the following points to balance Work- Life.
22.2% of the respondents couldn’t able to Balance their Work- Life. Hence the researcher find a suggestion for this type of respondents, regular Exercises, Meditation and other Soft Skill can able to Balance Work- Life of the Women Teachers.
55.5% of the respondents are affected from various stress related diseases. Hence the researcher suggested that they should take the regular Sleep and Healthy Food, it is very helpful to stress related problems
27.8% of the respondents are not having enough sleep, exercises and healthy food. Hence the researcher suggested for the Teachers that they should follow or
concentrate the meditation, exercises, yoga and so on.
34.4% of the respondents didn’t take any special initiatives to manage their diet. Hence the researcher suggested that they should regularly get special initiatives like in the way of avoiding fast foods.
21.1% of the respondents are facing very high level of work load problems. Hence the researcher find the suggestion for this type of respondents, the Women Teachers should avoid the unwanted work.
1.1% of the respondents do not know about time management. Hence the researcher suggested that they should fix the personal time schedule for each and every event [5-12].
Conclusion
Now-a-days we can see women in working all types of profession signifying that there is no gender difference in work. Women are also performing well and achieve lot in their work. This is a positive development that women are making their presence in different walks of life. On the other hand, for every woman there is one more background to manage, which is home and personal life.
They are facing huge number of problems in managing work life and personal life. The pressure of the work or personal life can lead to stress. According to studies, it has been found that such situation affects person’s health both physiologically and psychologically. Therefore, it is important for employees to maintain a healthy balance between work and their private lives.
Also our research study aims to figure out the working environment of Matriculation Schools for Women Teachers and what is the perception of women about the initiative and effects of those initiatives taken by the schools because work- life balance is not a problem to be solved. It is an ongoing issue to be managed.
family produces stresses which makes them difficult to fulfill work and family responsibilities satisfactorily. Therefore, from the study result is can be argued that
support at work and family are the key factors for maintaining balance between work and family life.
References
1 Chang Artemis, McDonald Artemis And Burton Pauline (2010) Methodological Choices In Work Life Balance Research 1987 To 2006: A Critical Review, The International Journal Of Human Resource Management.
2 Baral1 R, Bhargava S (2011) HR Interventions for Work-Life Balance: Evidences from Organizations In India, International Journal Of Business, Management and Social Sciences Vol. 2, No. 1
3 Tabassum A (2012) Interrelations between Quality of Work Life Dimensions and Faculty Member Job Satisfaction in the Private Universities of Bangladesh, European Journal of Business and Management, 4(2):78-89. 19.
4 Arif S, Ilyas M (2013) Quality of Work- life model for Teachers of Private Universities in Pakistan. Quality Assurance in Education, Emerald Group Publishing Limited. 21(3):282-298.
5 Aditi Aeran, Ravindra Kumar (2015) Impact on life of women employees in education sector, Indian journal of science research, 6(1):57-62.
6 Sudha and Karthikeyan (2014), Work life balance of women employee: A Literature Review, International Journal of Management Research and Review, 48(3):797-804.
7 Shiney Chib (2012) “Quality of Work Life and Organisational Performance Parameters at Workplace”, SEGi Review, 5(2):36-47.
8 Bhattacharya Soumya, Mehra Puja, (October 2010) Corporate Aparatheid, Business Today.
9 Chawla Deepak, Sondhi Neena (2011) Assessing Work- L i fe Balance among Indian Women Professionals, The Indian Journal Of Industrial Relations, Vol 47, No. 2
10 Divya D, Suganthi L & Samuel Anand A (2010) Work Life Balance of IT Women Professionals belonging to the age Group 20-35 In India, Advances In Management., Vol. 3, No. 1
11 Employees' Family Lives: The Facilitating Role of Work- Family Integration, Academy Of Management Journal, Vol. 52, No. 1.