STRUCTURAL, ELECTRICAL AND OPTICAL STUDIES OF
NEWLY SYNTHESIZED STEROIDAL IMIDAZOLE BASED
NICKEL MOLYBDATE COMPOSITE
Ayaz Mahmood Dar
[a]*, Shafia Mir
[b], Urfi Ishrat
[a], Shamsuzzaman
[a]Keywords: Steroidal imidazole, Band gap, Conductivity, Impedance, SEM
The synthesis of the steroidal imidazole and nickel molybdate based composite membrane is described. The fabricated composite material was characterized by using FT-IR, XRD, PSA and SEM and has been investigated for its functional, diffusive, structural, electrical and optical properties. The SEM showed that membrane has random non-preferential orientation with no visible cracks and appeared to be composed of dense and loose aggregation of small particles. No impurity peak was observed in the XRD pattern showing the single phase composite formation. The IR spectra showed the characteristic absorption peaks of different functional groups present in the composite. It was observed that real impedance decreased with the increase in frequency while AC conductivity gradually increased with the increase in frequency of applied AC due to hopping phenomenon. It was also confirmed that with the increase in frequency, the dielectric constant decreased and became almost constant at high frequencies for both compositions. The UV-vis spectrum of the synthesized composite indicate band gap energy of about 3.1 eV showing a weak blue shift compared to 4.6 eV for the bulk. Due to their optical and electrical properties, nano phase composite is promising candidate for use as selectivity of different cations.
*Corresponding Authors: Ayaz Mahmood Dar E-Mail: [email protected]
[a] Department of Chemistry, Aligarh Muslim University, Aligarh 202002, India
[b] Department of Chemistry, Govt Degree College Kulgam 192231, University of Kashmir, J&K, India
Introduction
Self-assembly of organic compounds with cholesteryl groups has proved to be attractive in the field of nanotechnology research. Some steroid derivatives are known to form ordered structures which indicate thermotropic and lyotropic liquid crystalline while other derivatives form monolayers, multilayers and micelles.1 The steroid molecule undergoes rapid uncatalyzed transmembrane and intermembraneous transfer.2,3 The bulk effects of cholesterol on membrane phase transitions and, as a consequence, on membrane fluidity and permeability have been well documented.4,5 In addition, the ordered arrays of steroid molecules or mesogens result in the formation of liquid crystalline (LC) mesophases during which orientation order arises from parallel arrangement of cholesterol while positional order is obtained from attractive forces that hold the assembly together.6-9
The behavior of membrane systems has been extensively investigated by studying the transport properties of artificial membrane10,11 and some of the recent analytical and electronic techniques have added impetus to such investigations. In recent years, many organic compounds and their composites with strong acid functionality such as polyarylene ether sulfone12,13 and sulfonated poly (ether, ether ketone) (SPEEK) 14-17 have showed excellent stabilities and electrochemical properties. However, these membranes require a high pressure humidification system in order to keep liquid water in the polymer matrix.18 In these membranes, the choice of both these components is a problem of material selection, such as polymer-chain rigidity, free volume and the altered interface, all of which
influence transport through the membrane. These membranes have several advantages over organic ion-exchangers example; their ability to withstand ionizing radiations and very high temperature without undergoing degradation and their remarkably high selectivity for heavy toxic metals.19, 20
An organic-inorganic composite membrane (asymmetric membrane) is comprised of more than one material and structure and is usually prepared by multi-step method. The top and sub layer of the membrane can be originated from different polymeric materials with different structures, with each layer able to be optimizing independently. Usually, the top is a thin dense polymer skin formed over a microporous support with a thickness around 0.15 to 1 μm. A major benefit of such hybrid research activities is linked to synergistic effects of organic and inorganic matrix with desired and improved properties in comparison to own unique properties of each components, offering specific advantages of the excellent separation performances, optimum thermal and chemical stability, adaptability to the harsh conditions and membrane forming ability.21-24 Here in we report the synthesis of the composite membrane comprised of steroidal imidazole and nickel molybdate and study its structural, electrical and optical properties.
Experimental
Synthesis of nickel molybdate by sol-gel method
The nickel molybdate was prepared by sol-gel method25 by taking a 0.2 mol trisodium molybdate and mix with 0.2 mol titanium chloride (TiCl3) with continuous stirring. The pH of the mixture was adjusted at 7 by adding 1 M HNO3 or NH3 solutions. The mixing ratio of the reactants was 1:1 (v/v). The nickel molybdate precipitate obtained was washed with deionized water to removed free electrolyte and then dried at 100 °C.
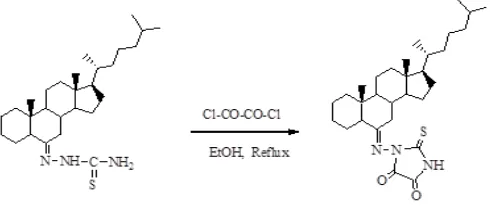
Synthesis of [4, 5-dioxo-2-thioxoimidazole-1-yl] 6-imino-5α-cholestane
To a solution of steroidal thiosemicarbazone (1.5 mmol) in absolute ethanol (20 mL), an equimolar amount of oxalyl chloride was added. The reaction mixture was refluxed for 9 h. The progress and completion of the reaction was monitored by thin layer chromatography. After completion of reaction the excess solvent was removed to three fourths of the original volume under reduced pressure. The reaction mixture was then taken in diethyl ether, washed with water and dried over anhydrous sodium sulphate. Evaporation of solvents and recrystallization from methanol afforded respective product. 26
Scheme 1. Showing the formation of steroidal thioxoimidazole
Characterization of data
White powder; yield: 70 %, Mol. Formula C30H47N3O2S, IR (KBr) ν cm-1: 3310 (NH), 1687, 1675 (C=O), 1518 (C=N), 1236 (C=S), 1029 (C-N); 1H NMR (400 MHz, CDCl3, ppm): δ 7.8 (s, 1H, NH, exchangeable with D2O), 1.17 (s, 3H, C10-CH3), 0.72 (s, 3H, C13-CH3), 0.94 & 0.84
(other methyl protons); 13C NMR (100 MHz, CDCl
3, ppm):
δ 182 (C=S), 163.6 (C=O), 161.3 (C=O), 154.3 (C=N); ESI MS: m/z 513 [M+.].
Preparation of membrane from steroidal imidazole and nickel molybdate
The dried precipitate of nickel molybdate was grounded into fine powder by pestle mortar and then sieved through 200 mesh (granule size ≤ 0.075mm) with grounded steroidal imidazole used as a binder. The optimum quantity of binder was embedded in order to get membrane of adequate mechanical strength. The membrane prepared by embedding
25 % of binder was most suitable for this experiment. Those containing large amount of binder (> 25 %) did not give reproducible results while those containing lesser amount (< 20 %) were quite unstable. The mixture was kept into cast die and then placed in an oven maintain at 200 °C for about half an hour to equilibrate the reaction mixture, then die was transferred to a pressure device (SL-89, UK) with pressure maintained at 60 MPa.
Fourier Transform Infrared Spectroscopy (FTIR)
FTIR spectra of pure steroidal imidazole, nickel molybdate and composite were taken by KBr disc method at room temperature after drying the sample at 40 ºC. The grinding was done using pestle and mortar. To avoid scattering, the particle size of the grounded mixture was limited up to 2 μm.
XRD analysis
The crystallinity, structure and crystal size of pure nickel molybdate and composite were determined with Rigaku Diffractometer (2400) using graded d-space elliptical side-by-side multilayer optics, monochromatic Cu Kα radiation λ = (0.15406 nm) in 2θ range from 20 °C to 80 °C and an imaging plate (R-Axis IV).
SEM analysis
The membrane morphology had been studied using scanning electron microscopy.27,28 The information obtained from SEM images provided guidance in the preparation of well-ordered precipitates.-, The composite pore structure, micro/macro porosity, homogeneity, thickness, cracks and surface texture/morphology had been studied. 29, 30
Particle size analysis
The particle size of composite was analyzed by using laser diffraction. The sample had been mixed with distilled water using ultrasonic treatment. The pre-requisite for understanding the performance of a composite membrane is its complete physico-chemical characterization, which involves the determination of all parameters like thickness, porosity, swelling, water content which affects its electrical properties. The above parameters are shown in Table 1.
Table 1. Physico-chemical characterization of composite membrane
Parameterss Result
Thickness of the membrane (cm) 0.075 Water Content as % weight of wet membrane 0.074 Porosity 0.113 Swelling of %weight wet membrane No swelling
Result and Discussion
Structural properties
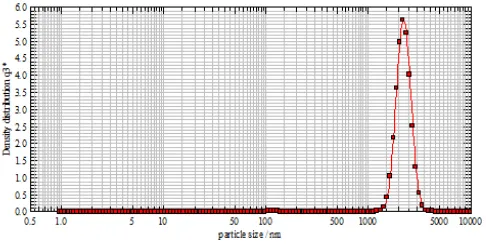
The size of the suspended particle had been measured by laser. The average particle size comes out to be 1157.88, 1473.33 and 1448.46 nm. The reason for such a high value is the preparation method. Sol-gel method gives a uniform and smaller particle size (Figure 1). SEM surface image of the composite membrane of nickel molybdate and steroidal imidazole was taken at 60 MPa pressure and are shown in Figure 2A and the cross-sectional SEM micrograph of the surface is shown in Figure 2B. Membrane had random non-preferential orientation with no visible cracks and appeared to be composed of dense and loose aggregation of small particles. The membrane is macroscopically uniform in thickness and porous in nature. The pores are in the form of uniform capillaries that extend throughout the membrane, and are evenly distributed throughout the surface of the membrane.
Figure 1. The graph shown particle size analysis of the composite.
The thickness is still large as compared to the pore radius and it is assumed that the membrane and adjacent solution (interface) are in equilibrium. The distribution of charge density and mobile species within the pores is assumed to be uniform.
The peak position of the sample at 44.31º and 55.71º shows the presence of nickel molybdate in composite which was confirmed from the ICDD card No. 070356 and the presence of peak position of steroidal imidazole at 21.7º in composite was confirmed from the ICDD card no. 470787. Further, no other impurity peak was observed in the XRD pattern showing the single phase composite formation. The typical XRD patterns of the pure nickel molybdate,31 and its composite with steroidal imidazole are shown in Figure S1 (Supplementary Material).
(A) (B)
Figure 2. SEM images of surface (A) and cross-sectional surface (B) of composite
The IR spectra displays absorption bands in the range of 745, 821 and 964 cm–1, which shows the presence of Mo-O group (Figure S2a, Supplementary material) in nickel molybdate. The Fig. S2b shows absorption peaks at ν 1687 and 1685 cm-1 for two (C=O) groups and absorption peak at 1515 and 1236 cm-1 for (C=N) and C=S, respectively. These peaks confirms the presence of steroidal imidazole fragment. The IR spectrum S2c (Supplementary material) shows the combination of peaks of nickel molybdate and steroidal imidazole, which confirms the formation of composite 32-34
Electrical properties
The electrical properties such as impedance analysis, AC conductivity, dielectric constant and dielectric loss of nickel molybdate and of steroidal imidazole are determined using impedance spectroscopy.
The nickel molybdate powder was pressed into pellets of 13 mm diameter and 0.84 mm thickness and composite powder was pressed into pellet of 0.49 mm thickness for electrical measurements. Dielectric and impedance spectroscopy measurements were carried out in the frequency range 1 kHz to 1 MHz using LCR meter (Agilent 48). The pellets were coated on adjacent faces with silver paste, thereby forming parallel plate capacitor geometry. The value of dielectric constant (ε′) is calculated using the the following formula:
(1)
where,
0 = permittivity of free space,
d = thickness of pellet,
A= cross sectional area of the flat surface of the pellet, cp= capacitance of the specimen in Farad (F)
The complex dielectric constant (ε″) of the samples was calculated using the relation, as follows:
(2)
where tan δ is the dielectric loss which is proportional to the loss of energy from the applied field into the sample and is therefore called as dielectric loss
The AC conductivity of the samples was determined using the relation:
(3)
where, ω is the angular frequency
p
'
c d
A
'
'
'
tan
ac
'
0tan
Table 2. Variation in different electrical parameters as a function of composite
Material Rgb (Ω) Cgb (F) ωgb τgb
Ni-molybdate 5.3668E13 3.954E-20 4.712E5 2.122E-6 Composite 5.4128E6 3.2387E-13 4.7124E5 2.122E-06
Impedance analysis
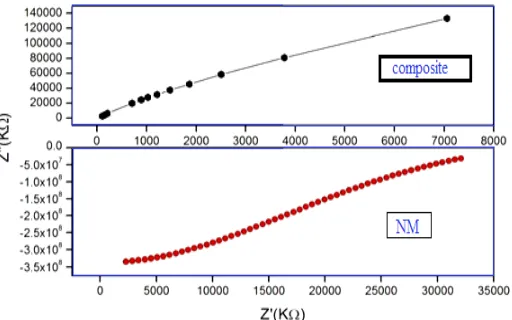
The electrical behavior of composite had been studied over a wide range of frequencies at room temperature using AC technique of complex impedance spectroscopy. The electrical property of a material is exhibited by the appearance of semicircular arcs in Nyquist plots. Figure 5
shows the complex impedance plots (Nyquist plots) of pure nickel molybdate and composite. It is evident that both the samples show single semicircular behavior, which suggests the predominance of grain boundary resistance over the grain resistance in both. The literature mentions that the resistivity of a polycrystalline material increases with decreasing grain size.35
Accordingly, smaller grains imply a larger number of insulating grain boundaries which act as a barrier to the flow of electrons. Smaller grains also imply smaller grain-grain surface contact area and therefore a reduced electron flow. In both samples the contribution of the grain boundary becomes dominant and grain contribution is not seen. This is the reason for which only single semicircular arc appears in Cole-Cole plots of both samples. In terms of impedance plots, each semicircular arc can be modeled by an equivalent circuit consisting of a resistor (R) and a capacitor (C) connected in parallel. The complex impedance of a system can be written as the sum of real and imaginary part, as follows:
(4)
where, Z′ and Z″ are given by the following relations:
𝑍′ =
𝑅g1+( 𝜔g2𝐶g2𝑅g2)
+
𝑅gb
1+(𝜔gb2𝐶gb2𝑅gb2 )
(5)
𝑍
′′=
𝑅g2𝜔g𝐶g1+( 𝜔g2𝐶g2𝑅g2 )
+
𝑅gb2𝜔gb𝐶gb
1+( 𝜔gb2𝐶gb2𝑅gb2 )
(6)
where,
Ra, Rab, Ca, Cab are the resistance and capacitance of the grain and grain boundary, respectively, while
a and ab are the frequencies at the peaks of the semicircles for grain and grain boundary, respectively.
Figure 5. Nyquist plots for different compositions at room temperature (NM-nickel molybdate)
The resistance values are obtained from the circular arc intercepts on Z-axis, while the capacitance values can be derived from the maximum height of the circular arcs. The capacitances and the relaxation time can be calculated for the grain and grain boundary by the expressions as follows:
𝐶
g=
1𝑅g𝜔g
,
𝐶
gb=
1𝑅gb𝜔gb
,
𝜏
g=
1𝜔g
=
𝐶
g𝑅
g,
𝜏
gb=
1ωgb
=
𝐶
gb𝑅
gb (7)where,
Rg, Rgb, Cg, Cgb are the resistance and capacitance of the grain and grain boundary, respectively.
g and gb are the frequencies at the peaks of the semicircles for grain and grain boundary, respectively. g, and gb are the time constants of an RC circuit of the grain and grain boundary, respectively.
The grain and grain boundary parameters like resistance and capacitance are obtained by analyzing the impedance data using nonlinear least square fitting method and are shown in Table 2.
It has been observed that grain boundary resistance 𝑅𝑔𝑏
decreases while the capacitance 𝐶𝑔𝑏 increases with the
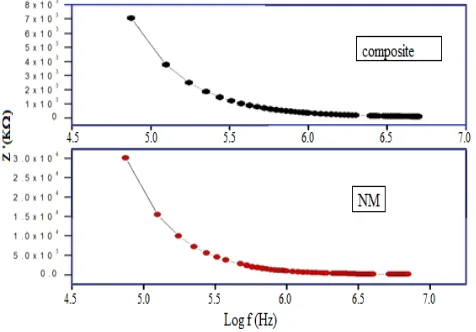
addition of steroidal imidazole in nickel molybdate. The variation in real part of impedance (Z′) as a function of frequencyis shown in Figure 6. It can be observed that Z′ decreases with the increase in frequency for all the composition. This is due to increase in conductivity with frequency resulting from hopping phenomenon.
Figure 6. Variation in real impedance (Z′) as a function of frequency and composition (NM-nickel molybdate)
Figure 7. Variation in imaginary impedance Z″ with frequency for
different compositions (NM-nickel molybdate)
It is seen from Figure 7 that Z′ had strong frequency dependence in the lower frequency and show frequency independent behavior in the higher frequency region. This can be attributed to the fact that low frequency region corresponds to high resistivity due to the effectiveness of resistive grain boundaries in this region. Figure7 shows the variation in reactive part of impedance (Z′) as a function of frequency and composition.
It shows the same behavior as that of Z′. Z″ increases with the addition of steroidal imidazole in composite due to the decrease in 𝐶𝑔𝑏as shown in Table 2. This can be attributed
to the fact that Z″ is inversely proportional to capacitance as shown below:
Z
″ =
1𝑗𝜔𝐶 (8)
Thus, as the steroidal imidazole is added in composite, 𝐶𝑔𝑏decreases leading to the increase in Z″. The j represents
the phase shift or phase angle between voltage and current.
A.C conductivity
The variation in electrical conductivity with frequency for different compositions at room temperature is shown in Figure 8. It is clear from the Figure that the AC conductivity increases with the increase in frequency for both compositions. The total conductivity of the system is given by:
0
( )
T
( , )
T
(9)Here, first term on R.H.S is DC conductivity which is independent of frequency. The second term is pure AC conductivity due to the electron hopping between the metal ions. It has been observed that AC conductivity gradually increases with the increase in frequency of applied AC field because the increase in frequency enhances the electron hopping frequency.
F
Figure 8. Variation in AC conductivity with frequency for different compositions (NM-nickel molybdate)
Dielectric properties
The complex dielectric permittivity of pure nickel molybdate and composite was measured as a function of frequency at room temperature by equation 10.
(3.10)
where
is real part of dielectric constant and describes the stored energy while
” is the imaginary part of the dielectric constant, which describes the dissipated energy.
'' ,
*
The dielectric constant
* is used as a function of frequency for both nickel molybdate and composite is shown in Figure 9. The i (iota) is the imaginary constant that defines the imaginary part of dielectric constant in the equation 10. It is shown that with increase in frequency, the dielectric constant decreases and becomes almost constant at high frequencies for both compositions.Figure 9. Variation in dielectric constant
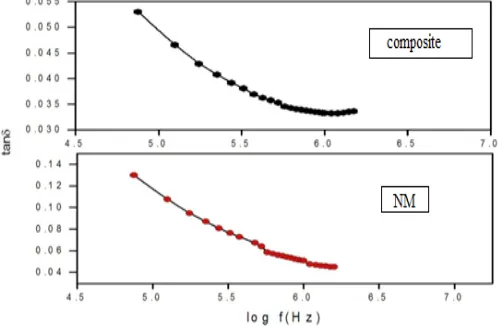
, as a function of frequency and composition (NM-nickel molybdate)This behavior can be explained using Maxwell-Wagner interfacial model. According to this model, a dielectric medium is considered to be composed of double layers, well conducting grains which are separated by poorly conducting or resistive grain boundaries. Under the application of external electric field, the charge carriers can easily migrate the grains but are accumulated at the grain boundaries. This process can produce large polarization and high dielectric constant. The higher value of dielectric constant can also be explained on the basis of interfacial/space charge polarization due to non-homogeneous dielectric structure. Loss tangent or loss factor tan δ represents the energy dissipation in the dielectric system. The Figure 10 shows the variation in dielectric loss factor with frequency at room temperature.
Figure 10. Variation in loss tangent tan δ with frequency for all the compositions (NM-nickel molybdate)
It had been observed that tan δ decreases with the increase in frequency, which may be due to the space charge polarization. One semicircle for composite suggests the dominance of grain boundary resistance. Moreover, the grain boundary resistance Rgb is found to decrease, while capacitance Cgb is observed to increase with addition of steroidal imidazole. The AC conductivity shows the frequency dependent behavior. The data reveals that the dielectric constant and tan δ exhibit the normal dielectric behavior and decreases with the increase in frequency.
Optical properties
In order to describe the photo-absorption behavior of the nickel molybdate and composite, certain amount of samples were uniformly dispersed in ethanol and then UV-visible absorption spectra were recorded. Figure 11 shows the UV-vis absorption spectra of nickel molybdate and composite.
Figure 11. UV-vis absorption spectrum of nickel molybdate and composite (NM-nickel molybdate)
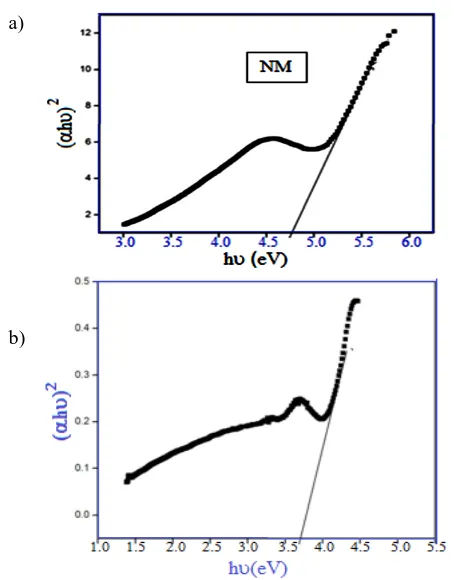
It can be seen that an extremely strong absorption occurs at the wavelength 250 nm and 295 nm for nickel molybdate and composite, respectively, but relatively strong absorption in the visible region (400 nm) for composite can also be seen (Figure 11). This increase in the wavelength in UV-vis absorption spectra of composite may be due to the presence of unsaturation in the functional groups present in the imidazole moiety of the steroidal molecule. The band gap energy calculated by extrapolating the best linear fit (shown in Figure 12a and 12b) was found to be 4.6 eV and 3.1 eV for nickel molybdate and composite, respectively.
a)
b)
Figure 12a. The optical band gap energy of (a) nickel molybdate (NM) (b) Composite
Conclusion
In this work, sample characterization had been done by XRD, FTIR and SEM. Steroidal imidazole based composite membrane of nickel molybdate was quite stable and did not show any dispersion in water and in other electrolyte solutions. From the optical absorption spectra, the band gap of nickel molybdate and composite of nickel molybdate and steroidal imidazole was found to be 4.6 eV and 3.1 eV, respectively. The decrease in the band gap shows that the conductivity of composite had been increased. The electrical behavior of composite had been studied over a wide range of frequencies. One semicircle for sample suggested that there is a dominance of grain boundary resistance in the samples. Moreover, the grain boundary resistance Rgb is
found to decrease, while grain boundary capacitance Cgb is
increase in case of composite as compared to pure nickel molybdate. The AC conductivity shows the frequency dependent behavior. The data reveals that the dielectric constant and tan δ exhibited the normal dielectric behavior and decreases with the increase in frequency.
Acknowledgements
The authors are thankful to the Chairman Department of Chemistry for providing research facilities, All India Institute of Medical Sciences (AIIMS), New Delhi for SEM micrograms and Department of Applied Physics (AMU) for X-ray diffraction and particle size analysis is also acknowledged.
References
1Yusa, S. I., Int.J. Polym. Sci.,2011, 1.
2Backer, J. M., Dawidowicz, E. A., J. Biol. Chem.,1981, 256, 586. 3Backer, J. M., Dawidowicz, E. A., Biochemistry,1981, 20, 3805.
https://doi.org/10.1021/bi00516a021
4Shimshick, E. J., McConnell, H. M., Biochem. Biophys. Res. Commun., 1973, 53, 446. https://doi.org/10.1016/0006-291X(73)90682-7
5Estep, T. N., Mountcastle, D. B., Biltonen, R. L., Thompson, T. E.,
Biochemistry, 1978, 17, 1984.
https://doi.org/10.1021/bi00603a029
6Drummond, C. J., Fong, C., Curr. Opin. Colloid Interface Sci., 1999, 4, 449. https://doi.org/10.1016/S1359-0294(00)00020-0
7Mannock, D. A., McElhaney, R. N., Curr. Opin. Colloid Interface Sci., 2004, 8, 426.
https://doi.org/10.1016/j.cocis.2004.01.009
8Thiemann, T., Vill, V., J. Phys. Chem., 1997, 26, 291.
9Hao, J. Q., Li, H., Zhu, X. X., Chin. J. Org. Chem., 2004, 24,
1129.
10Lakshminaraynaih, N., Siddiqui, F. A., Biophys. J., 1971, 11, 603. 11Kobatake, Y., Kamo, N., Prog. Polym. Sci. Jpn.,1972, 5, 257. 12Wang, F., Hickner, M., Kim, Y. S., Zawodzinski, T. A., McGrath,
J. E., J. Membrane Sci., 2002, 197, 231.
https://doi.org/10.1016/S0376-7388(01)00620-2
13Kreuer, K. D., J. Membrane Sci., 2001, 185, 29. https://doi.org/10.1016/S0376-7388(00)00632-3
14Kaliaguine, S., Mikhailenko, S. D, Wang, K. P., Xing, P.,
Robertson, G., Guiver, M. C., Catal. Today, 2003, 82, 213.
https://doi.org/10.1016/S0920-5861(03)00235-9
15Alberti, G., Casciola, M., Massinelli, L., Bauer, B., J. Membrane Sci., 2001, 185, 73. https://doi.org/10.1016/s0376-7388(00)00635-9
16Ahmad, M. I., Zaidi, S. M. J., Rahman, S. U., Desalination, 2006, 193, 387. https://doi.org/10.1016/j.desal.2005.06.069 17He, R., Li, Q., Jensen, J. O., Bjerrum, N. J., J. Polym Sci. A:
Polym. Chem., 2007, 45, 2989.
https://doi.org/10.1002/pola.22053
18Nabi, S. A., Shallo, A. H., Khan. A. M., Ganie, S., Colloid Surf. A: Physicochem. Aspect., 2007, 302, 241.
https://doi.org/10.1016/j.colsurfa.2007.02.034
19Zhang, H., Pang, J. H., Wang, D., Li, A., Li, X., Jiang, Z., J.
Membrane Sci., 2005, 264, 56.
https://doi.org/10.1016/j.memsci.2005.04.021
20Lakshminarayanah, N., Chem. Rev., 1965, 65, 491. https://doi.org/10.1021/cr60237a001
21Lu, Z. H., Liu, G. J., Duncan, S., J. Membrane Sci., 2003, 221,
113. https://doi.org/10.1016/S0376-7388(03)00251-5 22Chiang, P. C., Whang, W. T., Tsai, M. H., Wu, S. C., Thin Solid
Films, 2004, 447/448 359. https://doi.org/10.1016/S0040-6090(03)01081-2
23Taniguchi, A., Cakmak, M., Polymer, 2004, 45, 6647. https://doi.org/10.1016/j.polymer.2004.06.056
24Neelakandan, C., Pugazhenthi, G., Kumar, A., Eur. Poly. J.,2003, 39, 2383. https://doi.org/10.1016/S0014-3057(03)00183-6 25Pusch, W., Pure Appl. Chem., 1986, 58, 1669.
https://doi.org/10.1351/pac198658121669
26Dar, A. M., Shamsuzzaman, Khan. S., J. Fluoresc., 2016, 26, 639 https://doi.org/10.1007/s10895-015-1750-7
28Silva, V. S., Ruffmann, B., Vetter, S., Mendes, A., Madeira, L.
M., Nunes, S. P., Catal. Today, 2005, 104, 205.
https://doi.org/10.1016/j.cattod.2005.03.051
29Titiloye, J. O., Hussain, I., J. Colloid Interf. Sci., 2008, 318, 50. https://doi.org/10.1016/j.jcis.2007.10.025
30Resina, M., Macanas, J., Gyves, J. D., Munoz, M., J. Membrane Sci., 2007, 289, 150.
https://doi.org/10.1016/j.memsci.2006.11.049
31 Monroy-Guzman, F., Romero, O. C., Velázquez, H. D., J. Nucl.
Radiochem. Sci., 2007, 8, 11.
https://doi.org/10.14494/jnrs2000.8.11
32Bratescu, M. A.,Suda, Y., Sakai, Y., Saito, N., Takai, O., Thin
Solid Films, 2006, 515, 1314.
https://doi.org/10.1016/j.tsf.2006.03.022
33Chalmer, J., Griffths, P., Handbook of Vibrational Spectroscopy,
Wiley, 2001 https://doi.org/10.1002/0470027320
34Saleem, S. S., Aruldhas, G., Polyhedron, 1982, 1, 331. https://doi.org/10.1016/S0277-5387(00)80814-1
35Erb, U., Nanostruct. Mat., 1995, 6, 533. https://doi.org/10.1016/0965-9773(95)00114-X