© 2019 by the Serbian Biological Society How to cite this article: Mirč M, Tomašević-Kolarov N, Stamenković S, Vukov 501 TD. Asymmetry in the common wall lizard Podarcis muralis under different
levels of urbanization: The effect of trait and FA index selection. Arch Biol Sci. 2019;71(3):501-8.
Asymmetry in the common wall lizard
Podarcis muralis
under different levels of
urbanization: the effect of trait and FA index selection
Marko Mirč1,*, Nataša Tomašević Kolarov1, Srđan Stamenković2 and Tanja D. Vukov1
1Department of Evolutionary Biology, Institute for Biological Research “Siniša Stanković“ – National Institute of the Republic
of Serbia, University of Belgrade, Bulevar Despota Stefana 142, 11060 Belgrade, Serbia
2Institute of Zoology, Faculty of Biology, University of Belgrade, Studentski trg 16, 11000 Belgrade, Serbia
*Corresponding author: [email protected]
Received: February 25, 2019; Revised: May 22, 2019; Accepted: May 22, 2019; Published online: May 29, 2019
Abstract: The use of fluctuating asymmetry (FA) as a measure of developmental instability and its relationship to stress and fitness is highly controversial. We examined whether the selection of different FA indices and traits influences the results of FA analysis. We chose four meristic traits and three FA indices (two single-trait and two multiple-trait indices) to assess FA levels in the common wall lizard (Podarcis muralis) from three different habitat types (urban, suburban and natural). Urbanization has already been linked to developmental instability in P. muralis. We therefore expected to detect different FA levels among the habitats. However, we also wanted to see whether we obtained the same patterns using dif-ferent indices and traits. Our results showed that difdif-ferent traits can yield difdif-ferent FA patterns between habitats. The only statistically significant difference between habitats was detected for the FA2 index in femoral pores. The highest level of FA was detected in the urban population, while the lowest level was in the natural population. It is clear that caution must be exerted when deciding on which traits and indices are to be used for FA analysis.
Keywords: developmental instability; stress; fluctuating asymmetry; Lacertidae; meristic traits
INTRODUCTION
One of the biggest challenges in conservation biology is how to identify threatened populations before stress causes irreversible negative effects. The level of devel-opmental instability could be a simple and early indica-tor of populations subjected to stress. Developmental instability is the opposite of developmental stability – a process that buffers the effects of environmental perturbations on the ontogenetic development of an organism and thus maintains it along the trajectory within the same environment [1]. The quantification of the degree of developmental stability is challenging because the lack of within-individual variation caused by perturbation has to be measured. Therefore, devel-opmental instability is used as a surrogate for measur-ing developmental stability [2]. In order to use devel-opmental instability as an efficient early indicator of negative effects of stress on the organism, we assumed that (i) increasing levels of stress are accompanied by increasing levels of developmental instability, and that
(ii) stress-induced changes as a result of developmental instability are first detected in behavioral or external morphology traits rather than in more direct fitness components (e.g. fecundity, survival) [3].
iso-lation [12,13], habitat fragmentation [14], incubation temperature [15], sexual selection [16], and locomotor performance [17,18]. These studies did not yield con-sistent results: some indicated that a stressful environ-ment induces higher levels of FA, while others did not [9,14]. In addition, a literature survey for studies involv-ing lizards as a subject species showed that different methodological approaches were used for the estima-tion of FA levels; some authors compared FA levels be-tween target groups using several morphological traits [9,11,13,15] while others used just one trait [14,19-21]. As the FA indices can be calculated in many different ways [22], a literature survey showed the use of various FA indices in lizards, some were corrected or not for trait size, some were calculated for only one trait and others described multiple traits [11,13,19].
The main goal of this study was to test whether differences in the methodological approach (use of different traits and different FA indices) affect the as-sessment of the stress-induced developmental instabil-ity in the common wall lizard, Podarcis muralis. As a source of stress, we chose urbanization level and tested the FA levels in natural, suburban and urban popula-tions. The common wall lizard is a good model species for such studies as recent research already established a link between urbanization and FA, with higher levels of FA observed in urban habitats [9-11]. This species, like all lacertid lizards, is abundant in suitable habitats [23], including urbanized areas [24], with specimens showing strong site fidelity, small home ranges, and they are usually generalist predators [25,26]. In ad-dition, they have various quantitative traits as meas-urable (metrical) characteristics (e.g. limb and head measurements) and numerous countable (meristic) characters (e.g. different types of head scales, femoral pores) [27], which are appropriate for testing FA.
We hypothesized that: (i) the higher level of ur-banization is accompanied by a higher level of devel-opmental instability, with natural populations having the lowest FA, and urban populations possessing the highest FA; (ii) the patterns of the developmental in-stability resulting from urbanization as a stressor are the same regardless of the morphological trait tested, as it is expected that an individual that is more asym-metrical for one trait is more asymmetric for other traits as well; (iii) the patterns of the developmental instability resulting from urbanization as a stressor
will be the same, regardless of the type of FA index used to assess the levels of stress.
MATERIALS AND METHODS Ethics statement
The collection of P. muralis adults from a natural pop-ulation was approved by the Ministry of Environmen-tal Protection of the Republic of Serbia (Permit No. 021-01-5/11/2017-09).
Study species
The common wall lizard (Podarcis muralis) is a small lacertid species found in Europe, with the largest dis-tribution range among Podarcis lizards [28], and a maximum life span of five years [29]. The common wall lizard is also one of the species that has the wid-est distribution on the Balkan Peninsula. It is even adapted to human-made habitats [30] and therefore could be used as a potential bioindicator. This lacer-tid lizard inhabits sunny, dry and stony habitats, but in the southern part of its distribution it can be also found in shady and humid areas [31]. P. muralis shows a high tolerance toward a broad range of habitats and therefore is considered as not threatened by both na-tional [32] and global standards [33]. However, some recent studies have indicated that urbanization could have a negative effect on the developmental stability of the common wall lizard [9;10].
Study area
natural (no impervious surface). For urban (U) loca-tions we chose three cities (Kikinda [N 45.827238;E 20.458923], Zrenjanin [N 45.383182;E20.376970] and Kovin [N 44.740804; E 20.969798]) that are about 60km apart. Suburban (SU) populations were collected from three villages (Banatsko Veliko Selo [N 45.827848; E 20.589077], Ečka [N 45.324564; E 20.469495] and Banatski Brestovac [N 44.730363; E 20.805078]). Each village is approximately 15km from the city. The natural population (N) was sampled on Mt. Fruška Gora [N 45.161338; E 19.701357], one of the only two remaining natural habitats for the com-mon wall lizard in Vojvodina [35]. The other natural habitat is Vršački Breg, but it was not possible to collect a sample due to the extremely small population density.
Trait quantification
Four morphological traits were selected for this analysis (as they can be easily and rapidly quantified and they show extensive variability in Podarcis populations): supraciliar plates (SP), sublabial plates (SL), subdigital lamellae of fourth hindlimb toe (D4) and femoral pores (FP) [36] (Supplementary Fig. S1). In addition, these traits were chosen according to the literature on stress-induced developmental instability in lizards [9,13].High-resolution photographs were taken using a Nikon D50 camera with a 1.2-million-pixel resolution and equipped with a Nikon 60 mm AF-S Micro lens. The number of plates, pores, and lamellae were counted twice with several days between counts by the same person (MM). Adults and subadults were scored together, as the scala-tion pattern did not show ontogenetic variascala-tion [37].In addition, the size of all specimens was measured (snout-vent length) using a digital caliper.
FA quantification
In order to test if the use of different FA indices will affect the assessment of stress-induced developmental instability, we chose the most often-used FA indices
in lizard literature: (i) FA1 index uncorrected for trait
size: mean|R-L|; (ii) FA2 index corrected for trait size
by the individual: [(|R-L|)/((R+L)/2)]; (iii) FA14
com-posite index: ∑[|FAij|/mean|FAj|]/Nt, where FAij is the deviation from symmetry of trait j in individual i, and mean|FAj| is the average absolute deviation from symmetry of trait j for the entire sample, and Nt is the
number of traits per individual; (iv)FA17 composite
index: ∑|ln(Rj)-ln(Lj)|/T, where Rj and Lj are meas-urements of the R and L sides for trait j, and T is the number of traits per individual [22]. To account for measurement error, we used the average trait values of two separate counts. In summary, for each individual,
we calculated (i) the FA value (FA1, FA2) for each trait
separately, and (ii) the composite FA value (FA14, FA17)
for the combination of all four traits.
Statistical analysis
The correct estimation of FA requires testing whether: (i) the FA variance in the sample is biologically rel-evant or the result of developmental noise; (ii) the FA variance in the sample is significantly larger than the measurement error; (iii) whether directional asymme-try (DA) affects the observed FA patterns; (iv) whether antisymmetry affects the observed FA patterns [22]. As we did not have a measurement error in our sample (two individual counts of meristic traits were identi-cal), we confirmed significant FA (biological relevance) by comparing the hypothetical zero value with abso-lute left side-right side values by trait and group, using the permutation t-test. The absence of DA was con-firmed by comparing the hypothetical zero value with left side-right side values by trait and group with the permutation t-test [38]. The only trait affected by DA was the number of subdigital lamellae of the fourth hind limb toe, but not for all groups (just for suburban and urban), so that the interpretation of the results for this trait should be undertaken with some caution. The presence of antisymmetry was excluded after visual in-spection of the distributions of the left-right side values for every trait for every group separately.
Permutation-based p-values were used in all subsequent analyses, as a preliminary Kolmogorov-Smirnov test showed the absence of normal distribu-tion in all FA values. A preliminary test also showed an absence of correlation of FA values with individual size, so that correction for size was not performed. The effect of sex on FA values was not confirmed and thus sexes were pooled prior to further analyses.
habitat (U, SU, N) as a factor, and as dependent
vari-ables (i) individual FA1values for each trait separately;
(ii) individual FA2 values for each trait separately; (iii)
individual FA14values for the combination of traits; (iv)
individual FA17 values for the combination of traits. All
analyses were performed using Statistica 10 (StatSoft Inc., 2011) and R software v. 3.2.0 (packages lmperm, predictmeans, perm.t.test) (R Core Team, 2015).
RESULTS
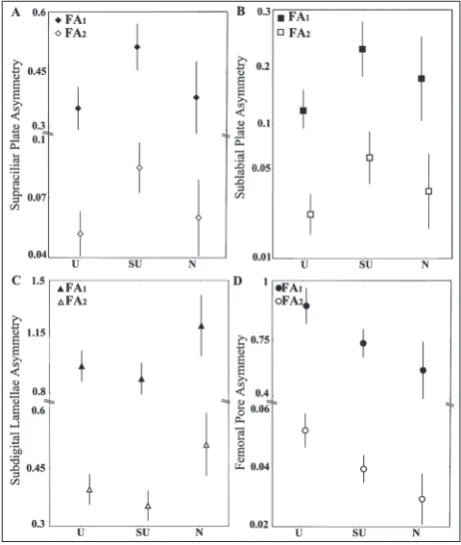
Out of 188 specimens, 93.1% had asymmetry in at least one of four traits, 65.4% had asymmetry in D4, following 58.0% in FP, 38.8% in SP, with a minimum asymmetry presence of 17.5% in SL. Patterns of FA in all four traits are shown in Fig. 1. For the four ana-lyzed traits, the only statistically significant difference between habitats was detected for femoral pores. The highest level of FA was detected in the urban popu-lation, then in the suburban, while the lowest level was observed in the natural population.When com-paring the results obtained with different FA indices, asimilar pattern of FA levels across different habitat
types was observed (Fig. 1). According to FA1, there
was no significant effect of habitat on FA
levels for all traits. The FA2 index showed
a statistically significant difference be-tween habitats for FP (P=0.0246). With regard to FP, post hoc analyses showed a significant difference between natural and suburban (P =0.019) and natural and urban (P =0.015) populations. Finally, the effect of habitat was insignificant for both
composite indices (FA14and FA17).
The patterns of FA differences be-tween habitats revealed by composite indices are shown in Fig. 2, and here we can see that the patterns are similar.
DISCUSSION
Our study provides the first insight into the patterns of FA in common wall lizards in Vojvodina as a result of developmental instability induced by different lev-els of urbanization. Our results showed the existence of FA in the number of supraciliar plates, sublabial
plates, femoral pores and subdigital lamellae of fourth hindlimb toes in the common wall lizard. However, conclusions regarding the differential effects of urban, suburban or natural environments on developmental instability are highly dependent on the trait and the FA index used in the analyses.
We detected FA in populations of all three habitat types, but not all analyzed traits exhibited the same level of FA. For supraciliar plates and sublabial plates, we detected the same pattern of FA levels between Fig. 2. The pattern of FA differences between habitat types revealed by the com-posite index between habitat types (U – urban, SU – suburban, N– natural).
Fig. 1. The pattern of FA differences between habitat types (U – urban, SU – suburban, N– natural) in all four morphometric traits with indices FA1 and FA2. A– Supraciliar plates; B– Subla-bial plates; C –Subdigital lamellae of the fourth hindlimb toe;
habitat types, while somewhat different patterns were observed for subdigital lamellae of fourth hindlimb toes and femoral pores. More importantly, FA levels of supraciliar plates, sublabial plates and subdigital lamellae of fourth hindlimb toes were not statistically different among habitat types. The expected statisti-cally significant increase in FA in urban populations of the common wall lizard compared to suburban and natural ones was confirmed only for the number of
femoral pores, and only for the FA2 index.
In the literature on FA and environmental stress, many authors analyzed the level of FA in a single trait. Almost always that trait was femoral pores [14,16,19,20,21]. Femoral pores, aside from being easy to count, are under strong sexual selection and have an influence on pheromone secretion; thus it is assumed that males with lower femoral pore FA are more likely to be successful in mating [21]. Also, there is a tendency in specimens that exhibit lower FA in femoral pores to also have lower FA levels in other traits [16]. However, in the majority of papers, FA levels were evaluated for several morphological traits [9,11,13,15]. The observed FA pattern for FP was in agreement with previous findings [9]. The authors examined a wide area of the city of Niš, and reported significant differences in the FA of supraciliar plates, subdigital lamellae of fourth hindlimb toes and femo-ral pores between urban and natufemo-ral habitats, where the urban population exhibited higher FA. Lazić et al. [10] corroborated these results with their paper on the FA of pileus shape where they again discovered higher FA in urban than in natural populations.
On the other hand, a discrepancy between the pat-terns of different morphological traits was similar to the results of Sacchi et al. [11]. In their research, the authors incorporated site replication, as well as three different habitat types (natural, suburban and urban). They used four meristic traits: supraciliar plates, femo-ral pores, ventfemo-ral scales and pileus shape, and detected different patterns of FA in different traits. For ventral scales, the highest FA was in the natural population, then in the urban, and it was lowest in the suburban population. The same pattern was observed for femoral pores. A completely different pattern was observed in supraciliar plates: the highest FA was in the suburban, then in the natural and urban populations. Important-ly, a significant difference in FA between habitats was
detected only for femoral pores, while the difference for supraciliar plates and ventral scales was insignifi-cant. The results for pileus shape were similar to those previously reported [10], where the highest FA was detected in the urban habitat and the difference be-tween habitats was statistically significant. Dissimilar patterns of FA in different traits may be due to dif-ferential susceptibility to environmental stress, stress buffering capacity and different ontogenetic patterns and timing of developmental asymmetry [39].
Our study provides insight into the use of FA as a measure of developmental instability from one more angle. It is an addition to the ongoing debate regarding the choice of appropriate traits that can be affected by stress and for detecting developmental instability by FA [40]. Natural and sexual selection can impact morphological traits and can “confound” the effects on FA. Functional traits that strongly influence per-formance (e.g. reproductive success, survival, growth rate) [41] and individual fitness [42], are under the strong influence of selection. Strong nonlinear selec-tion acts against asymmetry in funcselec-tional traits [43] and should be avoided in FA/developmental instability studies. Some studies promote the use of functional traits [44], while others confirm that traits relaxed for functionality selection have higher FA and are there-fore more appropriate to use [41]. A consensus about this issue still cannot be fully established as some analyses have showed that trait type does not have a predictive power in FA studies [45]. With regard to reptiles, contradictory results [11,46] point to the necessity of more elaborated studies, but the use of FA cannot be rejected as the latest long-term studies [47] and meta-analyses [48] have shown that ecological correlates and causes of asymmetry can be detected.
If we focus on results obtained from different FA indices, we can see that not all of them provide
signifi-cant results. According to FA1, femoral pores do not
exhibit a statistically significant difference between
the three habitat types, but according to FA2 they do.
According to composite indices, we detected no sig-nificant results in FA levels between habitat types.
Concerning selection of the FA index, in most pa-pers only one single-trait index was used (see Laia et al. [46] for the review of papers on FA in reptiles).
used [14,20,49], but a several other indices were used in published papers. In some papers composite FA index was used [50].Composite indices may give a more ac-curate picture about FA than single-trait indices because they are evaluated over several axes [51]. Sometimes a composite index can provide opposite results when compared to a single-trait index. In [13], the authors used one single-trait index and one composite index and obtained different results: even though a single-trait index showed a significant difference between popula-tions, the composite FA index did not. To some extent our results are similar to this, as the composite indices showed an insignificant difference in FA between popu-lations, however, one of two single-trait indices detected significant differences in femoral pores.
In general, the selection of a proper FA index is not an easy task as there are thirteen indices describ-ing the level of FA in a sample, and each of them has some pros and cons [52]. A literature survey for liz-ards revealed an absence of consistency in the use of FA indices, as well as insufficient justification for their use. Our study confirms that selection of FA index can affect both the results and the conclusions.
CONCLUSION
Our study showed that trait and FA index selection can affect conclusions about developmental instability induced by environmental stress. More work has to be done to establish an appropriate protocol for the use of FA as an indicator of stress. Work should be focused not just toward understanding whether some environmen-tal feature causes stress and under which conditions this stress can be detected by examining FA levels, but also on which traits and asymmetry indices are used. Not all traits respond in the same manner to environmental stress, and some indices might not be equally sensitive to detect different levels of FA between populations.
Funding: This study was supported by grants from the Ministry of Education, Science and Technological Development of Republic of Serbia (No OI173043 to TV, MM and NTK, III43001 to SS).
Author contributions: MM and TV collected the field data. MM prepared the dataset for the analysis. All authors discussed the results and contributed to the final manuscript.
Conflict of interest disclosure: The authors have no conflicts of interest to declare.
REFERENCES
1. Willmore KE, Hallgrímsson B. Within individual variation: developmental noise versus developmental stability. In: Hall-grímsson, B Hall BK, editors. Variation: A Central Concept in Biology. Burlington, MA, USA: Elsevier; 2005. p. 191-218.
2. Graham, JH, Freeman DC, Emlen JM. Developmental sta-bility: a sensitive indicator of populations under stress. In: Wayne LG., Hughes JS, Lewis MA, editors. Environmental toxicology and risk assessment. ASTM STP 1179. Phila-delphia: American Society for testing and Material;1993.p. 136-58.
3. Lens L, Van Dongen S, Matthysen E. Fluctuating asymmetry as an early warning system in the critically endangered Taita thrush. Conserv Biol. 2002;16(2):479-87.
4. Dongen SV. Fluctuating asymmetry and developmental instability in evolutionary biology: past, present and future. J Evolution Biol. 2006;19(6):1727-43.
5. Thoday JM. Homeostasis in a selection experiment. Hered-ity. 1958;12(4):401.
6. Van Valen L. A study of fluctuating asymmetry. Evolution. 1962;16(2):125-42.
7. Waddington CH. Canalization of development and the inheritance of acquired characters. Nature. 1942;150(3811):563.
8. Klingenberg CP. A developmental perspective on devel-opmental instability: Theory, models and mechanisms. In Polak M, editor, Developmental Instability: Causes and Consequences. 1 ed. Oxford University Press. 2003. p. 14-34. 9. Lazić MM, Kaliontzopoulou A, Carretero MA, Crnobrnja-Isailović J. Lizards from urban areas are more asymmetric: using fluctuating asymmetry to evaluate environmental dis-turbance. PloS One. 2013;8(12):e84190.
10. Lazić MM, Carretero MA, Crnobrnja-Isailović J, Kaliont-zopoulou A. Effects of environmental disturbance on phe-notypic variation: an integrated assessment of canalization, developmental stability, modularity, and allometry in lizard head shape. Am Nat. 2014;185(1):44-58.
11. Sacchi R, Polo MF, Coladonato AJ, Mangiacotti M, Scali S, Zuffi MA. The exposition to urban habitat is not enough to cause developmental instability in the common wall lizards (Podarcismuralis). Ecol Indic. 2018;93:856-63.
12. Ljubisavljević K, Tome S, Džukić G, Kalezić ML. Morpho-logical differentiation of an isolated population of the Ital-ian wall lizard (Podarcissicula) of the southeastern Adriatic coast. Biologia. 2005;60:189-95.
13. Băncilă R, Van Gelder I, Rotteveel E, Loman J, Arntzen JW. Fluctuating asymmetry is a function of population isolation in island lizards. J Zool. 2010;282(4):266-75.
14. Crnobrnja-Isailović J, Aleksić I, Bejaković D. Fluctuating asymmetry in Podarcismuralis populations from Southern Montenegro: detection of environmental stress in insular populations. Amphibia-Reptilia. 2005;26(2):149-58. 15. Braña F, Ji X. Influence of incubation temperature on
morphology, locomotor performance, and early growth of hatchling wall lizards (Podarcismuralis). J Exp Zool. 2000;286(4):422-33.
recogni-tion and sexual selecrecogni-tion between types in the lizard Podar-cishispanica. EvolEcol Res. 2006;8(4):643-58.
17. Vervust B, Lailvaux SP, Grbac I, Van Damme R. Do mor-phological condition indices predict locomotor performance in the lizard Podarcissicula?.ActaOecol. 2008;34(2):244-51. 18. López P, Martín J. Locomotor capacity and dominance in
male lizards Lacerta monticola: a trade-off between survival and reproductive success?.Biol J Linn Soc. 2002;77(2):201-9. 19. Amaral MJ, Carretero MA, Bicho RC, Soares AM, Mann
RM. The use of a lacertid lizard as a model for reptile eco-toxicology studies: Part 1 Field demographics and morphol-ogy. Chemosphere. 2012;87(7):757-64.
20. López P, Amo L, Martín J. Reliable signaling by chemical cues of male traits and health state in male lizards, Lacerta monticola. J Chem Ecol. 2006;32(2):473-88.
21. Martín J, López P. Links between males quality, males chem-ical signals, and female mate choise in Iberian Rock Lizards. Funct Ecol. 2006:20:1087-96.
22. Palmer AR, Strobeck C. CH 17. Fluctuating asymmetry anal-yses revisited. In: Polak M, editor. Developmental Instability: Causes and Consequences, Oxford: Oxford University Press. 2003. p. 279-319.
23. Valverde JA. Estructura de unacomunidadmediterránea de vertebradosterrestres. 1967.
24. Graziani F, Corti C, Dapporto L, Berti R. “ Podarcis” Lizards in anaAgro-Environment in Tuscany (Central Italy): Prelim-inary Data on the Role of Olive Tree Plantations. In: Corti C, Lo Cascio P, Biaggini M, editors. Mainland and Insular Lizards: A Mediterrean Perspective. Florence: Firenze Uni-versity Press; 2006. p. 1000-8.
25. Galán P. Demography and population dynamics of the lac-ertid lizard Podarcisbocagei in north-west Spain. J Zool. 1999;249(2):203-18.
26. Carretero MA. From set menu to a la carte. Linking issues in trophic ecology of Mediterranean lacertids. Ital J Zool. 2004;71(S2):121-33.
27. Soule M. Phenetics of natural populations. II. Asymmetry and evolution in a lizard. Am Nat. 1967;101(918):141-60. 28. Sillero N, Campos J, Bonardi A, Corti C, Creemers R,
Cro-chet PA, Isailović JC, Denoël M, Ficetola GF, Gonçalves J, Kuzmin S. Updated distribution and biogeography of amphibians and reptiles of Europe. Amphibia-Reptilia. 2014;35(1):1-31.
29. Barbault R, Mou YP. Population dynamics of the common wall lizard, Podarcismuralis, in southwestern France. Herpe-tologica. 1988;44(1):38-47.
30. Radovanović M. Vodozemci I gmizavcinašezemlje. Izdavač koPreduzećeNarodneRepublikeSrbije. 1951.
31. Parent GH. Contribution à la connaissance du peuplemen-therpétologique de la Belgique. Le caractererelictueld’âgeA tlantique de l’aire du lézard des murailles, Lacerta muralis-muralis (LAURENTI) au Benelux. Nat Belg. 1978;59:209-22. 32. Tomović L, Kalezć M, Džukić G, editors. Red Book of Fauna
of Serbia II - Reptiles. Belgrade: Faculty of Biology, Univer-sity of Belgrade; 2015.
33. IUCN 2019: The IUCN Red List of Threatened Spe-cies [Internet]. Version 2019-1. International Union for Conservation of Nature and Natural Resources-SSC.c2001
- [cited 2019 May 28]. Available from: http://www.iuc-nredlist.org.
34. McKinney M, Yoon K, Zahedi F. Urbanization, biodiversity, and conservation. Bioscience. 2002;52:883-90.
35. Tomović L, Ajtić R, Ljubisavljević K, Urošević A, Jović D, Krizmanić I, Labus N, Đorđević S, Kalezić ML, Vukov T, Džukić G. Reptiles in Serbia: Distribution and diversity pat-terns. Bull Nat HistMuseum. 2014;7:129-58.
36. Kaliontzopoulou A, Carretero MA, Llorente GA. Morphol-ogy of the Podarcis wall lizards (Squamata: Lacertidae) from the Iberian Peninsula and North Africa: patterns of variation in a putative cryptic species complex. Zool J Linn Soc-Lond. 2011;164(1):173-93.
37. Sarre S, Dearn JM. Morphological Variation and Fluctuating Asymmetry Among Insular Populations of the Sleepy Lizard,
Trachydosaurusrugosus Gray (Squamata, Scincidae). Aust J Zool. 1991;39(1):91-104.
38. Trokovic N, Herczeg G, AbGhani NI, Shikano T, Merilä J. High levels of fluctuating asymmetry in isolated stickleback populations. BMC Evol Biol. 2012;12(1):115.
39. Swaddle JP. Fluctuating asymmetry, animal behavior, and evolution. Adv Stud Behav. 2003;32:169-206.
40. Crespi BJ, Vanderkist BA. Fluctuating asymmetry in vesti-gial and functional traits of a haplodiploid insect. Heredity. 1997;79(6):624.
41. McGill BJ, Enquist BJ, Weiher E, Westoby M. Rebuilding community ecology from functional traits. Trend EcolEvol. 2006;21:178-85.
42. Geber MA, Griffen LR. Inheritance and natural selection on functional traits. Int J Pant Sci. 2003;164:21-42.
43. Tocts AM, Johnson DW, Carter AJ. Strong nonlinear selec-tion against fluctuating asymmetry in wild populaselec-tions of a marine fish. Evolution. 2016;70(12):2899-908.
44. Eggert AK, Sakaluk SK. Fluctuating asymmetry and varia-tion in the size of courtship food gifts in decorated crickets. Am Nat. 1994;144(4):708-16.
45. Leung B, Forbes MR. Fluctuating asymmetry in relation to stress and fitness: effects of trait type as revealed by meta-analysis. Ecoscience. 1996;3(4):400-13.
46. Laia RC, Pinto MP, Menezes VA, Rocha CF. Asymmetry in reptiles: What do we know so far? Springer Sci Rev. 2015;3(1):13-26.
47. Brown GP, Madsen T, Dubey S, Shine R. The causes and ecological correlates of head scale asymmetry and fragmen-tation in a tropical snake. Sci Rep. 2017;7(1):11363. 48. Beasley DAE, Bonisoli-Alquati A, Mousseau TA. The use
of fluctuating asymmetry as a measure of environmentally induced developmental instability: A meta-analysis. Ecol Indic. 2013;30:218-26.
49. Dosselman DJ, Schaalje GB, Sites Jr JW. An analysis of fluctuating asymmetry in a hybrid zone between two chro-mosome races of the Sceloporusgrammicus complex (Squa-mata: Phrynosomatidae) in central Mexico. Herpetologica. 1998;434-47.
51. Polak M, Starmer WT. The quantitative genetics of fluctuat-ing asymmetry. Evolution. 2001;55(3):498-511.
52. Palmer AR. Fluctuating asymmetry analyses: a primer. In: Markow TA, editor. Developmental instability: its origins and evolutionary implications. Dordrecht, Netherlands: Klu-wer; 1994. p. 335-64.
Supplementary Data
Supplementary Fig. S1.