Australian Journal of Basic and Applied Sciences ISSN: 1991-8178, EISSN: 2309-8414
Correspondence Author: Ahmed M. Abo-Elmagd, Department of Civil Eng., Shoubra Faculty of Engineering, Sanitary and Environmental Eng., Benha University.
E-mail:- [email protected] ; [email protected]
Received date: 18 May 2019, Accepted date: 20 September 2019, Online date: 29 September 2019
Copyright: © 2019Ahmed M. Abou Elmagd , This is an open-access article distributed under the terms of the Creative Commons Attribution License, which permits unrestricted use, distribution, and reproduction in any medium, provided the original author and source are credited.
Key words: Sludge digester, Monitoring, Automatic control, Arduino.
INTRODUCTION
The aim of sludge stabilization is to reduce problems associated with the odor of sludge and decomposition, as well as to reduce the risk posed by pathogenic organisms (Veronica Arthurson, 2008). Sludge can be stabilized using lime, aerobic digestion or anaerobic digestion (Goldfarb et al., 1999). Lime stability is achieved by the addition of lime, either hydrated (Ca (oH)2) or fast Lime (CaO) to the sludge, raising the pH to 11 or above. This significantly reduces odor and helps in the destruction
of pathogens. The main disadvantage of the stabilization by lime is that temporary action (J. Jeffrey et al., 1998). Aerobic digestion is an expected stabilization method for the activated sludge system. One disadvantage of this process is that digested sludge is more difficult to get rid of water by dewatering in the next stages (Demirbas et al., 2017).
Biochemistry of anaerobic digestion is a phased process: dissolution of organic compounds by extracellular enzymes followed by the production of organic acids by anaerobic microorganisms known as acid formers. Organic acids are turn into further degradation by methane formers (Jay N. Meegoda et al, 2018). These microorganisms are very sensitive for least change in their environment. the success of anaerobic treatment depends on maintaining the appropriate conditions for methane former because they are strict anaerobic, They are unable to producing methane and decompose of VFA in the presence of oxygen highly (In ’t Zandt et al., 2018) and they are high sensitive to pH, temperature, the presence of toxins or other environmental conditions (Wolfe R.S, 2011).
Most anaerobic digestion is mesophilic. it requires a constant temperature between 32-35 ° C (90-95 ° F) (Gerardi, 2003). The fall of this condition can slow methane production, leading to the accumulation of volatile acids. One important consideration is not to allow any rapid temperature change. In mesophilic digestion, temperature should not be changed more than 2-3 ° C per day
Abstract
(Gerardi, 2003). In fact, some sources have recommended only allowing 0.5 ° C (1 ° F) to be changed daily. It is important that in the case of temperature drop it should not recover very quickly. This can easily lead to an upset digester.
Alkalinity acts as a buffer against pH fluctuations in anaerobic digester. Volatile acid to alkaline ratio (VA / Alk) should be about 0.34 or less. When this ratio exceeds 0.5, the digester becomes unstable (Schnaars and Ken., 2012). VA / Alk Ratio is a much better indicator of digester sick than PH.
Chandra (2009) and Gupta et al. (2013), investigated the biogas production from nonedible seed cakes. They reported that most of the anaerobic bacteria, including methane forming bacteria, perform well within a pH range of 6.8–7.2. A pH range of 6.5–7.5 is generally considered desirable
A decrease in pH is a clear indication of anaerobic digestion problems. Methane-forming bacteria break down fewer volatile acids outside the optimal pH range. This again leads to greater accumulation in disturbed acids.
High pH (7.2-8) can convert NH4 ions to NH3 (ammonia). NH3 is moderately toxic to digestion (above 50 ppm), but this problem generally corrects itself. This is because methane-forming bacteria cannot work well at high pH values and can cause accumulation of volatile acids that reduce pH to optimal levels.
If the pH is too low or too high, it is important to correct it quickly. Lime can be used to raise the pH to 6.4. Excessive feeding of lime can cause accumulation of solids which reduces the size of the digester (Abdallah and Kennedy, 2013).
Once the pH 6.4 is reached, the pH should be restored by bicarbonate salt. Sodium bicarbonate and potassium bicarbonate are t he most commonly used salts. Potassium and sodium become inhibitors at 200-400 ppm and 100-200 ppm respectively (Mignone, 2005).
Alkaline acid can be calculated by dividing the total acid by the total alkalinity in the sample. The total alkalinity is measured by the H2SO4 required to bring the sludge sample from pH 7 to pH 4. The total acid is measured using the amount of NaOH required to bring the sample from pH 4 to 7 again.
Arduino is an open-source platform (M. Banzi, 2009) used for constructing and programming of electronics. It can receive and send information to most devices, and even through the internet to command the specific electronic device. It uses a hardware called Arduino UNO circuit board and software program (Simplified C++ (Minns, 2013) to program the board.
Nowadays Arduino are used a lot in microcontroller (Gibb, 2010) more than other things due to its user friendly, Like any microcontroller, arduino is a circuit board with a chip that can be programmed to perform a large number of tasks be sent fro m a computer program to the Arduino microcontroller and finally to the specific circuit or machine in order to execute the specific command. An Arduino can help you read information from input devices (Margolis, 2011) such as e.g Sensors, Antenna, Trimmer (potentiometer) etc... and can also send information to output devices such as LED (Margolis, 2011), Speakers, LCD Screen, DC motor etc.
PH is a measure of acidity or alkalinity of a solution, the pH scale ranges from 0 to 14. The pH indicates the concentration of hydrogen [H] + ions present in certain solutions. It can accurately be quantified by a sensor that measures the potential difference between two electrodes: a reference electrode (silver / silver chloride) and a glass electrode that is sensitive to hydrogen ion. This is what form the probe. We also have to use an electronic circuit to condition the signal appropriately and we can use this sensor with a micro-controller, such as Arduino.
Methane sensor MQ-4 is a good choice. Because, It is cheap and works well. The sensor itself returns an analog voltage that can be converted using the ADC. or in other method, a mathematical formula can be used to convert analog values to methane concentration in ppm and can be programmed in Arduino coding language, as it was used in this study.
MATERIAL AND METHODS
1.1Bench scale model
The sludge digester model consisted of a 5-liter jacketed glass reactor sealed with rubber stopper. The top cover was prepared by small mixer of 35 rpm. Inlet and outlet opening with valves were used to feed and discharge of the reactor.
Fig.1a: Schematic diagram of bench-scale sludge digester model.
Fig.1b: Photograph of Bench-scale sludge digester model.
1.2 Pilot scale Model
Sludge digester reactor:The pilot scale reactor consisted of 128liter glass Reactor. The reactor dimension was 0.4*0.4*1m (w*L*h) as shown in fig (2a&2b&2c) with 0.4*0.4 m top glass cover sealed with rubber to prevent gas escaping. top cover was prepared by 5 openings, a sludge feed opening with inlet pipe extended under water surface level to allow sludge feeding without gas escaping, an opening for the motor and the mixer, an opening for sensors and heaters electrical cables, an opening for gas outlet, in addition to an opening for feeding of PH control solutions.
The Mixing: a 35rpm mechanical motor with mixer was used to achieve proper mixing that can help avoid high or low temperature local pockets, or accumulation of nutrients and toxins. This enables balanced function during digestion. Due to some problem in controlling motor and mixer, later on, recirculation pump was added to pump sludge from bottom of the reactor to top.
Fig.2c: Schematic diagram of pilot scale model digester
Gas measuring system: The biogas production was calculated by measuring the volume of the displaced water due to the pressure of biogas, for this purpose two, 5 liters, glass jars was used.
Sludge feeding: A 125 liter PVC tank was used for daily sludge feeding. The tank was elevated on a table, at a level higher than the top of the reactor. The mixed sludge was added to the reactor daily by a peristaltic pump connected to the Arduino control system (pump no. 2). The dose was adjusted by determining the opening time of the pump in the Arduino code.
PH control Solutions: Two plastic jars of 8 liters volume with pumps (pump no.1 and pump no. 3) were used to feed lime and soda ash to control PH. The two pumps of course connected to Arduino control system. The dose was adjusted by determining the opening time of the pump in the Arduino code.
The reactor body was provided by an outlet and sample opening at level 80 cm from the bottom. Also, there is a discharge opening near the bottom of the reactor.
Water Heaters: Two water heaters with thermostat were immersed in the fluid inside the reactor to maintain temperature at 35 c.
Fig.3a: Photograph for Arduino Uno board and sensors.
Fig.3b: Schematic diagram for Arduino board, sensors, relay and pumps, was drawn by using Tinkercad.
PH sensor (converting PH sensor voltage to PH value):Analog pH sensor SKU: SEN0161 was used in this study. PH sensor is connected first to the WeMos analog pin, then to the Arduino board as shown in Fig. (5b).PH is a measure of acidity or alkalinity, on a scale ranged from 0 to 14. The pH indicates the concentration of hydrogen [H] + ions by a sensor that measures the potential difference between two electrodes.The relation between PH sensor voltage and PH values is linear. So by taking two points we can deduce the equation to convert the measured voltage to PH. Equation (1) and chart in fig.(4b) were used for this purpose. Fig. (4a) show the Arduino code written to convert PH sensor voltage to PH value.
y = -5.70 x + 21.34. (1)
Fig.4a: Arduino code written to convert PH sensor voltage to PH value.
Fig.4b: chart used for converting PH voltage (on X axis) to PH value on (Y axis) (PH sensor data sheet).
Methane sensor (convert Methane sensor volt to methane concentration in ppm)
The MQ-4 methane sensor returns a voltage or resistance value that can be converted to Methane concentration in ppm using the chart fig.(5a), the Arduino code fig.(5b) and equation (2). As shown this sensor is suitable for detecting LPG, i-butane, propane, methane, alcohol, hydrogen, and smoke.
Rs/Ro = -0.357 X + 2.477 (2)
Where: X: is the methane concentration in PPM., Rs: sensor resistance at various concentrations of gases calculated depends on sensor volt. Ro: sensor resistance at 1000ppm of CH4 in the clean air, calculated from Rs divided by constant value for sensor.
Fig.5b: Code written to convert Methane sensor voltage to Methane concentration in ppm.
1.3 The Experimental Set-Up
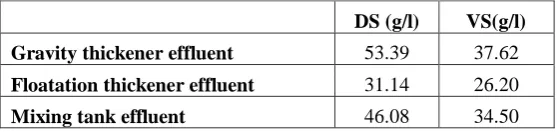
Mixed sludge was collected from Kherbet Elsamra wastewater Treatment plant, Zarqa, Jordan. Primary sludge was collected from primary settling tank, then thickened in a gravity thickener of effluent dry solids (DS) 53.39 g/l and effluent volatile solids (VS) 37.62 g/l. Excess sludge from final settling tank , after aeration tank, was thickened in a floatation thickener and the effluent was 31.14 g/l DS and 26.20 g/l VS. The tow thickeners effluents were mixed together in a sludge mixing tank, in the WWTP, of effluent 46.10 g/l DS and 34.50 VS, the sludge used in this study was collected from that mixing tank. Table (1) shows sludge composition taken from Kherbet Elsamra WWTP.
Table 1: Sludge composition taken from WWTP.
DS (g/l) VS(g/l)
Gravity thickener effluent 53.39 37.62
Floatation thickener effluent 31.14 26.20
Mixing tank effluent 46.08 34.50
The reactor outlet opening arranged at 0.8 m from the bottom, so the reactor Effective volume was 128 liter. Reactor was fed by 1.8 liter of mixed sludge three times daily. Feeding pump was automatically controlled by the Arduino system. Temperature was maintained at 35 oC by two water heaters with thermostats. To maintain OLR about 1.5 kg VS m-3 day-1, the hydraulic retention time HRT was designed as 23 days according to influent VS concentration from mixing tank.
1.4 Methodology
The use of sludge digester in sludge treatment and biogas production has become very common during the design of new sewage treatment plants. However, over time, many sludge digesters are disrupted because of technical reasons related to controlling biological processes. Biological processes in general and specially Methane Forming Bacteria are very sensitive to the pH that should be between 6.8 and 7.2, which is a very narrow range (Chandra, 2009 and Gupta et al., 2013)
This study and the model have been done to facilitate monitoring and control over the operating conditions, especially the pH, in addition to the possibility of treating the cause of the problem and recovery the appropriate operating conditions without any manual control.
PH sensors, methane sensors, and temperature sensors monitor digester performance and collect data then send it continuously to a PC monitor and to the Arduino, which was connected to three pumps to control the digester. A pump number 1 function was to add lime, pump no 2 was to control sludge feeding and pump number 3 was to add soda ash.
To program Arduino code, it was necessary to know the causes of digester disruption and how to treat it. For this purpose, a bench scale model was prepared, and two runs were performed.
Bench scale model: The digester was operated for 40 days without measurements until the digester performance rates became stable, at an OLR of 1.42 kg VS/m3/d, this corresponds to the load that occur in the WWTP that ranged between 1.4 and 1.8 kg VS/m3/d. The reactor feeding rate was 0.25 L/d divided into 3 doses with a 8-h interval, so the hydraulic retention time was 20 days. All times the temperature was maintained at 35 oC.
Run2: During the first 24 hr, gas production, VFA and ALK were measured. Then the OLR was increased by 4 times during the
next 24 hr, in a stepwise fashion, to allow the PH to drop out of the allowable operating range to be about 6. To treat this situation, the digester feeding was suspended for 48 hours. At the first 24 hours, 3 doses 27.1 ml of 5% lime solution were added. At the next 16 hours, a dose of 13.55 ml of the same lime solution in addition to 10.2 ml of 5% Soda Ash solution was added twice with interval 8 hr. Table (2) shows the operating parameters during run1 and run2.
To increase the OLR without decreasing the hydraulic retention time (HRT), a 20% dewatered sludge (without coagulant obtained from WWTP) was add to the feed doses.
Table 2: the operating parameters during run1 and run2.
Run
1
Time (hr) (no of doses)
0, 8, 16 (3)
24, 32, 40 (2)
48, 56, 64 (3)
72, 80 (2)
88, 96, 104 (3)
Influent S.S % 3.80% 5.70% - 3.80% 3.80%
OLR (Kg VS/m3/d) 1.425 2.1375 -,- ,1.425(1) 1.425 1.425
Run
2
Influent S.S % 3.80% 15.20% - - 3.80%
OLR (Kg VS/m3/d) 1.4250 5.7000 - - 1.425
Lime ml (5% con.) - - 27.1 13.55 -
Soda ash ml (5% con.) - - - 10.2 -
Pilot Scale Model:In this stage, the Arduino code was programmed according to the results obtained from Bench scale model. Then OLR was increased until became overloaded to check how the automatic control could cure the reactor operating conditions. A 128 L digester was operated for 40 days without measurements until the digester performance rates were stable, at an OLR of 1.5 kg VS/m3/d and the temperature was maintained at 35 ° C. the digester feeding rate was 5.56 L/d divided into 3 doses separated by 8 hours, so the hydraulic retention time was 23 days. in the day 41, day zero, gas production, VFA and ALK were measured every 8 hours. The digester was then subjected to 3 pulse loads spaced by 4 hours. Each pulse was of 0.47 L of 20% dewatered sludge and 1.38L of 4.6% thickened sludge, which achieve approximately 9 kg VS m-3. Dewatered sludge was taken from dewatering stage by centrifugation in WWTP (without coagulant).
All pumps have been turned off during the chock loading period to allow the pH to drop below 6 and were then re-operated and automatic control by Arduino was allowed. The Arduino stopped the feeding by closing pump no 2, for 40 hours. Also, opened pump no. 1, to add 3 doses 700 ml of 5% lime solution during the first 24 hours. At the next 16 hours, the Arduino opened pump no1and pump no2 to add 2 doses 350 ml of the same lime solution in addition to 250 ml of 5% Soda Ash solution in each dose. Table (3) shows the operating parameters.
Table 3: the operating parameters in pilot scale model.
Time (hr) (no of doses)
0,8,16 (3) 24,32,40 (3) 48,56,64 (3) 72,80 (2) 88,96,104 (3)
Influent S.S % 4.60% 27.60% - - 4.60%
OLR (Kg VS/m3/d) 1.500 9.00 - - 1.5000
Pumps control Off Off On On On
Lime (ml) (5% con.) - - 700 350 -
Soda ash (ml) (5% con.) - - - 250 -
RESULTS AND DISCUSSION
2.1 Bench scale results
In purpose to program the Automatic controlling code by Arduino, run 1 and 2 were conducted on the Bench scale model to understand the digester behavior when exposed to organic shock loads and then to understand its response during the treatment procedures.
Fig. 6a: change in OLR (kg VS/m3/d) and PH with time (hr) in (bench scale model, Run1).
VFA also risen to 5 times its first value with the increase of OLR, this is due to the accumulation of VFA and the inability of methane-forming bacteria to consume it. Accumulation of VFA leads to decrease PH, which leads to the inhabitation of methane-forming bacteria. Stopping the digester nutrition gives the bacteria a chance to convert volatile fatty acids into biogas. Alkalinity also decreased slightly with the increasing of OLR. Fig.(6-b) show the change in VFA in (mg of acetic acid/L) and Alkalinity in (mg/l as Caco3) with time (Chen at al. 2015).
Fig.6b: change in VFA in (mg of acetic acid/L) and Alkalinity in (mg/l as Caco3) with time (hr) in (bench scale model, Run1).
Fig.6c: change in gas production rate in (L/8hr) and VFA/Alkalinity ratio with time (hr) in (bench scale model, Run1).
Run2 Results: OLR was increased from 1.42 to 5.7 kg VS / m3 / d in order to reduce pH less than 6. With the increase of OLR, the pH decreased to 5.9. Therefore, feeding was stopped and three consecutive doses of lime (27 ml conc. 5%) separated by 8 hours were added. The pH began to rise but stopped at around 6.4 and so, the addition of lime again will cause accumulation inside the digester without effect. As a result, two doses of soda ash (10.2 ml conc.5%) were added in addition to half the dose of lime as the feed continued to be closed. This causes the pH to rise to 6.9. Figure (7a) show the change OLR in kg VS/m3/d and PH with time.
Fig.7a: change in OLR (kg vs/m3/d) and PH with time (hr) in (bench scale model, Run2).
Fig.7b: change in VFA in (mg of acetic acid/L) and Alkalinity in (mg/l as Caco3) with time (hr) in (bench scale model, Run2).
With the increase of OLR, VFA/Alk increased this give the same effect of the PH but still give a earlier indication. So increasing VFA/Alk inhibit methane-forming bacteria, therefore gas production rate decreased. At the first 8 hrs, after increased OLR (hr no. 24), the VFA/Alk was 0.32 so gas production still not affected, but at the next 8 hrs VFA/Alk was 0.9 and the gas production decreased dramatically. Figure (7c) show the change in gas production rate in (L/8hr)) and VFA/Alkalinity ratio with time.
Fig.7c: change in gas production rate in (L/8hr) and VFA/Alk ratio with time (hr) in (bench scale model, Run2).
(a) (b)
Fig.8a: the Arduino code that used to control the operational conditions fig.8b: code algorithm implemented on Arduino.
Pilot Scale Results: For 40 days –startup period - the temp., pH, methane concentration, gas production rates, VFA, and alkalinity were monitored until measured parameter became stable. Then the dry solids (DS) and volatile solids (VS) in g/L were measured in the influent and in the effluent flow. Moreover, the removal percentage was calculated. Fig.(9a&9b) shows the results.
Fig.9a: DS removal efficiency Fig.9b: VS removal efficiency
In order to test the automatically control by the Arduino and its programming code, and to study its effectiveness in recovery of digester without human intervention, a pilot scale model was built. An overload OLR was then applied. The recovery method by automatically control was monitored, recorded and analyzed.
OLR was increased from 1.5 to 9 kg VS / m3 / d in order to reduce pH less than 6, during that pumps control was closed, then opened in order to apply the Arduino control. With the increase of OLR, the pH decreased to 5.9 Therefore, feeding was stopped and four consecutive doses of lime (0.6 L conc. 5%) added when pump 1 was opened by Aduino until the pH began to rise to 6.4. Then, three doses of soda ash (0.2L conc.5%) added by pump 3 when opened automatically by Aduino in addition to the (0.3L conc.5%) of lime as the feed pump continued to be closed. This causes the pH to rise to 6.9 Figure (10a) show the change OLR in kg VS/m3/d and PH with time.
Fig.10a: change in OLR (kg VS/m3/d) and PH with time (hr) in (pilot scale model).
Fig.10b: change in VFA in (mg of acetic acid/L) and Alkalinity in (mg/l as Caco3) with time (hr) in (pilot scale model).
Fig.10c: change in gas production rate in (L/hr) and VFA/Alk ratio with time (hr) in (pilot scale model).
Fig.10d: change in Methane concentration (%) and VFA/Alk. ratio with time (hr) in (pilot scale model).
CONCLUSION
The main cause of disruption of sludge digesters and its exit out of the work is their high sensitivity to environmental conditions, especially the pH, which should be ranged between 6.8 and 7.2, meaning that, the allowable range of change is onl y 0.4. So, PH is the cornerstone of the biological processes in the digester and it is strongly influenced by the OLR and VFA/Alk ratio.
Relying on technology such as programming electric circuits in controlling sludge digester is highly effective. Unlike manual control which often disrupts the digester due to slow response. The actual change in pH begins when the VFA/Alk ratio reaches 0.8, which affects gas production rate and methane percentage. Methane concentration is so important because it expresses the amount of heat energy that can be obtained when the gas is burnt.
The pH can be recovered by stopping the digester feeding only if the PH is between 6.5 and 6.8. As soon as the pH drops to 6 or less the PH can be raised, using lime only, to 6.4 and more lime is not preferred because it will be accumulated without effect. Other antacids such as soda ash, together with lime, are needed to raise the pH above 6.4. The characteristics of the sludge are not the same, so similar laboratory studies should be carried out before Arduino programming is done for new treatment plants. .
REFERENCES
A.M. Gibb, (2010). “New media art, design, and the Arduino microcontroller: A malleable tool”. PhD thesis, Pratt Institute. Abdallah M., and Kennedy K., (2013). “Advanced Monitoring and Control of Anaerobic Digestion in Bioreactor Landfills”.
Biodegradation - Engineering and Technology.doi:10.5772/55715.
Anaerobic Digestion”. Int J Environ Res Public Health. Oct; 15(10): 2224. M. Banzi, (2009). "Getting Started with arduino". O'Reilly Media, Inc. M. Margolis, (2011). “Arduino cookbook”. " O'Reilly Media, Inc.".
Mignone Nicholas., (2005). “A Biological Inhibition/Toxicity Control In Municipal Anaerobic Digestion Facilities”.Article. Mohammed Ali Musa, Syazwani Idrus , Che Man Hasfalina and Nik Norsyahariati Nik Daud. (2018) ”Effect of Organic Loading
Rate on Anaerobic Digestion Performance of Mesophilic (UASB) Reactor Using Cattle Slaughterhouse Wastewater as Substrate”, Int. J. Environ. Res. Public Health, 15, 2220.
Peter D. Minns, (2013). "C Programming For the PC the MAC and the Arduino Microcontroller System". Author House. Schnaars, Ken., (2012). “What Every Operator Should Know about Anaerobic Digesters”. Nashville: Operator Essentials.
Shujun Chen, Jishi Zhang and Xikui Wang., ( 2015). “Effects of alkalinity sources on the stability of anaerobic digestion from food waste”, Waste Management & Research, UNIV ARIZONA LIBRARY on October 9.
Taddese Girmay Teklehaimanot, Weldegebriel Berhie Abrha, Berhe Tadesse Abay, ( 2017).”Comparison of Sodium carbonate, Lime and Ash effects on Biogas Production”; International Journal of Engineering Development and Research ( IJEDR); Volume 5, Issue 4. , ISSN: 2321-9939.
Veronica Arthurson.,(2008). “Proper Sanitization of Sewage Sludge: a Critical Issue for a Sustainable Society”. Appl Environ Microbiol.; 74(17): 5267–5275.