DOI:10.1051/0004-6361/201323114 c
ESO 2015
Astrophysics
&
Complex organic molecules in organic-poor massive
young stellar objects
Edith C. Fayolle
1,2, Karin I. Öberg
2, Robin T. Garrod
3, Ewine F. van Dishoeck
1, and Suzanne E. Bisschop
4,51 Leiden Observatory, Leiden University, PO Box 9513, 2300 RA Leiden, The Netherlands e-mail:[email protected]
2 Harvard-Smithsonian Center for Astrophysics, 60 Garden Street, Cambridge, MA 02138, USA 3 Center for Radiophysics and Space Research, Cornell University, Ithaca, NY 14853-6801, USA
4 The Centre for Star and Planet Formation, Natural History Museum of Denmark, University of Copenhagen, Øster Voldgade 5–7, 1350 Copenhagen K., Denmark
5 The Centre for Star and Planet Formation, Niels Bohr Institute, Juliane Mariesvej 30, 2100 Copenhagen Ø., Denmark
Received 22 November 2013/Accepted 22 October 2014
ABSTRACT
Context.Massive young stellar objects (MYSOs) with hot cores are classic sources of complex organic molecules. The origins of these molecules in such sources, as well as the small- and large-scale differentiation between nitrogen- and oxygen-bearing complex species, are poorly understood.
Aims.We aim to use complex molecule abundances toward a chemically less explored class of MYSOs with weak hot organic emission lines to constrain the impact of hot molecular cores and initial ice conditions on the chemical composition toward MYSOs. Methods.We use the IRAM 30 m and the Submillimeter Array to search for complex organic molecules over 8−16 GHz in the 1 mm atmospheric window toward three MYSOs with known ice abundances, but without luminous molecular hot cores.
Results.Complex molecules are detected toward all three sources at comparable abundances with respect to CH3OH to classical hot core sources. The relative importance of CH3CHO, CH3CCH, CH3OCH3, CH3CN, and HNCO differ between the organic-poor MYSOs and hot cores, however. Furthermore, the N-bearing molecules are generally concentrated toward the source centers, while most O- and C-bearing molecules are present both in the center and in the colder envelope. Gas-phase HNCO/CH3OH ratios are tentatively correlated with the ratios of NH3 ice over CH3OH ice in the same lines of sight, which is consistent with new gas-grain model predictions.
Conclusions.Hot cores are not required to form complex organic molecules, and source temperature and initial ice composition both seem to affect complex organic distributions toward MYSOs. To quantify the relative impact of temperature and initial conditions requires, however, a larger spatially resolved survey of MYSOs with ice detections.
Key words.ISM: abundances – ISM: molecules – astrochemistry
1. Introduction
Organic molecules containing more than six atoms, the so-called complex organics (Herbst & van Dishoeck 2009), are commonly found in the warm and dense gas (T >100 K,n > 106 cm−3) around young stellar objects (YSOs), so-called molecular hot cores (e.g.,Blake et al. 1987;Cazaux et al. 2003;Fuente et al. 2005). Abundances and abundance ratios of complex organ-ics are found to vary substantially between (Helmich & van Dishoeck 1997) and within YSOs (e.g.,Wyrowski et al. 1999). This suggests that formation and destruction routes are highly environment specific and that there is a sensitive dependence of the complex organic chemistry on chemical and physical initial conditions. In addition, different filling factors of the warm gas should play a role if there the complex organic products of cold and hot chemistry differ there.
The potential environmental dependencies and chemical memories lead to complex organics having a great potential as probes of the current and past physical and chemical conditions where they are found (Nomura & Millar 2004). Their potential utility is further increased by the fact that most complex organic molecules present large numbers of lines, spanning most excita-tion condiexcita-tions found in space. Complex molecules are also of
high interest for origins of life theories since they are the pre-cursors of even more complex prebiotic material (Ehrenfreund & Charnley 2000). Using molecules as probes of physical con-ditions and advancements in prebiotic evolution from organics both rely on a detailed understanding of complex organic chem-istry. The formation and destruction mechanisms and rates of most complex organics are, however, poorly constrained.
The formation of organic molecules around massive YSOs (MYSOs) was first thought to proceed through gas phase re-actions in dense hot cores, following evaporation of ice grain mantles (e.g.,Charnley et al. 1992). Recent laboratory experi-ments and modeling efforts point now toward a more compli-cated sequential scenario that relies to a greater extent on sur-face formation routes on submicron-sized dust particles.Herbst & van Dishoeck(2009) classify complex organic molecules in terms of generations according to the following scenario. In in-terstellar clouds and in the deeply embedded early phases of star formation, atoms and molecules accrete or form on the surface of dust grains, building up an icy mantle of simple species like H2O, CH4, and NH3(Tielens & Hagen 1982). This icy mantle is
processed at low temperature by atoms, which can diffuse even at the low temperatures in cloud cores, creating the zeroth gen-eration of organic molecules. A good example of these species
is CH3OH, which is efficiently formed at low temperature by the
hydrogenation of CO ice (Watanabe & Kouchi 2002;Watanabe et al. 2003,2004;Fuchs et al. 2009;Cuppen et al. 2009). First-generation complex organics form when heating the cold enve-lope up by the increasing luminosity of a central YSO and is due to a combination of photoprocessing of the ice resulting in radical production and a warming up (20 to 100 K) of the grains, thereby enhancing the mobility of radicals and molecules (Garrod et al. 2008; Öberg et al. 2010). When the icy grains move inward and reach a region warmer than 100 K, the icy mantle evaporates, bringing the zeroth- and first-generation or-ganics into the gas phase, where additional chemical reactions give rise to the formation of the second-generation complex or-ganics (e.g.,Charnley et al. 1992;Doty et al. 2002; Viti et al. 2004).
In the proposed scenario of complex molecule formation, the initial ice mantle plays a critical role. The exact composition of this ice may therefore have a strong effect both on the product composition of formed organics and on their overall formation efficiency.Garrod et al.(2008) andÖberg et al.(2009) find, for example, that CH3OH ice is a key starting point for most
com-plex organic formation.Rodgers & Charnley(2001) used a hot core chemistry model to show that the relative amount of NH3
in the ice has a large impact on the CH3CN/CH3OH
protostel-lar abundance ratio. Observationally testing these relationships would provide key constraints on the formation pathways of complex organic molecules.
Isolated MYSOs with warm inner envelopes are good lab-oratories for testing this hypothesis as these sources are bright enough to observe a wide variety of organics and some of them present ice features from the cold outer protostellar envelope (Gibb et al. 2004). Sources presenting both complex gas and ice features are, however, rare as the sources need to be evolved to possibly display a bright hot core chemistry accessible to current observational facilities and young enough such that the ice ma-terial has not been completely consumed by accretion, warm up, and envelope dispersal. In the massive YSO sample studied by Bisschop et al.(2007), only three hot cores present ice spectra (see Table1). Such a small number prevents any analysis of the correlation between ice and gas content and justifies our search for other objects that display both ice features and gas phase organics.
To extend the sample of sources with both complex organics and ice observations, we look for gas phase organics species around non-hot core MYSOs (absence or low-level of hot CH3OH emission) that also have ice observations available from
the literature. These sources are called from now on organic-poor MYSOs (poor in lines of organic molecules). Complex molecule observations in such objects may additionally shed light on the conditions under which different kinds of complex molecules can form, i.e. which molecules require the presence of a hot core to be abundant.
Massive objects NGC 7538 IRS9, W3 IRS5 , and AFGL490 have been observed in the mid-infrared by the Infrared Space Observatory (ISO) and analyzed systematically for ice abundances by Gibb et al. (2004) and references therein. NGC 7538 IRS9 is a 6 ×10⁴ L
luminous object located in Perseus. It is close to hot core source NGC 7538 IRS1 and displays at least three bipolar outflows, evidence for accretion (Sandell et al. 2005), and a hot component close to the central object. W3 IRS5 is associated with five YSOs, two of which are massive (van der Tak et al. 2005; Megeath et al. 2005; Rodón et al. 2008; Chavarría et al. 2010). It has a luminosity of 17×104 L
and presents strong S-bearing molecular lines
(Helmich et al. 1994). AFGL490 is a very young medium-mass YSO of 4.6×10³ L
, in transition to a Herbig Be star, which drives a high-velocity outflow (Mitchell et al. 1995) and shows evidence of a rotating disk (Schreyer et al. 2006). Since these sources are considered to potentally be at an earlier evolution-ary stage than typical hot-core sources, it is difficult to predict the chemical complexity and the spatial emission of the organics that could be observed in these sources.
In this study we use a combination of single-dish IRAM 30 m data and spatially resolved observations from the Submillimeter Array1 (SMA) to search for organic molecules around these three MYSOs and report on their complex organic abundances in the cool protostellar envelope and in a warmer re-gion closer to the star. A subset of these data was used in the Öberg et al. (2013) to study the detailed radial distribution of molecules in NGC 7538 IRS9, while the present study focuses on the overall detection rate of organics in these organic-poor sources, and on how they compare with ice abundances and tra-ditional hot core chemistry. The paper is organized as follows. The observations are described in Sect. 2, and the results of the line analysis are shown in Sects.3.1−3.3. The chemistry in our sample is compared to the chemistry in traditional hot-core sources in Sect.3.4. Section3.5presents correlation studies be-tween ice and gas column densities and abundances, testing the impact of initial ice compositions on the complex chemistry. A discussion of the use of these line-poor sources to underpin the origins of complex chemistry is presented in Sect.4, which is followed by the conclusions of this study.
2. Observations and analysis
2.1. Observations
The MYSOs NGC 7538 IRS9, W3 IRS5 , and AFGL490 lo-cated in Perseus NGC 7538 at 2.7 kpc, in Perseus W3 at 2.0 kpc, and in Camelopardalis OB1 at 1.4 kpc respectively (see Table 1) were observed with the IRAM 30 m and the SMA. The three sources were observed with the IRAM 30 m tele-scope on February 19−20, 2012 using the EMIR 230 GHz re-ceiver and the new FTS backend. At these frequencies the IRAM 30 m beam is∼1000. The two sidebands cover 223−231 GHz and 239−247 GHz at a spectral resolution of∼0.2 km s−1and with a sideband rejection of−15 dB (Carter et al. 2012). We checked the pointing every one to two hours and found to be accurate within 200to 300.
Focus was checked every four hours and generally remained stable through most of the observations; i.e., corrections in the range of 0.2–0.4 were common, but a correction of 0.7 was re-quired once. We acre-quired spectra in both position-switching and wobbler-switching modes. The resulting spectra had similar rel-ative line intensities, indicrel-ative of no emission in the wobbler-off position. The wobbler-switching mode was considerably more stable, and we used these data alone for the quantitative anal-ysis. The weather during the observations was excellent and
the τ225 GHz varied between 0.05 and 0.15. We converted the
raw IRAM spectra to main beam temperatures and fluxes using forward and beam efficiencies and antenna temperature to flux
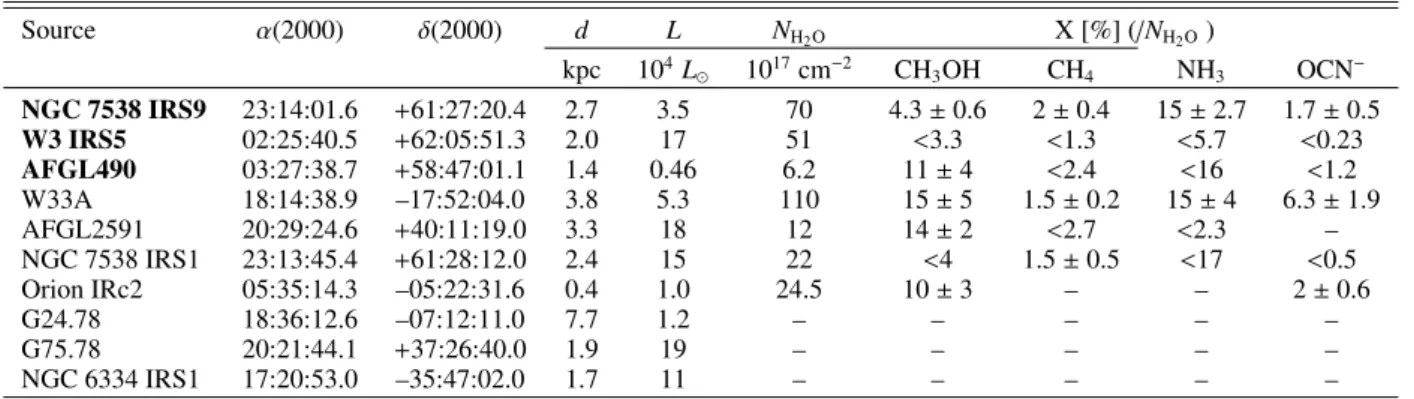
Table 1.Source characteristics and ice abundances.
Source α(2000) δ(2000) d L NH2O X [%] (/NH2O)
kpc 104L
1017cm−2 CH3OH CH4 NH3 OCN− NGC 7538 IRS9 23:14:01.6 +61:27:20.4 2.7 3.5 70 4.3±0.6 2±0.4 15±2.7 1.7±0.5
W3 IRS5 02:25:40.5 +62:05:51.3 2.0 17 51 <3.3 <1.3 <5.7 <0.23
AFGL490 03:27:38.7 +58:47:01.1 1.4 0.46 6.2 11±4 <2.4 <16 <1.2 W33A 18:14:38.9 –17:52:04.0 3.8 5.3 110 15±5 1.5±0.2 15±4 6.3±1.9 AFGL2591 20:29:24.6 +40:11:19.0 3.3 18 12 14±2 <2.7 <2.3 – NGC 7538 IRS1 23:13:45.4 +61:28:12.0 2.4 15 22 <4 1.5±0.5 <17 <0.5
Orion IRc2 05:35:14.3 –05:22:31.6 0.4 1.0 24.5 10±3 – – 2±0.6
G24.78 18:36:12.6 –07:12:11.0 7.7 1.2 – – – – –
G75.78 20:21:44.1 +37:26:40.0 1.9 19 – – – – –
NGC 6334 IRS1 17:20:53.0 –35:47:02.0 1.7 11 – – – – –
Notes.The sources observed in this study are in boldface, the others are fromBisschop et al.(2007).
Fig. 1. Image of the CH3CN emission using the 130−120 at 239.138 GHz line acquired by the SMA for the massive young stellar objects NGC 7538 IRS9, W3 IRS5, and AFGL490 targeted in this study. The black contour presents the 50% line intensity, and the synthesized beam is shown in white at the bottom left. A 200
radius mask used to extract the spectra is overplotted in dashed red line. Images for the hot core source NGC 7538 IRS1 is presented as well. The latter source has been through the same program as the three other sources.
conversion values2. The spectra were reduced using CLASS3.
A linear baseline was fitted to each 4 GHz spectral chunk us-ing four to seven windows. The individual scans were baseline-subtracted and averaged4. The absolute flux scale of the lines were then set using calibrated SMA data as outlined in detail by Öberg et al.(2013).
SMA observations were acquired in the compact and ex-tended array configurations. The data in the compact configu-ration were taken on 15 October 2011 for all sources and with seven antennas, resulting in baselines between 16 m and 77 m. The data in the extended configuration were obtained using eight antennas, resulting in 44 m to 226 m baselines and were acquired on 29 July 2011 for W3 IRS5 and AFGL490 and on the 15th of August 2011 for NGC 7538 IRS9. We set-up the SMA correlator to obtain a spectral resolution of∼1 km s−1using 128 channels for each of the 46 chunks covering 227−231 GHz in the lower sideband and 239−243 GHz in the upper sideband. Theτ225 GHz
was 0.09 on 29 July, 0.1 on 15 August, and 0.07 on 15 October 20115.
2 Listed at
www.iram.es/IRAMES/mainWiki/Iram30mEfficiencies 3 CLASS website:
http://www.iram.fr/IRAMFR/GILDAS
4 Reduced data are available through the dataverse network at http://dx.doi.org/10.7910/DVN/26562
5 Observations are available on the SMA archive website http://www.cfa.harvard.edu/cgi-bin/sma/smaarch.pl
We used the MIR package6 to perform the first data
reduc-tion steps (flux calibrareduc-tion and continuum subtracreduc-tion). Absolute flux calibration is done with Callisto. The bandpass calibrators 1924−292 and 3c84 were used for the compact observations, and 3c454.3 and 3c279 were used to calibrate 29 July and 15 July observations, respectively. The quasars 0014+612 and 0102+584 were used as gain calibrators for NGC 7538 IRS9, and 0244+624, 0359+509, and we used 0102+584 for W3 IRS5 and AFGL490. The compact and extended data were combined for each source with MIRIAD6 using natural or robust
weight-ing, depending on the data quality, which resulted in synthesized beam sizes of 2.000×1.700for NGC 7538 IRS9, 2.200×2.800for W3 IRS5, and 2.300×2.900for AFGL490.
2.2. Spectral extraction and rms
Both the IRAM and SMA data were frequency-calibrated using the bright 5−4 CH3OH ladder around 241.7 GHz, correcting
for the intrinsic velocity of the different sources. We extracted the SMA spectra using a 200-radius mask around the contin-uum phase center of each source. The mask dimension was chosen to encompass a majority of the CH3CN line emission
at 239.318 GHz that can be associated with a core component,
6 MIR website:
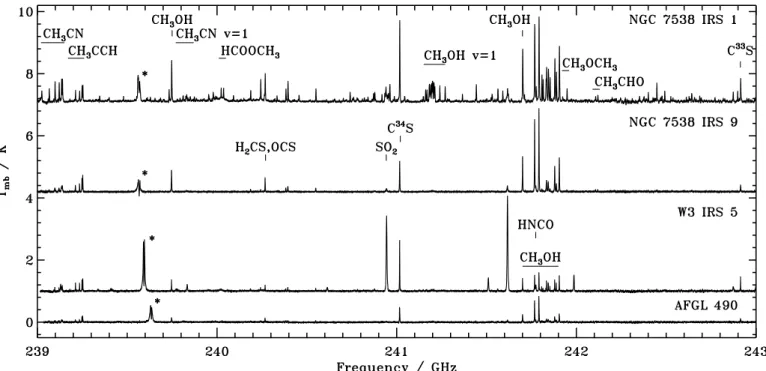
Fig. 2.239−243 GHz spectral window from the IRAM 30 m displaying emission lines for typical hot core source NGC 7538 IRS1 and weak line MYSOs NGC 7538 IRS9, W3IRS5, AFGL490. The star-marked lines are CO ghost lines consistent with the sideband rejection for each source.
as shown in Fig.1. We selected a 200mask size based on a com-bination of theory and data inspection, i.e. the optimal mask size should include all the hot emission and exclude as much as pos-sible of the cold envelope emission. In all sources, the selected mask size should be bigger than the 100 K radius and thus incor-porate all emission associated with a potential hot core. Toward NGC 7538 IRS9 and AFGL 490, where the 100 K radius should be smaller than 200, smaller masks were also explored to more exclusively trace theT > 100 K region, but the resulting spec-tra had generally too low signal-to-noise ratio to be useful for a quantitative analysis. Some colder chemistry contribution to the SMA spectra in these sources cannot, thus, be excluded a priori, but the succeeding analysis (see below) demonstrated that the emission is indeed dominated by hot gas.
The rms for the IRAM and SMA observations of each source was derived in a line free region of several hundred channels: the 229.37−229.445 GHz region for the lower side band and the 240.7−240.75 GHz region for the upper side band. The rms derived for the IRAM observations is between 15 and 20 mK, which is lower than any previous millimeter observations for these sources. For the SMA data, the rms for the lower side band is∼70 mK, and∼100 mK for the upper side band.
3. Results
3.1. Line identification and characterization
Figure 2 shows the IRAM 30 m 239−243 GHz spectra for the three targeted line-poor MYSOs and the hot-core source NGC 7538 IRS1. The organic-poor MYSOs have, as expected, a lower line density, but also many line coincidences with the hot core. Of the lines from complex organics listed byBisschop et al. (2007) found in their sample hot-core sources, CH3OH, CH3CN,
CH3CCH, HNCO, CH3OCH3, and CH3CHO lines were
iden-tified in at least one of the organic-poor MYSOs using the
splatalogue catalog tool7and the CDMS8 and the JPL9spectral
databases (Müller et al. 2001;Pickett et al. 1998). All available lines in the observed spectral range were used for the quantita-tive analysis except for CH3OH where we only used the lines
from the 5−4 ladder to simplify the excitation analysis.
We fitted the identified lines with a Gaussian function in IDL using the routine “gaussfit” for isolated lines and “mpfit-fun” when a multiple Gaussian fit was required because of over-lapping lines. A local baseline component was added to the fits when needed, and the presented uncertainties were output by the fitting routines. We calculated 3σupper limits using an average FWHM for the different sources. Unresolved multiplets were treated in one out three ways depending on the nature of the overlapping lines: 1) if one of the possible contributing lines had a very low Einstein coefficient or high upper energy level and/or is not likely to be detected based on non-detections of the same species in other frequency ranges, then it was assumed to not contribute significantly and was not included in the fit. 2) If the lines came from the same species and the upper energy level and Einstein coefficients were identical or close to identical, then the degeneracies were added and the feature was treated as a single line; 3) if none of the two previous conditions were met, we did not include the multiplet in the analysis.
Line upper energy levels, Einstein coefficients, degeneracies, and quantum numbers from the Splatalogue are listed with the derived line fluxes and FWHM in Table 2 for CH3OH from
the single-dish observations, in Table 3 for CH3OH from the
SMA spectra, in Table4for CH3CN from IRAM, in Table5for
CH3CN from the SMA, in Table6for CH3CCH from IRAM, in
Table7for CH3CCH from the SMA, and in Table8for HNCO,
CH3OCH3, and CH3CHO. Only the lines with an Einstein
coef-ficient logarithm higher than−4.5 and their upper level energy
Table 2.CH3OH lines data from IRAM 30 m spectra.
Freq. Eup logA gu Transition NGC 7538 IRS9 W3 IRS5 AFGL490
R
FdV FHWM R FdV FHWM R FdV FHWM
(GHz) (K) (Jy km s−1) (km s−1) (Jy km s−1) (km s−1) (Jy km s−1) (km s−1) 239.746 49.1 –4.25 11 51,5–41,4A+ 20.7±2.3 3.70±0.03 6.1±0.8 2.32±0.04 4.6±0.7 4.4±0.2 241.700 47.9 –4.22 11 50,5–40,4E 30.8±3.3 3.47±0.02 7.1±0.9 2.43±0.04 6.7±0.9 3.53±0.07 241.767 40.4 –4.24 11 5-1,5–4-1,4E 60.7±6.3 3.37±0.01 11.2±1.3 2.98±0.03 16.7±1.9 3.11±0.02 241.791 34.8 –4.22 11 50,5–40,4A 69.2±7.1 3.37±0.01 12.6±1.5 2.91±0.03 20.3±2.2 3.09±0.02 241.807 115.2 –4.66 22 54–44A± 2.3±0.5 4.5±0.4 1.6±0.3 1.58±0.09 <1.4 – 241.813 122.7 –4.66 11 5-4,2–4-4,1E 1.1±0.4 3.6±0.6 1.2±0.3 1.7±0.2 <1.4 – 241.830 130.8 –4.66 11 54,1–44,0E <1.1 – 1.3±0.3 2.0±0.2 <1.4 – 241.833 84.6 –4.41 22 53–43A± 13.3±1.6 4.61±0.06 5.5±0.7 2.18±0.04 3.6±0.6 4.9±0.2 241.842 72.5 –4.29 11 52,4–42,3A− 10.1±1.4 5.5±0.1 3.2±0.5 1.90±0.08 2.6±0.6 6.8±0.5 241.844 82.5 –4.41 11 53,2–43,1E 2.4±0.5 3.3±0.3 3.2±0.5 2.2±0.1 1.5±0.3 3.50±0.02 241.852 97.5 –4.41 11 5-3,3–4-3,2E 3.2±0.6 5.5±0.4 2.2±0.4 2.1±0.1 1.5±0.4 6.5±0.8 241.879 55.9 –4.22 11 51,4–41,3E 23.5±2.6 3.64±0.02 6.7±0.9 2.58±0.05 5.2±0.7 4.1±0.1 241.888 72.5 –4.29 11 52,3–42,2A+ 8.5±1.1 4.28±0.09 3.8±0.5 2.04±0.06 2.5±0.5 5.2±0.3 241.904 60.7 –4.29 11 5-2,4–4-2,3E 15.9±1.7 3.66±0.02 5.0±0.6 2.57±0.03 3.9±0.5 3.85±0.07 241.905 57.1 –4.30 11 52,3–42,2E 15.9±1.7 3.66±0.02 5.0±0.6 2.57±0.03 3.9±0.5 3.85±0.07
Table 3. CH3OH lines extracted from SMA observations with a 200-radius mask.
Freq. Eup logA gu Transition NGC 7538 IRS9 W3 IRS5 AFGL490
(GHz) (K) R FdV FHWM R FdV FHWM R FdV FHWM
(Jy km s−1) (km s−1) (Jy km s−1) (km s−1) (Jy km s−1) (km s−1) 239.746 49.1 –4.25 11 51,5–41,4A+ 7.6±1.1 4.6±0.2 2.3±0.5 1.9±0.2 3.0±0.7 4.6±0.5 241.700 47.9 –4.22 11 50,5–40,4E 7.3±1.0 4.1±0.2 2.8±0.6 2.4±0.2 3.7±0.8 5.9±0.5 241.767 40.4 –4.24 11 5-1,5–4-1,4E 8.2±1.1 3.5±0.1 3.2±0.6 2.3±0.2 1.8±0.5 2.6±0.3 241.791 34.8 –4.22 11 50,5–40,4A 7.1±1.0 3.16±0.09 3.5±0.7 2.9±0.2 2.4±0.6 4.9±0.7 241.807 115.2 –4.66 22 54–44A± 2.1±0.7 6±1 1.4±0.5 2.4±0.5 <1.1 – 241.813 122.7 –4.66 11 5-4,2–4-4,1E 1.0±0.4 3.6±0.9 1.0±0.5 2.8±0.8 <1.1 – 241.830 130.8 –4.66 11 54,1–44,0E <0.8 – <1.1 – <1.1 – 241.833 84.6 –4.41 22 53–43A± 6.4±1.1 4.7±0.3 3.1±0.7 2.9±0.3 1.8±0.6 4.6±0.8 241.852 97.5 –4.41 11 5-3,3–4-3,2E 1.9±0.6 3.4±0.5 1.4±0.5 1.5±0.4 <1.1 – 241.879 55.9 –4.22 11 51,4–41,3E 5.5±0.9 3.4±0.2 2.6±0.6 2.3±0.2 1.9±0.6 4.7±0.7 241.888 72.5 –4.29 11 52,3–42,2A+ 4.6±0.8 5.2±0.3 1.6±0.5 1.6±0.2 1.8±0.7 7±2 241.904 60.7 –4.29 11 5-2,4–4-2,3E 5.3±0.8 4.5±0.1 1.7±0.3 2.2±0.2 1.7±0.4 5.2±0.5 241.905 57.1 –4.30 11 52,3–42,2E 5.3±0.8 4.5±0.1 1.7±0.3 2.2±0.2 1.7±0.4 5.2±0.5
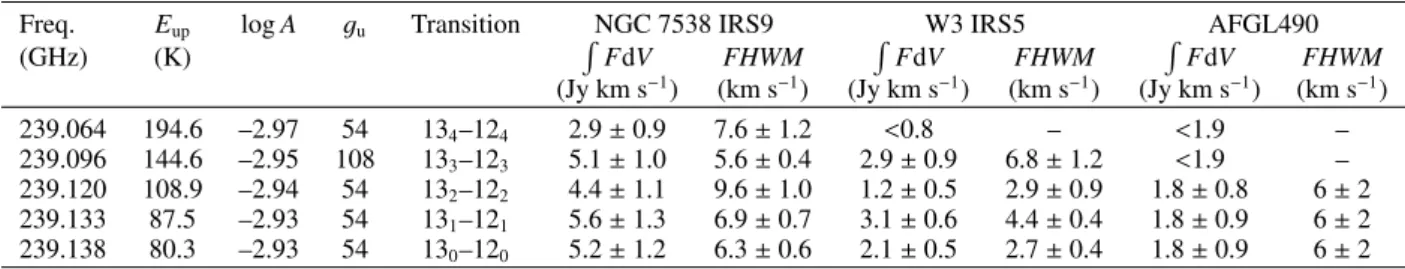
Table 4.CH3CN lines data from IRAM 30 m spectra.
Freq. Eup logA gu Transition NGC 7538 IRS9 W3 IRS5 AFGL490
(GHz) (K) R FdV FHWM R FdV FHWM R FdV FHWM
(Jy km s−1) (km s−1) (Jy km s−1) (km s−1) (Jy km s−1) (km s−1) 239.023 258.9 –3.00 54 135–125 1.6±0.5 9±2 <1.0 – <1.5 – 239.064 194.6 –2.97 54 134–124 2.0±0.7 9±2 0.9±0.3 6±2 1.2±0.4 6±2 239.096 144.6 –2.95 108 133–123 5.3±0.8 6.0±0.3 2.2±0.4 2.2±0.2 2.4±0.6 8±1 239.120 108.9 –2.94 54 132–122 4.5±0.7 5.7±0.3 1.7±0.4 2.8±0.3 1.5±0.5 6±2 239.133 87.5 –2.93 54 131–121 5.8±0.8 4.6±0.2 2.4±0.4 2.4±0.2 2.1±0.5 4.9±0.5 239.138 80.3 –2.93 54 130–120 7.4±1.0 5.2±0.2 2.6±0.4 2.1±0.2 2.4±0.5 5.4±0.5
Table 5.CH3CN lines data from SMA spectra.
Freq. Eup logA gu Transition NGC 7538 IRS9 W3 IRS5 AFGL490
(GHz) (K) R FdV FHWM R FdV FHWM R FdV FHWM
Table 6.CH3CCH lines data from IRAM 30 m spectra.
Freq. Eup logA gu Transition NGC 7538 IRS9 W3 IRS5 AFGL490
(GHz) (K) R FdV FHWM R FdV FHWM R FdV FHWM
(Jy km s−1) (km s−1) (Jy km s−1) (km s−1) (Jy km s−1) (km s−1)
239.088 346.1 –4.07 16 146–136 <1.1 – <0.7 – <1.0 –
239.179 201.7 –4.88 58 144–134 1.0±0.3 3.4±0.6 0.9±0.3 2.5±0.6 <1.0 – 239.211 151.1 –4.00 16 143–133 4.7±0.7 3.1±0.2 4.0±0.5 2.00±0.06 1.5±0.3 3.5±0.4 239.234 115.0 –4.85 58 142–132 5.1±0.7 2.71±0.08 3.6±0.5 1.98±0.07 1.5±0.4 3.0±0.3 239.248 93.3 –4.84 58 141–131 9.0±1.1 2.92±0.05 5.8±0.7 2.2±0.05 2.7±0.4 2.3±0.1 239.252 86.1 –4.84 58 140–130 10.2±1.2 2.74±0.04 6.4±0.8 2.12±0.04 3.7±0.5 2.9±0.1
Table 7.CH3CCH lines data from SMA spectra.
Freq. Eup logA gu Transition NGC 7538 IRS9 W3 IRS5 AFGL490
(GHz) (K) R FdV FHWM R FdV FHWM R FdV FHWM
(Jy km s−1) (km s−1) (Jy km s−1) (km s−1) (Jy km s−1) (km s−1)
239.088 346.1 –4.07 16 146–136 <0.9 – <0.7 – <1.0 –
239.179 201.7 –4.88 58 144–134 <0.9 – 0.9±0.3 2.5±0.6 <1.0 – 239.211 151.1 –4.00 16 143–133 1.8±0.6 3.2±0.5 <1.1 – 1.0±0.6 4.2±1.5 239.234 115.0 –4.85 58 142–132 1.3±0.5 3.5±0.7 <1.1 – <1.0 –
239.248 93.3 –4.84 58 141–131 2.3±0.7 3.5±0.5 <1.1 – <1.0 – 239.252 86.1 –4.84 58 140–130 2.4±0.7 2.9±0.4 <1.1 – 1.6±0.8 5.9±1.9
Table 8.HNCO, CH3CHO, and CH3OCH3lines data from the IRAM 30 m spectra and HNCO line data from the SMA 2” radius compact region.
Species Freq. Eup logA gu Transition NGC 7538 IRS9 W3 IRS5 AFGL490
(GHz) (K) RFdV FHWM RFdV FHWM R FdV FHWM
(Jy km s−1) (km s−1) (Jy km s−1) (km s−1) (Jy km s−1) (km s−1) HNCO 240.876 112.6 –3.72 23 111,11–101,10 2.3±0.6 13±2 2.1±0.5 5.5±0.5 <1.0 – IRAM 241.704 239.9 –3.74 23 112,10–102,9 <1.1 – <1.1 – <1.0 – 241.708 239.9 –3.74 23 112,9–102,8 <1.1 – <1.1 – <1.0 – 241.774 69.6 –3.71 23 110,11–100,10 5.9±0.4 2.3±0.3 4.4±0.7 3.8±0.2 2.1±0.3 1.7±0.4 242.640 113.1 –3.71 23 111,10–101,9 <1.1 – 2.5±0.6 8.9±0.8 <1.0 – HNCO 240.876 112.6 –3.72 23 111,11–101,10 <1.1 – <1.1 – <1.0 – SMA 241.774 69.6 –3.71 23 110,11–100,10 3.2±0.7 5.8±0.6 4.4±0.9 5.2±0.4 <1.0 – 242.640 113.1 –3.71 23 111,10–101,9 1.8±0.6 10±2 <1.1 – <1.0 –
CH3OCH3 225.599 69.8 –3.88 450 121,12–110,11 1.7±0.4 4.2±0.4 0.6±0.3 2.6±0.6 1.5±0.5 8±2 240.985 26.3 –3.99 154 53,3–42,2 <1.1 – <0.8 – <1.3 – 241.529 26.3 –3.99 198 53,2–42,3 <1.1 – <0.8 – <1.1 – 241.947 81.1 –3.78 378 131,13–120,12 1.1±0.4 3.5±0.8 0.4±0.1 1.2±0.3 1.3±0.5 6±2
CH3CHO 223.650 72.3 –3.41 50 121,12–111,11 E 1.1±0.3 2.8±0.3 <0.9 – <1.0 – 223.660 72.2 –3.41 50 121,12–111,11 A 1.4±0.3 3.2±0.3 <0.9 – <1.0 – 226.552 71.4 –3.39 50 120,12–110,11 E 1.5±0.3 2.9±0.3 <0.9 – <1.0 – 226.593 71.3 –3.39 50 120,12–110,11A 1.7±0.4 3.5±0.3 <0.9 – <1.0 – 229.775 61.5 –4.29 46 111,11–100,10A <1.0 – <0.9 – <1.0 – 230.302 81.0 –3.38 50 122,11–112,10A 1.0±0.3 2.5±0.3 <0.9 – <1.0 – 230.316 81.1 –3.38 50 122,11–112,10E 1.0±0.2 2.3±0.3 <0.9 – <1.0 – 242.106 83.9 –3.30 54 131,13–121,12E 1.1±0.4 2.6±0.5 <0.9 – <1.0 – 242.118 83.8 –3.30 54 131,13–121,12A 1.4±0.3 3.7±0.5 <0.9 – <1.0 – 244.789 83.1 –3.29 54 130,13–120,12E 1.2±0.3 3.7±0.5 <0.9 – <1.0 – 244.832 83.1 –3.29 54 130,13–120,12A 1.2±0.5 4.2±0.9 <0.9 – <1.0 – 244.854 72.3 –4.19 50 121,12–110,11E <1.0 – <0.9 – <1.0 –
below 400 K are displayed in the tables. Due to the high line density for CH3OCH3 and CH3CHO, only the lines with an
upper energy level below 200 K are shown for these species. No other complex molecules were detected toward any of the sources. For molecules with weak lines, we only used the IRAM data since the SMA observations have lower spectral resolution and signal-to-noise ratio.
3.2. Spatial origin of the line emission
Figures 3−5 present the line fluxes of key molecules from both the single-dish and SMA observations toward the three
MYSOs. The IRAM beam is 6.2 to 7.2 times larger than the SMA mask ((IRAM radius at 227−243 GHz: 5–5.400)2/(SMA
mask radius: 200)2). That most emission lines in these figures do not display a factor of six or seven difference between the IRAM 30 m and SMA spectra demonstrates a non-uniform emis-sion across the object. Some emisemis-sion line fluxes, most no-tably CH3CN, are similar (within a factor of two) between the
IRAM 30 m and SMA spectra, indicating of a large contribu-tion from unresolved emission at the source center. In contrast, little or no CH3CCH flux from the IRAM is recovered by the
Fig. 3.Spectral window with several CH3CN and CH3CCH lines from the single-dish (black lines, 0.2 MHz spectral resolution) and the 200
in-terferometric data (red line, 0.8 MHz spectral resolution).
the corresponding SMA fluxes is explained by spatial filtering of large-scale emission and/or off-centered emission. CH3OH
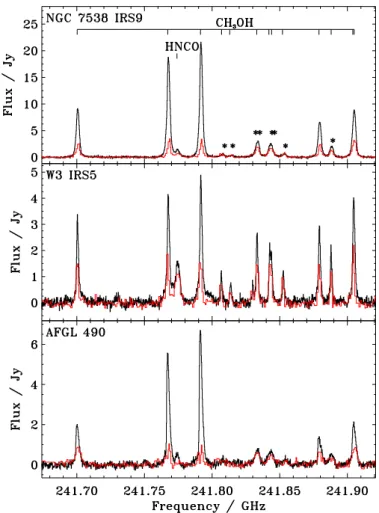
lines display a mixed behavior: lines with higher upper ener-gies show more overlap between the IRAM 30 m and SMA spectra than the colder lines. The IRAM 30 m and SMA line fluxes for the 110,11−100,10HNCO line at 241.774 GHz are close
for NGC 7538 IRS9 and similar for W3 IRS5, but none of the IRAM 30 m flux is recovered by the AFGL490 SMA observa-tions. Based on these lines, HNCO emission appears to be com-ing from both the core and the envelope of NGC 7538 IRS9, from the core of W3 IRS5 alone, and from the envelope of AFGL490. This source-to-source difference could partially come from different excitation conditions in the three sources, and the excitation-abundance structure degeneracy can only be strictly broken by observation of additional lines. The simplest scenario for explaining our detection is for HNCO to have both an extended and a compact origin, however, and this is also sup-ported by the resup-ported excitation characteristics and emission profile of HNCO in other sources (Bisschop et al. 2007).
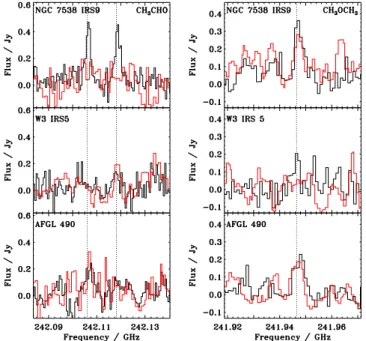
In Fig. 5 the signal-to-noise ratio is lower, but it is still clear that CH3CHO toward NGC 7538 IRS9 only has extended
emission since none of the IRAM 30 m line flux is recov-ered in the SMA spectra. No CH3CHO lines are detected in
the other two MYSOs in the spectral range where IRAM 30 m and SMA observations overlap. CH3OCH3 is detected toward
NGC 7538 IRS9 and AFGL490, and in both cases tentative SMA detections suggest that the emission originates in the source cen-ters. Based on the different emission patterns, the molecules
Fig. 4. Spectral window with several CH3OH lines from the single-dish (black lines, 0.2 MHz spectral resolution) and the 2” interfero-metric data (red line, 0.8 MHz spectral resolution). CH3OH lines with upper level energies higher than 70 K are marked with a star in the NGC 7538 IRS9 to emphasize the increase in SMA/IRAM overlapping for lines with higher upper energy levels.
found in these spectra are classified as follows: CH3CCH and
CH3CHO are envelope organics, CH3CN and CH3OCH3 are
core organics, and CH3OH and HNCO are intermediate cases
with significant core and envelope contributions.
3.3. Rotational temperatures, and column densities
The core and envelope classifications based on spatial emission patterns should be reflected in the rotational temperatures of the different molecules. Figure6shows the rotational diagrams for molecules with enough line detections, i.e., CH3OH (extracted
from IRAM 30 m and SMA spectra) and CH3CN, CH3CCH,
following the method described inGoldsmith & Langer(1999). The line fluxes from the IRAM observations were converted into main beam temperature using the flux-to-antenna temper-ature conversion factor and the beam and forward efficiencies listed online for the EMIR receiver10 and linearly extrapolated for each line frequency (Tmb(K) ' 0.2 ×Flux(Jy)). The line
fluxes from the SMA observation were converted into temper-ature using the Rayleigh-Jeans approximation with a circular beam of 200radius coming from the mask dimension (Tmb(K)'
1.3×Flux(Jy)). Optically thin emission was assumed based on
Table 9. Rotational temperatures and column densities for CH3OH, CH3CN, and CH3CCH derived from the rotational diagrams presented in Fig.6.
Species Bobs/Bemiss NGC 7538 IRS9 W3 IRS5 AFGL490
Trot(K) N(cm−2) Trot(K) N(cm−2) Trot(K) N(cm−2)
CH3OH (IRAM) 500/500 25±2 9±1×10¹⁴ 63±6 3.2±0.4×10¹⁴ 25±2 2.4±0.4×10¹⁴ CH3OH (SMA) 200/200 81±16 2.5±0.4×10¹⁵ 166±85 2.4±0.5×10¹⁵ 102±67 1.2±0.5×10¹⁵ CH3CN 500/200 111±20 7±2×10¹³ 92±23 2.4±0.8×10¹³ 164±78 3.6±1.2×10¹³ CH3CCH 500/500 47±5 1.2±0.3×10¹⁵ 58±8 7±2×10¹⁴ 41±7 4.2±1.7×10¹⁴
Notes.Bobs refers to the beam radius of the telescope used to obtain the molecular lines (500for IRAM and 200for SMA) andBemissto the beam size where the line emission is assumed to be coming from.
Fig. 5.Spectra of two CH3CHO lines at 242.106 GHz and 242.118 GHz (left panel) and the CH3OCH3line at 241.946 GHz (right panel) from the single-dish (black line, 0.2 MHz spectral resolution) and 200
inter-ferometric data (red line, 0.8 MHz spectral resolution). The three line frequencies are marked by black dotted line.
the low line intensities and lack of asymmetry in the line profiles. This assumption was verified by the shape of the rotational di-agram; i.e., flattening or large scatter was observed for lower energy transitions (cf., Bisschop et al. 2007). Considering the possibilities of subthermal excitation in the envelope, the rota-tional temperatures are not expected to be the gas kinetics tem-peratures outside of the core. A 10% uncertainty was added to the line-integrated area and is listed in the tables to account for the line shapes sometimes deviating from the Gaussian shape as-sumed for the fit. We used the “linfit” IDL routine to derive the rotational temperatures, as well as the column densities, and the routine returned the corresponding uncertainties.
Table 9 presents the column densities and rotational tem-peratures derived for these molecules using the rotational dia-grams in Fig. 6. The beam-averaged CH3OH column densities
and rotational temperatures derived from the IRAM 30 m spec-tra agree with those found by van der Tak et al.(2000), based on JCMT single-dish telescope at higher frequencies. The ro-tational temperature and column densities derived for CH3OH
from the SMA data are always higher than those derived by the IRAM 30 m, which is consistent with the SMA observations
probing material closer to the MYSO centers. The E-/A- CH3OH
ratio is consistent with unity within the uncertainties, which agrees withWirström et al.(2011). The derived column densi-ties for CH3CN from the IRAM data assume that the emission is
only coming from the 200radii encompassed by the SMA beam: i.e., we apply a dilution factor of 0.16 to account for the SMA ex-traction mask area (200radius) to IRAM beam (500radius) ratio. This assumption is justified by the CH3CN hot-core like
rota-tional temperatures of 80−110 K toward the different MYSOs, which are also consistent with the CH3OH excitation
tempera-ture derived from the SMA spectra. It is also consistent with the observed overlap between the IRAM and SMA line fluxes (see Fig.3). The rotational temperatures of∼50 K obtained for the CH3CCH 14−13 ladder from the IRAM spectra are consistent
with an envelope origin, but suggests that it is mainly present in the luke-warm envelope regions rather than in the outermost cold envelope.
The rotational diagram method assumes that all data can be described by a single excitation temperature. To test this as-sumption for our data, a two-temperature fit was explored for the case of methanol. Two-temperature fits of CH3OH lines was
investigated byvan der Tak et al. (2000),Leurini et al.(2007), andIsokoski et al. (2013), among others. The full results are presented in Appendix A, but briefly: both a cold and warm component are recovered from the IRAM 30 m data. The de-rived column densities of the cold components are consistent with the single-component fits (within uncertainties), while the warm component is consistent with the single-component fit to the SMA data. The fit to the SMA line data was not improved by adding a second component, verifying our hypothesis that the 200 mask emission is dominated by a hot component for all sources. For HNCO, CH3CHO, and CH3OCH3, no rotational
dia-grams could be built owing to the very small upper-level energy range of the observed transitions, and column densities were cal-culated using the envelope temperature (the CH3OH IRAM 30 m
rotational temperature) if the molecule was classified as an enve-lope molecule and the core temperature (the CH3CN rotational
temperature) if the molecule was classified as a core molecule, and both rotational excitation temperatures if the molecule was classified as intermediate, i.e. HNCO. As seen in Table10, the calculated HNCO abundance with respect to CH3OH is almost
identical regardless of the assumed spatial origin of the line emission. For core molecules, the same dilution factor as for CH3CN was applied (see Table10). For molecules with multiple
Fig. 6.Rotational diagrams of CH3OH from the single dish data (first column), for CH3OH from the SMA spectra extracted with a 2” mask (second column), and CH3CN from the single-dish data (third column), and CH3CCH (fourth column) and for the sources NGC 7538 IRS9 (first row), W3 IRS5 (second row), and AFGL490 (third row).
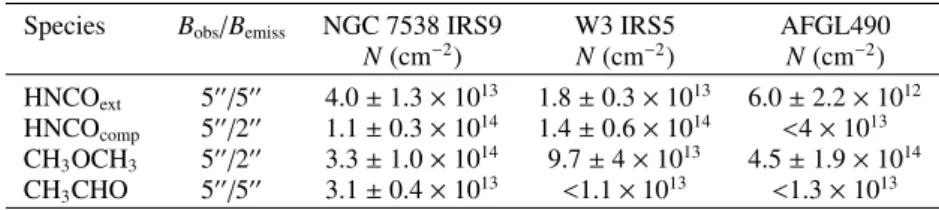
Table 10.Column densities for HNCO, CH3CHO, CH3OCH3using excitation temperatures from Table 7.
Species Bobs/Bemiss NGC 7538 IRS9 W3 IRS5 AFGL490
N(cm−2) N(cm−2) N(cm−2)
HNCOext 500/500 4.0±1.3×10¹³ 1.8±0.3×10¹³ 6.0±2.2×10¹² HNCOcomp 500/200 1.1±0.3×10¹⁴ 1.4±0.6×10¹⁴ <4×10¹³ CH3OCH3 500/200 3.3±1.0×10¹⁴ 9.7±4×10¹³ 4.5±1.9×10¹⁴ CH3CHO 500/500 3.1±0.4×10¹³ <1.1×10¹³ <1.3×10¹³
Notes.Bobsrefers to the beam size of the telescope used to obtain the molecular lines (500for IRAM and 200for SMA) andBemissto the beam size from where the line emission is assumed to be coming from.
Table 11.CH3CN, CH3CCH, HNCO, CH3CHO, CH3OCH3abundances with respect to CH3OH for their respective spatial origin.
Species ratio Spatial origin NGC 7538 IRS9 W3 IRS5 AFGL490 /CH3OH
CH3CN compact 2.8±0.9×10⁻² 1.0±0.4×10⁻² 3.0±1.6×10⁻²
CH3CCH extended 1.3±0.4 2.2±0.7 1.8±0.8
HNCO extended 4.4±1.6×10⁻² 5.6±1.2×10⁻² 2.5±1.1×10⁻² HNCO compact 4.4±1.4×10⁻² 5.8±2.7×10⁻² <3.4×10⁻² CH3OCH3 compact 1.3±0.5×10⁻¹ 4.0±1.8×10⁻² 3.8±2.3×10⁻² CH3CHO extended 3.4±0.6×10⁻² <3.5×10⁻² <5.5×10⁻²
3.4. Organics in hot cores vs. organic-poor MYSOs
By definition, the organic-poor MYSOs reported in this study have less intense emission of complex organic molecules than do line-rich hot cores. The question for this section is whether the chemical composition with respect to CH3OH is different
between the two source families. The CH3CN, CH3CCH,
HNCO, CH3CHO, and CH3OCH3 abundances with respect to
CH3OH obtained here and presented in Fig. 11 for the three
Fig. 7.Gas abundance correlation between organics including upper limits. The black crosses are the abundances derived for the MYSOs, the red squares are derived for hot-core sources byBisschop et al.(2007), and the blue diamonds are results for hot-core sources fromIsokoski et al. (2013). An arbitrary error of 20% has been taken when not reported in the two latest studies.
These three objects were inferred to have large equatorial struc-tures, butIsokoski et al.(2013) found no strong chemical diff er-ences in their chemistry compared to theBisschop et al.(2007) hot-core sources. For the three MYSOs sources, the molecu-lar abundances with respect to CH3OH are calculated using
the CH3OH column densities derived for the envelope if the
molecule has been classified as “envelope” molecules and using the CH3OH column density derived for the core (SMA-based) in
the case of a core molecule. For the hot core sources,Bisschop et al.(2007) applied a dilution factor corresponding to the region whereT >100 K for CH3OH, CH3CN, HNCO, and CH3OCH3,
but not for CH3CCH and CH3CHO. To calculate CH3CCH and
CH3CHO abundances with respect to CH3OH, we removed the
dilution factor for CH3OH applied by Bisschop et al. (2007).
All other abundances were taken directly from Bisschop et al. (2007). Isokoski et al. (2013) could identify a cold and hot methanol emission using single-dish data and the derived col-umn densities for both components have been used in Fig.7in the same way as for the sources analyzed in the present study.
The histograms in Fig.8show that the CH3CN, CH3OCH3,
and HNCO core abundances with respect to CH3OH are
sim-ilar for the organic-poor MYSOs and the hot-core sources. In contrast, the organic-poor MYSOs show higher complex organic envelope abundances, i.e., CH3CHO and CH3CCH, with respect
to CH3OH compared to the hot core sources. This difference is
most likely due to to our not being able to separate CH3OH core
and envelope emission in the study byBisschop et al.(2007), re-sulting in artificially low envelope ratios with respect to CH3OH
when all CH3OH is implicitly assumed to originate in the
enve-lope; in reality, the high excitation temperature of CH3OH in the
hot core sources suggests that most of it really comes from the core.
A similar apparent separation between hot core and organic-poor MYSOs are visible in log–log correlations of molec-ular abundances with respect to CH3OH shown in Fig. 7.
Furthermore, there is a clear correlation between envelope molecules CH3CHO and CH3CCH, but this may simply be due
to the different abundance derivations of cold molecules with re-spect to CH3OH for the hot cores and the weak-line MYSOs,
rather than signifying a chemical relationship. More interest-ingly, these log–log abundance ratio plots show that there is no correlation between the two N-bearing organics CH3CN and
HNCO over an order of magnitude range. There is also no cor-relation between the two O-bearing complex species CH3OCH3
and CH3CHO, which is consistent with their inferred different
origins in the organic-poor MYSOs.
Fig. 8. Number of sources versus the logarithm of their gas phase organic ratio over methanol with respect to the mean for O-bearing species. The solid filled histograms correspond to sources observed and analyzed here, the unfilled histograms correspond to sources from Bisschop et al. (2007) and Isokoski et al. (2013). The left panel presents the O-bearing species data, while the right panel focuses on the N-bearing molecules. HNCO abundances were derived assuming either hot compact emission or cold extended emission, since its origin does not seem to be consistent between sources.
3.5. An ice-gas connection?
The CH3OH ice content may be an important factor in whether
a hot core chemistry developed, so we compare the CH3OH core
column density toward our organic-poor MYSOs and hot cores with their CH3OH ice abundance (with respect to H2O) (see
Table1, Gibb et al. 2004). In the hot cores, the majority of the CH3OH gas originates in the core and we use the derived
column densities fromBisschop et al.(2007), where all CH3OH
emission is assumed to originate in the central region where the temperature is higher than 100 K. To ensure a fair compari-son we calculated the size of the “hot core region” toward our sample using the relation between luminosity and temperature
RT=100 K ≈2.3×10¹⁴(
√
Fig. 9.CH3OH column density in the inner core (calculated area where T >100 K) versus CH3OH ice abundance over H2O ice in the envelope. The stars present the line-poor sources analyzed in this study, while the empty squares are data fromBisschop et al.(2007) for hot-core sources.
source sample. We then assumed that all SMA CH3OH line
flux originate in these regions, based on the derived rotational temperatures, and used an appropriate dilution factor when the 100 K area is smaller than the 200 mask used for spectral ex-traction. Figure9 presents the resulting column density of hot CH3OH gas versus the initial CH3OH abundance on the grains. It
appears that it is primarily the column density of CH3OH that is
different between the line-rich and line-poor sources. No strong correlation with the ice content is observed, but more sources would allow the sample to be divided into luminosity and total mass bins, removing scatter due to initial physical conditions and size of 100 K region. Still, this plot suggests that initial CH3OH
ice content alone does not determine the richness of the MYSO chemistry when correcting for the source luminosity.
The initial ice composition may also affect the complex or-ganic composition in both hot cores and oror-ganic-poor MYSOs cores and envelopes. Figure 10 presents correlation plots be-tween ratios of the N-bearing organics and CH3OH in the ice and
gas phases. The two gas-phase N-bearing organics are HNCO and CH3CN, and the two ice species are OCN−and NH3. The ice
abundances are listed in Table1and have been obtained byGibb et al.(2004). For sake of consistency, only the abundances ob-tained through the analysis technique described and performed by Gibb et al.(2004) were used here though detailed analysis of specific ice species, taking ice environment and using multi-ple vibrational bands into account, have been conduced, e.g., by Taban et al.(2003) in the case of NH3in W 33A.
When combining our new observations with data from the literature, a sample of seven MYSOs have both ice and gas ob-servations. As seen in Fig. 9, only a fraction of them can be used to correlate specific ice ratios, however, because of mul-tiple ice abundance upper limits for many of the sources. For example, W3 IRS5 is not included in any of the plots, because of its CH3OH, OCN−and NH3ice upper limits. This means that
the current data set can only be used to search for tentative cor-relations or to note gross deviations from expected corcor-relations, and not for a proper statistical correlation analysis.
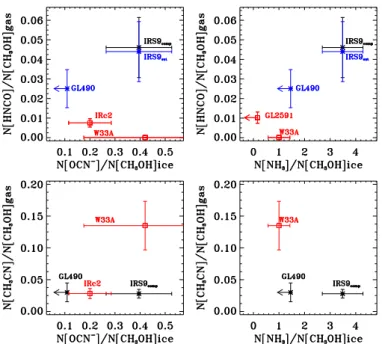
The top lefthand panel of Fig.10shows no conclusive cor-relation between OCN− ice and HNCO in the gas phase with respect to CH3OH. Qualitatively, such a correlation is expected
since HNCO and OCN− are linked through efficient thermal acid-base chemistry within the ice (e.g.,Demyk et al. 1998;van Broekhuizen et al. 2004;Theule et al. 2011). The lack of a corre-lation may therefore simply be due to the difficulty determining
Fig. 10.Ice versus gas abundance correlation for N-bearing species with respect to CH3OH. The crosses are abundances derived for our organic-poor MYSOs, and the red squares are the values derived byBisschop et al.(2007). An arbitrary error of 20% has been assumed for the latter values. For the two top plots, the black crosses represent the HNCO over CH3OH abundance derived for the compact component, while the blue crosses correspond to the HNCO abundance calculation for an extended component.
the OCN−abundance in the ice, so we also explore the corre-lation between HNCO gas and the better constrained NH3 ice.
NH3 is likely the major source of nitrogen in the ice and may
therefore be a proxy for the abundance of N-bearing ices in general. It may also affect the HNCO/OCN−chemistry directly since it is a strong base. The top righthand panel of Fig.10shows that there is indeed a tentative correlation between gas phase abundance of HNCO over CH3OH with respect to NH3.
The relation between OCN− in the ice and CH
3CN in the
gas is explored in the bottom lefthand panel of Fig.10. These molecules do not appear to be correlated for the four sources presented here, despite both containing a CN functional group. Finally, Rodgers & Charnley (2001) predict a correlation be-tween CH3CN gas a NH3ice, but in this limited sample we find
no correlation between the CH3CN/CH3OH gas ratio versus the
NH3/CH3OH ratio in the ice.
4. Discussion
4.1. Organic-poor MYSOs versus hot cores
observations need to be combined to deduce what fraction of the molecular emission originates in the envelope and in the core, and then use these fractions to calculate the chemical compo-sition of the two physically and chemically different regions. Based on this study, this class of molecules seems to mainly en-compass zeroth-generation ices, i.e. CH3OH and HNCO, but as
our sensitivity increases, we expect, based on model results, that many classical hot core molecules will present a significant en-velope emission profile as well (Öberg et al. 2013).
Using the IRAM 30 m and SMA spectra, we could classify several complex organic molecules as belonging to the core, en-velope, and both. The two envelope molecules, CH3CHO and
CH3CCH, were similarly classified by Bisschop et al. (2007)
based on excitation temperatures alone, suggesting that the en-velopes around line-poor MYSOs and hot cores are chemically similar. In contrast we find that in the line-poor MYSOs, CH3OH
and sometimes HNCO have significant emission contributions from the envelope, whileBisschop et al.(2007) find that in hot core sources, they have excitation temperatures above 100 K and were thus classified as originating exclusively in the core region; these sources have probably a similar envelope line flux to the one observed for the line-poor MYSOs, but in single-dish stud-ies, this emission contribution is drowned out by the hot cores.
Overall, the chemistry in the young MYSOs is remarkably similar to what is observed in the hot cores, which suggests that they may be hot core precursors. CH3CN, CH3CCH, CH3CHO,
HNCO, and CH3OCH3 are observed in both kinds of sources
at comparable abundances with respect to CH3OH. CH3CH2OH
and HCOOCH3– two typical hot-core molecules – are not seen
in the organic-poor MYSOs, but typical abundance of these molecules with respect to CH3OH fromBisschop et al.(2007)
are consistent with non-detections. The hot-core precursor inter-pretation is also consistent with the observed lack of correlation between CH3OH core column density or hot-core activity on the
initial CH3OH ice abundance.
4.2. The ice-gas connection: observations vs. theory
Regardless or whether the overall hot-core chemistry depends on the initial ice composition, we expect that the ice composi-tion will have an effect on the chemical composition in both hot cores and line-poor MYSOs. This dependence may look very different for complex molecules that form in the gas phase from evaporated ices compared to products of complex ice chemistry. That we do not observe a clear trend between NH3 in the ice
and CH3CN in the gas suggests that the model of Rodgers &
Charnley(2001) is missing important complex molecule forma-tion pathways. We have therefore used the state-of the-art chem-ical model MAGICKAL (Garrod 2013) to explore the connec-tion between ice and gas phase species further. The model uses a rate-equation/modified rate-equation approach, treating the gas phase, ice surface, and bulk ice as coupled, but distinct, chemical phases.
Garrod(2013) produced generic, single-point hot-core mod-els that treated first a cold collapse to 107 cm−3, followed by
a warm-up from 8 to 400 K at fixed density, assuming a typi-cal grain size of 0.1µm and 106surface binding sites. We reran
the warm-up phase, adopting the medium warm-up timescale of 2×10⁵years to reach 200 K (whose results appear best to fit
var-ious other observational results), but altering the ice abundances prior to warm-up. The original H2O ice abundance is retained,
while the CH3OH, CH4, HNCO, and NH3 values are varied to
mimic the observed ranges in the combined line-poor MYSOs and hot cores sample (see M1 to M5 in Table12). Even though
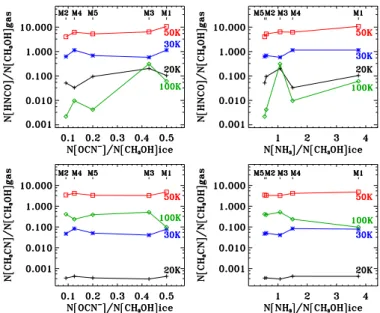
Fig. 11. Model ice versus gas abundance correlation from the MAGICKAL model (Garrod 2013). Five initial ice abundances (M1 to M5) are used to run the models and derived N-bearing abundances with respect to CH3OH. The black plus signs present the results at 20 K, the blue crosses are the model results at 30 K, the red squares represents 50 K, and the green diamonds are the results at 100 K.
Table 12.Initial ice abundances with respect to water used for the five chemical model simulation M1–5.
Species ratio M1 M2 M3 M4 M5 CH3OH/H2O 4 11 14 4 10
CH4/H2O 2 2 2 2 2
HNCO/H2O 2 1 6 0.5 2
NH3/H2O 15 6 15 6 6
Notes.The three-phase model assumes a H2O abundance with respect to hydrogen of 2.66×10⁻⁷n
Hfor the ice surface and 1.46×10⁻⁴nHfor the ice bulk.
the ice abundance ratios correspond to the sources in this study, it is not possible to directly compare observations and simula-tion since key physical parameters such as densities and warm up rates of each specific object is not taken into account. The simulations are instead used here to investigate chemical trends. The resulting gas-phase abundances of HNCO, CH3CN, and
CH3OH are reported at different temperatures during warm-up
in Table13.
The relationships during protostellar warm-up between gas-phase HNCO and CH3CN with respect to CH3OH, and OCN−
and NH3 initial ice abundances with respect to CH3OH ice are
shown in Fig.11 for temperatures between 20 K and 100 K. Since the model does not treat ion chemistry in the ice, a full conversion rate of HNCO ice into OCN− has been assumed based on the efficient HNCO to OCN− conversion derived ex-perimentally by Demyk et al. (1998), van Broekhuizen et al. (2004),Theule et al.(2011), among others. The resulting com-plex molecular gas abundances are regulated by a combination of temperature and initial ice composition. The sensitivity to ice composition varies significantly with temperature however, the gas-phase HNCO/CH3OH ratio, for example, barely changes
Table 13.Gas abundances with respect to hydrogen at various temperatures derived by theGarrod(2013) model for the initial ice abundances presented in Table12.
Model Species n(20 K)/nH n(30 K)/nH n(50 K)/nH n(100 K)/nH
M1 CH3OH 1.6×10⁻¹¹ 1.1×10⁻¹² 4.9×10⁻¹¹ 3.2×10⁻⁹ HNCO 1.7×10⁻¹² 1.2×10⁻¹² 5.3×10⁻¹⁰ 1.9×10⁻¹⁰ CH3CN 6.8×10⁻¹⁵ 8.5×10⁻¹⁴ 2.4×10⁻¹⁰ 3.1×10⁻¹⁰ M2 CH3OH 2.0×10⁻¹¹ 1.9×10⁻¹² 1.1×10⁻¹⁰ 6.8×10⁻⁹
HNCO 1.0×10⁻¹² 1.2×10⁻¹² 4.5×10⁻¹⁰ 1.5×10⁻¹¹ CH3CN 6.8×10⁻¹⁵ 8.9×10⁻¹⁴ 3.9×10⁻¹⁰ 2.8×10⁻⁹ M3 CH3OH 2.2×10⁻¹¹ 2.6×10⁻¹² 1.1×10⁻¹⁰ 7.3×10⁻⁹ HNCO 4.4×10⁻¹² 1.5×10⁻¹² 7.3×10⁻¹⁰ 2.3×10⁻⁹ CH3CN 6.8×10⁻¹⁵ 1.1×10⁻¹³ 3.7×10⁻¹⁰ 3.8×10⁻⁹ M4 CH3OH 1.6×10⁻¹¹ 9.6×10⁻¹³ 5.9×10⁻¹¹ 3.7×10⁻⁹ HNCO 5.4×10⁻¹³ 1.1×10⁻¹² 3.6×10⁻¹⁰ 3.6×10⁻¹¹ CH3CN 6.8×10⁻¹⁵ 8.1×10⁻¹⁴ 2.4×10⁻¹⁰ 8.8×10⁻¹⁰ M5 CH3OH 1.9×10⁻¹¹ 1.8×10⁻¹² 9.4×10⁻¹¹ 6.4×10⁻⁹
HNCO 1.8×10⁻¹² 1.3×10⁻¹² 4.9×10⁻¹⁰ 2.7×10⁻¹¹ CH3CN 6.8×10⁻¹⁵ 9.2×10⁻¹⁴ 3.1×10⁻¹⁰ 2.5×10⁻¹⁰
complex chemistry thus clearly requires knowing both the tem-perature structure and the initial ice composition of a source.
Based on the observational and theoretical results that most HNCO and CH3CN emission start at high temperatures, we
fo-cus on the predictions at 100 K. At this temperature, the HNCO gas vs. methanol content is, as expected, correlated to the ini-tial amount of OCN−over methanol in the ice. This result sug-gests that with more sources and/or better constraints on OCN− ice abundances, a clearer correlation in the observed data should appear as long as the model captures the dominant HNCO for-mation/destruction pathways. The observed tentative correlation between gas-phase HNCO and NH3ice is consistent with model
predictions, except for the M3 run. In the M3 model, the high absolute abundance of HNCO ice results in a longer HNCO des-orption time scale, which shifts the abundance peak of HNCO to higher temperatures and results in the high [HNCO]/[CH3OH]
ratio at 100 K; at higher temperatures, M3 no longer deviates from the trend. To fully explore the effects of NH3and OCN−on
the final complex organics abundances clearly requires a much larger grid of models that covers all possible combinations of ice abundances as well as investigating the temperature depen-dences of the complex chemistry.
In contrast to what has been proposed by Rodgers & Charnley (2001), the abundance of CH3CN with respect to
CH3OH does not correlate with either the NH3ice content in the
MAGICKAL code output or with the cyanide ice-related species OCN−. This agrees with the observational results. In Rodgers & Charnley (2001) and Garrod(2013), CH3CN forms mainly
through radiative association reaction in the gas phase between CH+3 and desorbing HCN giving CH3CNH+. The correlation
between CH3CN and NH3 predicted byRodgers & Charnley
(2001) comes from a cycled production of HCN from NH3. The
latter is, however, not observed in MAGICKAL, which explains the lack of correlation between CH3CN and NH3.
In summary, there is some encouraging tentative agreement between model predictions and observations. To directly com-pare models and observations requires, however, that the appro-priate model results are mapped onto the temperature-density profiles of individual sources, since both ice composition and
temperature are shown to strongly affect the complex chem-istry (Öberg et al. 2013). Thus, to draw any general conclu-sions requires a large sample of spatially-resolved gas-phase observations, along with ice observations of the same object. As shown here, organic-poor high-mass protostars contain de-tectable amounts of complex organic material and present a sim-ilar chemistry to bright hot cores. Most massive YSOs with ex-isting ice observations could therefore be used to expand the sample of sources.
5. Conclusions
We detected complex organic molecules CH3CN, CH3CCH,
CH3CHO, and CH3OCH3 together with HNCO and CH3OH,
toward three massive YSOs without any previous evidence of hot-core chemistry activity. Using a combination of single-dish and interferometry observations, we found that CH3CN
and CH3OCH3 emission originates in the central core region,
CH3CHO and CH3CCH in an extended envelope, and CH3OH
and, sometimes, HNCO have both envelope and core emission components. The inferred molecular emission locations are con-sistent with rotational temperatures derived from the single-dish observations, except for CH3OH, where single-dish data are
dominated by the envelope.
The high-temperature abundances of complex organics with respect to CH3OH are indistinguishable for the organic-poor
MYSOs and the sample of hot core sources fromBisschop et al. (2007) andIsokoski et al.(2013). The envelope chemistry also seems similar for both kinds of sources, but this analysis is lim-ited by a lack of CH3OH envelope data toward hot core sources.
No strong correlation between initial CH3OH ice abundance and
hot CH3OH gas column density close to the central object was
observed.
The NH3ice abundances seem to affect the HNCO/CH3OH
Fig. A.1.Results of a two component fit of the CH3OH rotational dia-grams for the three line-poor MYSOs using the IRAM 30 m spectra.
More sources with both ice and gas data are required to set-tle how ice abundances affect complex molecule distributions around MYSOs. This could be achieved by collecting mid-IR ice spectra (using SOFIA for example), and performing spatially re-solved millimetric observations of sources with no detected hot-core molecules.
Acknowledgements. The authors thank the anonymous referee and the edi-tor Malcolm Walmsley for helpful comments and suggestions. E.C.F. is sup-ported by a Rubicon fellowship (680-50-1302), awarded by the Netherlands Organisation for Scientific Research (NWO). R.T.G. is funded by the NASA Astrophysics Theory Program, grant number NNX11AC38G. Astrochemistry in Leiden is supported by the Netherlands Research School for Astronomy (NOVA), by a Royal Netherlands Academy of Arts and Sciences (KNAW) pro-fessor prize, and by the European Union A-ERC grant 291141 CHEMPLAN.
Appendix A: Two-component fit of the CH3OH
rotational diagrams
The IRAM 30 m and SMA CH3OH line data have been
ana-lyzed further to explore whether the data is better fit by two dis-tinct temperature distributions than by the one assumed in the rotational diagrams in the main body text. In fact, two Boltzman
distributions would be expected for the IRAM 30 m data, since these spectra include both the envelope and the warm core seen in the SMA spectra. Figure A.1 presents the two-component rotational diagrams for the three MYSOs. The fits were per-formed using the IDL routine MPFIT with the initial temperature guesses of 20 K and 100 K and initial column densities guesses of 5×1014cm2and 1×1015cm2.
For all three MYSOs the data is well fit by two components, but the uncertainties in the derived excitation temperatures and column densities are very large, demonstrating that the signal-to-noise ratio of this data set is not sufficient for a quantitative two-component analysis. Still, it is clear that in each case, the cold component has a slightly lower excitation temperature than the single-component fit. The derived column densities agrees (taking the large uncertainties into account) between the two fits, supporting our assumption that the IRAM 30 m CH3OH spectra
are dominated by the envelope. Each fit also results in a warm component. While the excitation temperatures have large uncer-tainties, they are all consistent with those derived from the SMA data, further supporting the conclusions based on that data set. Owing to these large uncertainties for the column densities and the hot component temperature, single-temperature fitting was used for the quantitative analysis in the paper. Higher signal-to-noise ratio single-dish data could clearly be used, however, to si-multaneously constrain temperature and column densities of the two components, limiting the need for high-spatial-resolution observations for some sources.
We also attempted to fit the CH3OH SMA spectra with two
temperature components using the same fitting routine and initial guesses. In each case, the outcome was that a single-component fit the data as well as two components; i.e., it was not possible to distinguish multiple components with different temperatures within the SMA masks. This confirms that the SMA beam sam-ples only the hot CH3OH component and filters out the extended
cold emission.
References
Bisschop, S. E., Jørgensen, J. K., van Dishoeck, E. F., & de Wachter, E. B. M. 2007,A&A, 465, 913
Blake, G. A., Sutton, E. C., & Masson, C. R. 1987,ApJ, 315, 621
Carter, M., Lazareff, B., Maier, D., et al. 2012,A&A, 538, A89
Cazaux, S., Tielens, A. G. G. M., Ceccarelli, C., et al. 2003,ApJ, 593, L51
Charnley, S. B., Tielens, A. G. G. M., & Millar, T. J. 1992,ApJ, 399, L71
Chavarría, L., Herpin, F., Jacq, T., et al. 2010,A&A, 521, L37
Cuppen, H. M., van Dishoeck, E. F., Herbst, E., & Tielens, A. G. G. M. 2009,
A&A, 508, 275
Demyk, K., Dartois, E., & d’Hendecourt, L. 1998,A&A, 339, 553
Doty, S. D., van Dishoeck, E. F., van der Tak, F. F. S., & Boonman, A. M. S. 2002,A&A, 389, 446
Ehrenfreund, P., & Charnley, S. B. 2000,ARA&A, 38, 427
Fuchs, G. W., Cuppen, H. M., Ioppolo, S., et al. 2009,A&A, 505, 629
Fuente, A., Neri, R., & Caselli, P. 2005,A&A, 444, 481
Garrod, R. T. 2013,ApJ, 765, 60
Garrod, R. T., Weaver, S. L. W., & Herbst, E. 2008,ApJ, 682, 283
Gibb, E. L., Whittet, D. C. B., Boogert, A. C., & Tielens, A. G. G. M. 2004,
ApJS, 151, 35
Goldsmith, P. F., & Langer, W. D. 1999,ApJ, 517, 209
Helmich, F. P., Jansen, D. J., de Graauw, T. H., Groesbeck, T. D., & van Dishoeck, E. F. 1994,A&A, 283, 626
Herbst, E., & van Dishoeck, E. F. 2009,ARA&A, 47, 427
Isokoski, K., Bottinelli, S., & van Dishoeck, E. F. 2013,A&A, 554, A100
Leurini, S., Schilke, P., Wyrowski, F., & Menten, K. M. 2007,A&A, 466, 215
Megeath, S. T., Wilson, T. L., & Corbin, M. R. 2005, ApJ, 622, L141
Mitchell, G. F., Lee, S. W., Maillard, J.-P., et al. 1995,ApJ, 438, 794
Müller, H., Thorwirth, S., Roth, D. A., & Winnewisser, G. 2001,A&A, 370, L49
Öberg, K. I., Garrod, R. T., van Dishoeck, E. F., & Linnartz, H. 2009,A&A, 504, 891
Öberg, K. I., Bottinelli, S., Jørgensen, J. K., & van Dishoeck, E. F. 2010,ApJ, 716, 825
Öberg, K. I., Boamah, M. D., Fayolle, E. C., et al. 2013,ApJ, 771, 95
Pickett, H. M., Poynter, R. I., & Cohen, E. A. 1998, J. Quant. Spectr. Rad. Transf., 60, 883
Rodgers, S. D., & Charnley, S. B. 2001,ApJ, 546, 324
Rodón, J. A., Beuther, H., Megeath, S. T., & van der Tak, F. F. S. 2008,A&A, 490, 213
Sandell, G., Goss, W. M., & Wright, M. 2005,ApJ, 621, 839
Schreyer, K., Semenov, D., Henning, T., & Forbrich, J. 2006,ApJ, 637, L129
Taban, I. M., Schutte, W. A., Pontoppidan, K. M., & van Dishoeck, E. F. 2003,
A&A, 399, 169
Theule, P., Duvernay, F., Ilmane, A., et al. 2011,A&A, 530, A96
Tielens, A. G. G. M., & Hagen, W. 1982,A&A, 114, 245
van Broekhuizen, F. A., Keane, J. V., & Schutte, W. A. 2004, A&A, 415, 425
van der Tak, F. F. S., van Dishoeck, E. F., & Caselli, P. 2000,A&A, 361, 327
van der Tak, F. F. S., Tuthill, P. G., & Danchi, W. C. 2005,A&A, 431, 993
Viti, S., Collings, M. P., Dever, J. W., McCoustra, M. R. S., & Williams, D. A. 2004,MNRAS, 354, 1141
Watanabe, N., & Kouchi, A. 2002,ApJ, 571, L173
Watanabe, N., Shiraki, T., & Kouchi, A. 2003,ApJ, 588, L121
Watanabe, N., Nagaoka, A., & Shiraki, T. 2004,ApJ, 616, 638
Wirström, E. S., Geppert, W. D., Hjalmarson, Å., et al. 2011,A&A, 533, A24