EXAMINING THE EFFICACY AND FEASIBILITY OF DIGITAL ACTIVITY MONITORS AND SHARED ACTIVE DESKS
TO REDUCE EMPLOYEE SEDENTARY BEHAVIOR
Christopher A. Jones
A dissertation submitted to the faculty at the University of North Carolina at Chapel Hill in partial fulfillment of the requirements for the degree of Doctor of Public Health in the
Department of Health Policy and Management.
Chapel Hill 2016
ii ©2016
iii ABSTRACT
Christopher A. Jones: Examining the Efficacy and Feasibility of Digital Activity Monitors and Shared Active Desks
to Reduce Employee Sedentary Behavior (Under the direction of Jim Porto)
iv
TABLE OF CONTENTS
LIST OF TABLES ... viii
LIST OF FIGURES ... ix
CHAPTER 1: INTRODUCTION ... 1
Background ... 2
Promoting Health Habits in the Workplace ... 4
Pedometer Use in Reducing Sedentary Work Habits ... 6
Wearable Activity Monitors ... 7
Biofeedback ... 8
The Quantified Self ... 9
Context for Research ... 11
Conceptual Framework ... 12
Intervention Arms ... 13
CHAPTER 2: LITERATURE REVIEW ... 15
Search Strategy ... 16
Process for Reviewing Articles ... 17
Plan for Analysis ... 20
Search Results ... 20
Discussion ... 23
Gaps in Literature ... 24
Weaknesses of Search Strategies ... 24
v
CHAPTER 3: METHODOLOGY ... 31
Setting ... 32
Subjects Selection Criteria ... 32
Design ... 33
Outcome Measures ... 35
Physical Outcomes ... 35
Psychosocial Outcomes ... 36
Health Behaviors ... 36
Data Analysis ... 37
CHAPTER 4: RESULTS ... 39
Activity Levels - Steps ... 42
Activity Levels - Sedentary Time ... 44
Activity Levels - Distance ... 45
Weight ... 46
Pre/post Goal Achievement ... 47
Monthly Group Goal Achievement ... 48
Calculating Monthly Group Goal Means (MGGM) ... 48
Self-perceptions of Health ... 50
Sleep ... 54
Adherence and Retention ... 57
Suggested Strategies, Barriers and Facilitators ... 60
CHAPTER 5: DISCUSSION ... 65
The Effect of Departmental-Level Use of Fitbit Activity Monitors on Sedentary Behavior ... 65
Differences in Step Counts ... 67
vi
Do Activity Monitors Promote Engagement and Adherence? ... 69
Psychosocial Effects ... 70
Perceived Barriers and Facilitators to Active Behavior in the Workplace ... 71
Limitations to this Study ... 72
Areas for Future Research ... 75
Things that were not Studied in this Research ... 75
CHAPTER 6: PLAN FOR CHANGE ... 76
Implementation ... 86
Evaluation ... 87
Sharing Results ... 87
Sustainability ... 88
Suggestions for Future Implementations Based on this Research ... 88
APPENDIX A: PAR Q FORM ... 92
APPENDIX B: JOB DESCRIPTION INDEX FROM BOWLING GREEN STATE UNIVERSITY AND THE CENTERS FOR DISEASE CONTROL AND THE NATIONAL INSTITUTE FOR OCCUPATIONAL SAFETY AND HEALTH QUALITY OF WORKLIFE ... 93
APPENDIX C: SATISFACTION WITH LIFE SCALE (SWLS) ... 95
APPENDIX D: STATE-STRAIT ANXIETY INVENTORY (STAI) ... 96
APPENDIX E: MEDICAL OUTCOMES SHORT FORM-36 ... 100
APPENDIX F: RECRUITMENT LETTER ... 101
APPENDIX G: ACTIVE DESK TREADMILL TRAINING CHECKLISTS ... 102
APPENDIX H: ACTIVE DESK BICYCLE TRAINING CHECKLISTS ... 105
APPENDIX I: STUDY RECRUITMENT LETTER ... 107
APPENDIX J: ADAM TRAINING SCHEDULE ... 116
vii
APPENDIX L: WELLNESS KICKOFF SLIDES ... 118
APPENDIX M: FITBIT.COM GROUP EXERCISE DASHBOARDS ... 120
APPENDIX N: FITBIT.COM PERSONAL DASHBOARD ... 122
APPENDIX O: ACTIVE DESK RESERVATION CALENDAR ... 123
APPENDIX P: ACTIVE DESK RESERVATIONS FORM ... 124
APPENDIX Q: INDIVIDUAL RESPONSES FROM BARRIERS AND FACILITATORS SURVEY ... 126
viii
LIST OF TABLES
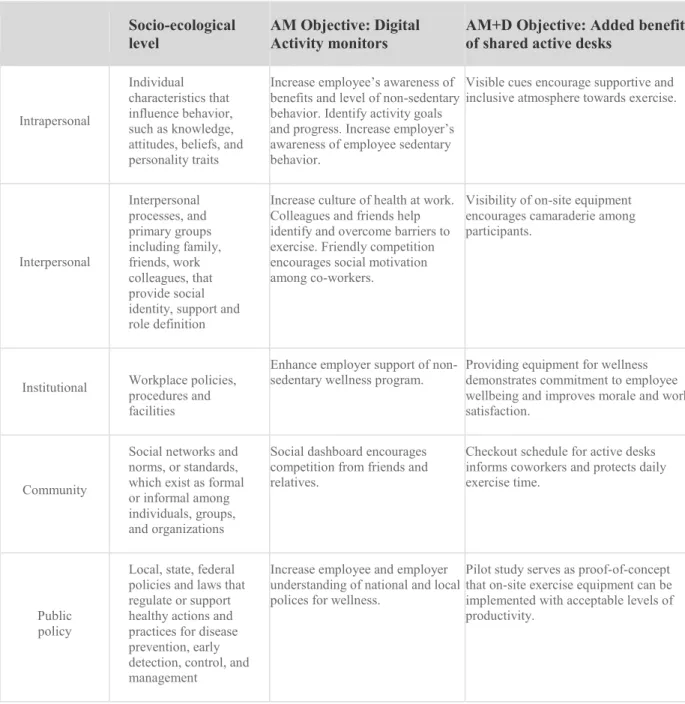
Table 1 - The socio-ecological model and objectives of pilot workplace activity study
interventions ... 14
Table 2 - Trials using self-monitors in wellness interventions ... 26
Table 3 - Trials using active workstations in wellness interventions ... 28
Table 4 - Baseline characteristics of study dropouts with comparisons to study mean. ... 41
Table 5 - Steps at baseline and follow up for 3 groups ... 42
Table 6 - Sedentary minutes at baseline and follow up for 3 groups ... 44
Table 7 - Distance at baseline and follow up for 3 groups ... 46
Table 8 - Weight and BMI at baseline and follow up for 3 groups ... 46
Table 9 - Mean goal days at baseline and follow up for 3 groups ... 47
Table 10 - Mean participant score in RAND 36-item health survey (Version 1.0). ... 51
Table 11 - Mean scores on pre/post psycho-social self-assessments ... 55
Table 12 - Activity monitor adherence throughout 210 day study ... 59
Table 13 - Objectives/stakeholder alignment - 7 phases of CDC steps to wellness guide ... 80
Table.14 - Policies that promote and hinder physical activity. ... 83
Table 15 - Timeline for departmental wellness committee ... 85
ix
LIST OF FIGURES
Figure 1 - Literature Search Process ... 19
Figure 2 - Participants included and excluded from recruitment through analysis ... 40
Figure 3 - Group Daily Mean Steps ... 43
Figure 4 - Group monthly mean sedentary minutes... 45
Figure 5 - Mean weekly group goal achievement ... 48
Figure 6 - Mean monthly group goal completion percentage within groups ... 49
Figure 7 - Active desk reservations by desk ... 58
Figure 8 - Suggested strategies for non sedentary behavior at work ... 62
Figure 9 - Barriers to non-sedentary behavior – post study barriers and facilitators survey ... 63
1
CHAPTER 1: INTRODUCTION
This study examined data gathered in a workplace wellness trial whose interventions were aimed at reducing sedentary behavior. Groups differed based on variations in methods to improve workplace wellness, and included health education, activity monitors and active work desks. The setting covers three different departments at Wake Forest Baptist health.
A recently published systematic review and meta-analysis by Biswas et al found that long periods of sedentary time were positively associated with an increased risk for dying (from all-causes, cancer and cardiovascular diseases) and increasing the risk for certain forms of cancer (specifically breast, colon, colorectal, endometrial, and epithelial ovarian cancer), cardiovascular disease and type 2 diabetes. The meta-analysis found that the largest association was with type 2 diabetes (a 91% increased risk). Their analysis showed that the risk of dying prematurely from all-causes was 30% greater for those who spent little to no time in regular physical activity than those who met their minimum physical activity recommendations of 30 minutes/day.3
2
adult North Carolinians get the recommended minimum of 150 minutes/week of physical activity at a moderate level due in part to excess sedentary-behavior.4 Sedentary behavior refers to “any waking activity characterized by energy expenditure ≤ 1.5 metabolic equivalents and a sitting or reclining posture”5, which includes activities such as sitting or lying down. Typical sedentary behaviors include TV viewing, video game playing, computer use (collective termed “screen time”), working at a desk and driving.
The nature of the modern workforce has contributed to overall physical inactivity. Employed adults spend more than half their waking hours working, and sedentary jobs have increased 83% since the 1950s. Sedentary behavior is a public health crisis and the obvious interventional setting is the workplace.6
Obesity-related absenteeism costs an estimated $4.3 billion in the United States annually7. Employers also bear indirect costs of poor worker health including lower productivity and higher rates of disability, injury and workers’ compensation claims.8 To ensure more productive
employees in the workplace, employers must promote programs that are directly tailored to improve the physical and mental health of their unique workforce.
This dissertation aims to collect and evaluate outcome measures from three workplace
interventions aimed at reducing sedentary behavior tested within clusters in an academic medical center. Outcomes were compared between groups to determine which workplace health
promotion program was most effective in reducing sedentary behavior.
Background
3
employers was approximately $45 billion per year in 2002.10 Sturm found healthcare spending to be 36% t higher in obese adults than those of normal-weight under the age of sixty-five.11 The majority of these excess costs came from treating hyperlipidemia, diabetes and heart disease. People with chronic conditions are the heaviest users of healthcare services and account for 84% of all healthcare spending.12
Adults are now spending “almost half of their waking hours at work”13 where, over the last 30 years work tasks in developed, high-income countries have become computer-based. A study in the American Journal of Epidemiology found those who are inactive and sit for more than 6 hours per day are 94% more likely to die prematurely than those who are active and sit less than 3 hours a day.14,15 Recent epidemiologic studies have reported that metabolic and long-term health consequences of too much sitting are distinct from those associated with a lack of moderate-to-vigorous exercise.16 A progressive risk for cardiovascular disease and cancer has been identified in those with excess sedentary behavior and described as a dose-response association to time spent seated which is independent of physical activity.17
4
triglyceride levels, and two hour glucose levels that are independent of total time spent sedentary, and total time spent exercising.20
Employers can offer workplace health promotion programs (WHPP) to reduce health risks and improve quality of life for their employees. In addition, employers that provide WHPP to employees can build strong loyalty with employees and improve job satisfaction and moral. WHPP benefit employers through enhanced productivity, reduced rates of absenteeism and lower insurance costs. Investment in employee health contributes to a company’s positive public
image. Employers who promote employee wellbeing benefit from improved recruitment and long-term employee commitment by creating a culture of health.21
Promoting Health Habits in the Workplace
Many employers offer wellness initiatives that provide screening, assessment and preventative wellness activities. Wellness programs include health risk assessments, diet and exercise promotion and wellness education sessions. Many employers are now providing wearable activity monitors that provide support and friendly competition among coworkers; some collect biometric information such as weight, BMI and cholesterol levels to gauge progress 22 and to reward employees who reach exercise engagement targets.
5
51% of larger firms and 26% of smaller firms that offer health benefits also report offering employee biometric screenings that measure risk factors, such as body weight, cholesterol, blood pressure, stress, and nutrition. Of firms that offer biometric screening, 1% of larger firms require the screening as a condition of health plan enrollment. 8% of large firms offer financial
incentives directly tied to meeting biometric outcomes.24
Almost all employers (98% of large firms and 73% of small firms) surveyed in the Kaiser HRET survey reported offering at least one wellness program. The report notes “74% of employers offering health benefits offer at least one of the following wellness programs in 2014: 1) weight loss programs, 2) gym membership discounts or on-site exercise facilities, 3) biometric
screening, 4) smoking cessation programs, 5) personal health coaching, 6) classes in nutrition or healthy living, 7) web-based resources for healthy living, 8) flu shots or vaccinations, 9)
Employee Assistance Programs (EAP), or a 10) wellness newsletter.”
36% of large firms and 18% of small firms that offer health insurance benefits offer financial incentives to employees who participate in a wellness program. These incentives came in the form of smaller premiums, smaller deductibles, and higher contributions to the HRA/HSA or cash prizes. 12% of large firms with 200 or more employees offered an incentive for completing a wellness program.25
6
The plan goes on to detail strategies that can be employed in the workplace to support healthy weight behaviors such as promoting teamwork and camaraderie to create a workplace
environment friendly to positive choices and physical activity. The group encourages supervisors to use their authority to make healthy choices the easiest choice in the areas they control. Owners and managers are encouraged to maintain worksites and benefit plans that support health and productivity.
Over the past 20 years technology has evolved to create a new category of consumer electronic devices which promote active behavior. This evolution can be seen in the innovation from simple mechanical pedometers to rechargeable consumer digital activity monitors. The devices have enabled both research and consumer communities to observe subtle changes in active behavior. This new class of consumer devices has led to the emergence of social communities which feature members who share similar health goals and allow them to compete against one another, support one another and collect reliable information about their own engagement in activity over the long haul. We’ll explore this evolution in the activity monitor and supportive communities in the paragraphs below.
Pedometer Use in Reducing Sedentary Work Habits
7
these studies is to encourage increased habitual physical activity, and to improve health-related quality of life.
A variety of workplace walking interventions have been developed to improve health-related outcomes and to increase PA levels of employees 33,34. Workplace pedometer-based interventions with goal setting (such as 10,000 steps/ day) and weekly e-mail messages have shown a positive effect on PA and health outcomes in the long term 35 as well as in the short-term 36. Positive correlations between number of steps and health outcomes have been shown 37,38. Chan and colleagues reported an average daily step count increase of 3,451 ± 2,661 for a group of
interventions. This increase in steps was followed by a significant decreases ( P = 0.05) in body weight (kg), BMI (kg/m2), waist girth (cm), and heart rate (beats/min). There were no significant changes in systolic or diastolic blood pressure. These results illustrate the potential of the
workplace as a setting for health promotion and PA strategies.
Pedometers are an example of a feedback tool used to quantify and inform those engaging in exercise programs of their progress toward personal goals. With the rise of smart phone
technology and associated gadgets, a new category of biofeedback devices are rapidly emerging to assist and inform individual wellness efforts. One such device is the wearable activity monitor. Wearable Activity Monitors
The use of self-monitors has increased rapidly since the introduction of an activity monitor device called the Fitbit® in 2008. These rechargeable electronic devices come in various forms that are attached to clothing or worn as bracelets. Activity-monitors are typically used for monitoring and tracking fitness-related metrics such as distance walked or run, calorie
8
now primarily used for dedicated electronic monitoring devices that are wirelessly synced to a smartphone or computer for data tracking and ongoing evaluation.
Many of the devices provide motivational updates via email or through biofeedback such as a buzz on the wrist to encourage the user to assume an active state. Applications connected to these devices display metrics graphically for self-evaluation and encouragement. Many of these applications feature social elements that use techniques to motivate users to compete against friends and family across a variety of categories such as steps taken, goals achieved, badges earned or floors climbed. Activity monitors are emerging as a popular type of biofeedback device.
Biofeedback
Biofeedback is the process of gaining greater awareness of physiological systems through use of instruments that provide information on monitored functions, with the goal of being able to manipulate them at will39. Biofeedback is one of the earliest behavioral medicine treatments and has been practiced in clinical settings since the 1970’s. Biofeedback achieves its results through psychophysiological (mind-body) self-regulation meaning the ability to observe oneself and acquire the skills needed to make changes in one’s physiology, behavior, or lifestyle in order to promote well-being and health.
9
psychologists, physical therapists, drug rehabilitation counselors, dentists and other professionals to treat an array of disorders40.
Professional athletes and health enthusiasts have been tracking their health data for years, but now health-monitoring devices are becoming more accessible to the layman. Using activity monitors connected to the internet and reviewing information gathered on personal dashboards can be used as a treatment technique to improve individuals’ health from information gathered on their bodies41. The field of biofeedback has expanded with the proliferation of newer devices which consumers and purchase to track their own activity levels. Consumers who track their engagement using devices are often called “quantified selfers” as they line up with an emerging health through self-observation movement called “The Quantified Self”.
The Quantified Self
In nations with developed information technology (IT), including the United States, the use of IT that tracks, analyzes, and provides feedback on health and biometric data (diet, exercise, and activity level) is gaining popularity. For example, the ‘‘quantified self’’ (QS) movement, started in the United States, encourages people to use computers, smartphones, various electronic gadgets, and even pen and paper to track and manage one’s sleep patterns, work, exercise, diet, and mood 42. The philosophy behind the QS movement is that by using data, which can be collected relatively easily through available technology, one can significantly improve understanding of one’s health and thus gain insights into different approaches to improving health.
10
easy-to-use IT devices and software into their lives, healthy habits, which require effort, can be sustained. The QS phenomenon has not stopped at tracking and managing simple health-related metrics, such as weight or frequency of exercise, but has expanded into actively treating disease and health conditions43.
Individuals who quantify their goals and progress using biometric devices often use the internet to participate in collaboration and friendly competition around health metrics. One such example of social health collaboration is CureTogether.com. CureTogether is a web site popular with the QS movement that provides forums for patients with similar symptoms and conditions to share their information and to empower them with increased control and decision-making44 this type of consumer-empowering movement, however, is still in its infancy. Because the technology to automate health and biometric data tracking and analysis is not yet mature, consumers’ efforts and levels of dedication limit the use of these techniques. For example, in a pilot study of a patient-and provider-shared glucose monitoring program using a web application called Diabetes Connect, 37% of the 75 patients enrolled did not submit any blood glucose readings 45. There are several possible explanations for this behavior. First, managing a chronic condition can be confusing and overwhelming for some patients, and they may be unwilling to prioritize the effort needed to self-manage their condition. Second, many patients believe that a chronic condition is too complex for patients to manage on their own. Lastly, the technologies that enable self-tracking have not yet matured to the level suitable for addressing chronic disease management; they still attract only the most tech savvy crowd, who are more experienced and resilient with troubleshooting technology and solving technical problems46.
11
individual consumer’s attitude and behavioral intention. Health and biometric self-tracking are given appropriate significance only when coupled with the consumer’s efforts and desires to be informed.
What combination of biometric devices, social dashboards and environmental medications are most effective in promoting non-sedentary behavior to employees at an academic medical center? The goal of this research is to design and conduct a pilot study that tests two different technology based workplace health promotion programs. Physical, psychosocial and physical activity outcome measures were recorded before and after a six month period. Results were examined to determine the most effective use of resources within the setting as compared to a control group. Conclusions from this study will be used to inform leadership on optimal strategies to reduce sedentary behavior in future workplace health promotion program design.
Context for Research
12
ensure that active desks could be installed in our institution. The concept and many details of a future research study was explored in conversations with these representatives.
Conceptual Framework
This research project is based upon the Socio-ecologic Model (SEM), (Table 1 - The socio-ecological model and objectives of pilot workplace activity study interventions). The SEM provides a broader perspective to health promotion and integrates multiple levels of influence to health behavior and health outcomes. Levels of influence include intra- and interpersonal factors, institutional level influences, community level factors and public policies.47
In this project multicomponent interventions were reviewed based on principles in the SEM within three separate departments engaged in worksite health promotion programs at a large academic medical center. The interventions were examined over a six month period with baseline measures taken prior to the delivery of the intervention and then reassessed at the 6-month end of study follow-up. Measured outcomes include physical and psychosocial health as well as physical activity behaviors.
13
Intervention Arms
1. Usual Treatment (UT) group provided physical, psycho-social and activity measures at 0 and 6 months. They wore an activity monitor for two weeks at baseline and again at follow-up. The activity monitor was provided to the participant with electrical tape covering the LED readout which prevented any feedback from the device informing the participant.
2. Activity monitor (AM) group received a monthly wellness education topic delivered in a group setting at their workplace. They also wore a digital activity monitor throughout the study. This activity monitor served multiple purposes including:
a. Intervention - providing quantified-self feedback
b. Social support - facilitate feedback and peer-support networks
14
Table 1 - The socio-ecological model and objectives of pilot workplace activity study interventions
Socio-ecological level
AM Objective: Digital Activity monitors
AM+D Objective: Added benefit of shared active desks
Intrapersonal
Individual characteristics that influence behavior, such as knowledge, attitudes, beliefs, and personality traits
Increase employee’s awareness of benefits and level of non-sedentary behavior. Identify activity goals and progress. Increase employer’s awareness of employee sedentary behavior.
Visible cues encourage supportive and inclusive atmosphere towards exercise.
Interpersonal Interpersonal processes, and primary groups including family, friends, work colleagues, that provide social identity, support and role definition
Increase culture of health at work. Colleagues and friends help identify and overcome barriers to exercise. Friendly competition encourages social motivation among co-workers.
Visibility of on-site equipment encourages camaraderie among participants.
Institutional Workplace policies, procedures and facilities
Enhance employer support of non-sedentary wellness program.
Providing equipment for wellness demonstrates commitment to employee wellbeing and improves morale and work satisfaction.
Community
Social networks and norms, or standards, which exist as formal or informal among individuals, groups, and organizations
Social dashboard encourages competition from friends and relatives.
Checkout schedule for active desks informs coworkers and protects daily exercise time.
Public policy
Local, state, federal policies and laws that regulate or support healthy actions and practices for disease prevention, early detection, control, and management
Increase employee and employer understanding of national and local polices for wellness.
15
CHAPTER 2: LITERATURE REVIEW
This literature review aims to describe a platform from which sensible, effective interventions can be implemented to use digital activity sensors and active workstations to reduce sedentary habits in the workplace. This research proves that an intervention that uses wireless fitness monitors, stated fitness goals and continuous feedback on progress in an organized wellness program will reduce sedentary time and improve overall employee health. The existing literature has been reviewed to find studies that have examined wellness interventions in the workplace including active desks and digital activity monitors. Using consumer generated data in wellness is a rapidly emerging field. The use of fitness monitors builds upon a body of evidence already established for traditional mechanical pedometers in wellness interventions. Therefore the literature was also reviewed to summarize the status of research in the area of pedometer-based wellness interventions.
This literature review aims to answer three questions:
1. What evidence exists that activity-monitors are used in worksite health promotion?
2. What evidence exists that active workstations are used in worksite health
promotion?
3. What evidence exists on the effectiveness of pedometer-based interventions in a
16
Search Strategy
Questions one and two of this review included peer-reviewed, descriptive and analytical studies, published in English, in a journal article after 2008, using both quantitative and qualitative methods that study wellness programs featuring wireless wearable activity monitors or active workstations interventions to reduce sedentary behavior. Review criteria for detailed review included studies that summarize trials conducted on a robust sample with published wellness outcomes The literature search was conducted using a meta-search engine provided by the University of North Carolina called “Articles +” which searches thousands of scholarly journals from one meta-search box.
To answer question one, phrases that indicate the presence of the activity monitor were specifically searched. These devices are currently known by several phrases such as “activity monitor,” “fitness monitor,” “personal monitor,” “consumer based physical activity monitor” and “self-monitor.” For question two, phrases that look for desks that feature active exercise
17
For question three the best use of pedometers to reduce sedentary behavior was investigated. Initial searches uncovered a large amount of research on the use of pedometers in wellness programs. Therefore
papers that provide a meta-analysis on the topic of pedometers used in wellness interventions were compiled and
summarize. . To research the third question regarding use of pedometers in a wellness intervention the reviewer searched on the keyword pedometer and (wellness or “health
promotion” or fitness). Initial research indicated that pedometers in wellness programs is a well-studied scenario. The reviewer searched the Cochrane Reviews, a database of systematic reviews and meta-analyses, for a recent seminal, meta-analysis on the topic. Cochrane Reviews are systematic reviews of primary research in human health care and health policy, and are
internationally recognized as the highest standard in evidence-based health care for prevention, treatment and rehabilitation.
Process for Reviewing Articles
To compile appropriate articles that answer the research question, the following process was used to ensure a comprehensive and targeted analysis: all references returned in the initial search will be imported into Zotero reference management software version 4.0.17; Zotero was used to open and read the abstract of each paper; if the paper describes a clinical trial that involves 1) a wearable wireless activity monitor as a worksite wellness intervention, 2) active workstations as
Search phrase 1: ("quantified self" OR "activity monitor" OR "Fitness monitor" OR "personal monitor" OR "consumer based monitor" OR "Consumer Based Physical Activity Monitor" OR "self-monitor") and (wellness OR "health promotion" OR fitness)
Input into UNC Articles +
Search Phrase 2: (“active desk” OR “active workstation” OR “treadmill desk” OR “bicycle desk”) and (“Workplace” OR “worksite” or “employee” or “jobsite” or “worker”) Input into UNC Articles +
18
a worksite wellness intervention or 3) a meta-analysis of pedometers used as a wellness intervention, it was included in the initial collection of articles to review
19
20
Plan for Analysis
For search questions one and two, the final pool of literature was compiled and remaining papers were reviewed to identify any problems with validity of the methods used. Validity of the final article pool was evaluated by ensuring all remaining articles have been peer reviewed and conducted in an ethical manner as defined in the Code of Ethics of the American Educational Research Association. Papers were evaluated to ensure no obvious financial or proprietary motive exists for publishing the research.
The remaining articles were summarized in a grid describing the methods and summarizing the conclusions of each trial found using monitors and active desks in a wellness program.
For the third search question each section of the most relevant meta-analysis found was summarized describing the objectives, methods, results and discussion.
Search Results
Search phrase one initially returned a pool of 84 peer reviewed journal articles published on or after 2008. 5 articles were not retrievable using UNC University library licensing resources. 36 articles were not a meta-analysis, systematic review, research paper or trial. Many were editorials or opinion pieces. 34 articles did not contain any information about wireless tracking sensors. 5 articles were excluded because they did not include a wellness outcome: these papers looked at athletes, education and military readiness. One article was excluded due to an obvious corporate motive in promoting its own products.
21
selective reporting of outcomes. The third article used a current generation of the self-monitor aimed to test a theoretical model as its primary outcome. The authors identified subtle changes in the user emotion and psyche caused by self-tracking, self-reflection, self-management, and data recording. Some interesting examples included falsifying records, failing to meet self-set goals when users temporarily felt relieved from the constant “survey” by the self-monitor, and altering their daily behaviors in order to simplify the recording process.
Search phrase two returned 33 articles. These articles were screened for duplicates and to ensure they met all the criteria of the search strategy. One was eliminated as a duplicate. 17 were excluded because they did not report wellness outcomes. 3 were not conducted in a workplace and 5 did not feature active desks including treadmill desks or stationary bicycles as an
intervention. The 4 remaining studies included randomized clinical trials featuring active workstations as a wellness intervention in a workplace and measured health outcomes. The results of these studies are summarized in (Table 2). Each of the four studies featured treadmill desks in a workplace setting. Three of the four studies used digital activity monitors as a data collection method. All 4 of the studies reported favorable health outcomes reported after active workstations were introduced into the workplace. Metrics included reduced time spent sedentary, an increase in physical activity on work days increased steps as counted by the digital activity monitor and increase in daily activity caloric expenditure. Challenges noted were difficulty recruiting subjects for study, perceptions of inequity from staff not equipped with desks, disruptions in workflow when switching from non-active to active desks and privacy concerns due to public visibility of active desks.
Freak-22
Poli et al in January 2014 searched for randomized controlled trials of workplace health promotion interventions that involved pedometers worn by employed adults. The authors searched a range of electronic libraries and references to relevant papers, compiling an initial pool of 3,282 potential papers. Using the search and inclusion process depicted above (Figure 1) the authors narrowed the final pool of papers to7, representing four randomized controlled trials that met their rigorous criteria for inclusion. Eligible papers included cluster-randomized
controlled trials of workplace health promotion interventions with a pedometer component in employed adult subjects. Eligible studies featured a primary outcome of physical activity in the research design. Secondary outcomes included adverse effects and subsequent health outcomes. The 4 remaining studies provided data for 1,809 employees. 60% of these subjects were
allocated to the intervention group. All included studies assessed immediate post-intervention outcomes with an intervention duration varying between three to six months. All studies had usual treatment control conditions. One study, however, featured an alternative physical activity program as the control group while the other three had minimally active control groups. The authors found a high risk of bias in all four studies due to the lack of blinding, self-reporting of outcome measures, incomplete outcomes due to attrition and absence of published protocols thereby increasing the likelihood of selective reporting.
While three of the studies compared the pedometer intervention group to a minimally active control group, the results for physical activity could not be combined because each study used different measures of activity. One study observed a significant increase in physical activity by the pedometer intervention group, the other two did not find a significant difference.
Improvements were found in secondary outcomes including body mass index, waist
23
pedometer program. However, these results were based on limited data from one or two small studies. No difference was observed between the study groups in blood pressure, a number of biochemical outcomes or quality of life scores. Sedentary behavior and disease risk scores were not measured by any of the included studies. The authors found significant baseline imbalances in the fourth study and therefore were unable to distinguish true improvements associated with the program.
Overall the authors concluded there was limited and low quality evidence to assess the
effectiveness of pedometer interventions in the workplace for increasing physical activity and improving subsequent outcomes. The authors promoted the need for more high quality
randomized controlled trials to assess the effectiveness of such interventions. Suggestions for future studies to improve the quality of results included publishing a protocol, reducing attrition and blinding personnel (especially those who are tasked with documenting outcome measures).
Discussion
Review of the literature showed few studies have investigated the relationship between physical activity using wireless monitoring devices, active workstations and workplace wellness
programs. To advocate for widespread use of wearable tracking technology in the sedentary office environment, additional research is needed to explore the effects of biofeedback,
24
Gaps in Literature
The focus of this review has been on discovering available research about active desks and user feedback in wellness interventions. A large body of literature has reported outcomes using traditional pedometers as part of the intervention, but a small amount of research has been published describing outcomes on active desks and self-monitors.
The wearables market including self-monitors is anticipated to grow rapidly over the next few years with some estimates predicting the wearables market at 485 million annual device
shipments by 2018. Analysts estimate 13 million wearable fitness tracking devices are expected to be incorporated into workplace wellness programs within five years.49
This anticipated large market growth combined with very little research to guide implementation represents a tremendous gap in the scientific literature.
Studies are needed to guide program design and implementation of wellness programs promoting strategies for effectively using the technology to engage users in activities safely and to improve healthy habits.
Weaknesses of Search Strategies
Potential weaknesses of the search strategies in this literature review include the limited number of sources reviewed and the final number of studies (11 combined) summarized. A more
25
Conclusion
26
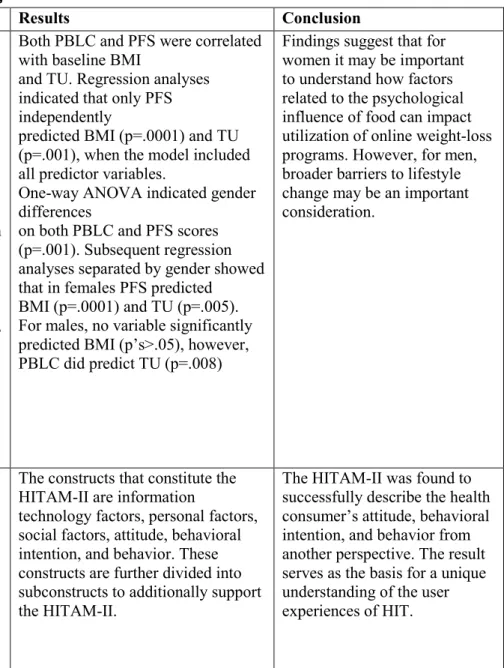
Table 2 - Trials using self-monitors in wellness interventions
Study Methods Results Conclusion
The relationships of the psychological influence of food and perceived
barriers to lifestyle change to body mass index and to utilization of online weight loss tools
The psychological influence of food and perceived barriers to lifestyle change were considered as predictors of body mass index (BMI)and website tool utilization, in an online weight-loss program.
The Healthy Weight Center (http://www.healthyweightcenter. net) is an evidence-based, Internet weight-loss program that includes nutrition, fitness, and behavioral information, monitoring tools, and a moderated support network. This study is an archival analysis of all (n=1361) overweight/obese (BMI M=31.6 ± 6.24 kg/m2), adult
(M=42.0 ±10.72 yrs), online program users (82.4% female) from
December 2007 through October 2010. I considered the following predictor variables: Perceived
Barriers to Lifestyle Change (PBLC), the Power of Food Scale (PFS), age, and longest lifetime period of maintained weight loss in relation to 1) BMI 2) Tool Utilization (TU; meal plan, nutrition lookup, weight and activity monitors, journal, moderated support group).
Both PBLC and PFS were correlated with baseline BMI
and TU. Regression analyses indicated that only PFS independently
predicted BMI (p=.0001) and TU (p=.001), when the model included all predictor variables.
One-way ANOVA indicated gender differences
on both PBLC and PFS scores (p=.001). Subsequent regression analyses separated by gender showed that in females PFS predicted
BMI (p=.0001) and TU (p=.005). For males, no variable significantly predicted BMI (p’s>.05), however, PBLC did predict TU (p=.008)
Findings suggest that for women it may be important to understand how factors related to the psychological influence of food can impact utilization of online weight-loss programs. However, for men, broader barriers to lifestyle change may be an important consideration.
A Qualitative Analysis of User Experiences With a Self-Monitor for Activity, Sleep, and Diet
The aim of this study was to abstract the constructs that constitute the user
experiences of the self-monitor for activity, sleep, and diet.
The study group consisted of 18 female college students who
participated in an in-depth interview after completing a 3-month study of utilizing a self-monitor designed to monitor activity, sleep, and diet. The steps followed in the analysis were: (1) extraction of constructs from theoretical frameworks, (2) extraction of constructs from interview data using a qualitative
The constructs that constitute the HITAM-II are information
technology factors, personal factors, social factors, attitude, behavioral intention, and behavior. These constructs are further divided into subconstructs to additionally support the HITAM-II.
27
Additionally, to develop and verify the Health Information Technology Acceptance Model-II (HITAM-II) through a qualitative data analysis approach
methodology, and (3) abstraction of constructs and modeling of the HITAM-II.
Web-based
self-monitoring for weight loss among overweight/obese women at increased risk for breast cancer: the HELP pilot study
Excess weight and physical inactivity are modifiable risk factors for breast cancer. Training women to use self-help resources over the internet has potential for reducing intervention costs and enhancing maintenance.
A total of 50 overweight/obese women at increased breast cancer risk were randomized to a 12-week intervention or a comparison group. Telephone-based sessions trained participants to use web-based self-monitoring tools to set goals and track diet and exercise. The comparison group received dietary information but no training. At baseline and 12 weeks, participants were weighed and wore an
accelerometer.
Participants were aged 60.9 +/- 0.8 years with a BMI of 33.1 +/- 0.6 kg/m2. The intervention group lost 3.3 +/-4.0 kg, whereas the
comparison group gained 0.9+/-3.4 kg (p<0.0001). Intervention participants who found the website helpful lost 5.6 +/- 0.7 kg; those who did not lost 0.8 +/- 0.9 kg (p<0.001). Change in physical activity was +70 +/-140 min/week among those who found the website helpful, -6+/-75 min/week among those who did not, and -34+/-207 min/week in the comparison group (p<0.01).
28
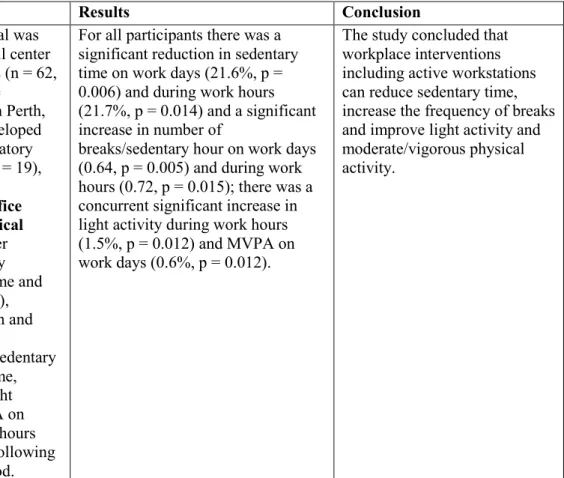
Table 3 - Trials using active workstations in wellness interventions
Study Methods Results Conclusion
Participatory Workplace Interventions Can Reduce Sedentary Time for Office Workers—A Randomized Controlled Trial
The purpose of the study was to determine if participatory workplace interventions could reduce total sedentary time, sustained sedentary time (bouts .30 minutes), increase the frequency of breaks in sedentary time and promote light intensity activity and
moderate/vigorous activity (MVPA) during work hours.
A randomized controlled trial was conducted using clerical, call center and data processing workers (n = 62, aged 25–59 years) in 3 large
government organizations in Perth, Australia. Three groups developed interventions with a participatory approach: ‘Active office’ (n = 19),
‘Active Workstation’ and promotion of incidental office activity; ‘Traditional physical activity’ (n = 14), pedometer challenge to increase activity between productive work time and ‘Office ergonomics’ (n = 29), computer workstation design and breaking up computer tasks.
Accelerometer determined sedentary time, sustained sedentary time, breaks in sedentary time, light intensity activity and MVPA on work days and during work hours were measured before and following a 12 week intervention period.
For all participants there was a significant reduction in sedentary time on work days (21.6%, p = 0.006) and during work hours (21.7%, p = 0.014) and a significant increase in number of
breaks/sedentary hour on work days (0.64, p = 0.005) and during work hours (0.72, p = 0.015); there was a concurrent significant increase in light activity during work hours (1.5%, p = 0.012) and MVPA on work days (0.6%, p = 0.012).
29
Implementation and adherence issues in a workplace treadmill desk intervention
This study reports
experiences, observations, and general lessons learned, with regards to participant recruitment and adherence, while implementing a 6-month randomized controlled treadmill desk intervention in a health insurance workplace.
The study was planned in
conjunction with other innovative health campaigns being initiated at the workplace, such as promotion of a walking track, reconfigurement of meeting rooms and furniture to promote “standing meetings”. The Usual Working Group was instructed to maintain their normal work patterns (e.g., seated while working at their cubicle/ office desks) throughout the course of the study.
Treadmill Desk Group participants were supported by a Biomedical interventionist to use one of 8 shared treadmill desks twice daily up to 45 min/session (90 min/day).
There were no statistically
significant differences in any of these variables between Usual Working Group and Treadmill Group or between recruitment cohorts within these groups.
Data collected during pilot study promotes greater understanding of the barriers and facilitators to active desk utilization in a real world office setting. Employees reported challenges with the location and the timing of the intervention. May employees reported administrative and productivity challenges when conducting a wellness campaign with shared active desks.
Evaluation of a Workplace Treadmill Desk Intervention A Randomized Controlled Trial
This study’s purpose was to evaluate the effectiveness of a 3-month treadmill desk intervention in eliciting changes in physical activity and sedentary behavior among overweight/obese office workers.
A randomized controlled trial was conducted among overweight/obese office workers (n = 41; mean age = 40.1 ± 10.1 years) at a private workplace. Participants were randomly assigned to a
shared-treadmill desk intervention (n = 21) or a usual working condition control group (n = 20).
Accelerometer-determined physical activity and sedentary behavior were measured before and after the intervention.
Compared with the control group, the intervention group increased daily steps (1622 steps/day; P = 0.013) and light physical activity (1.6 minutes/ hour; P = 0.008), and decreased sedentary time (−3.6 minutes/hour; P = 0.047) during working hours.
Shared-treadmill desks in the workplace can be effective at promoting favorable changes in light physical activity
(specifically 40 to 99 steps/minute) and sedentary behavior among
30
Treadmill Workstations: The Effects of Walking while
Working on Physical Activity and Work Performance
A 12-month-long experiment in a financial services company to study how the availability of treadmill
workstations affects employees’ physical activity and work performance.
Sedentary workers were recruited. Half were given treadmill
workstations during the first two months of the study, the other half during the seventh month of the study. Participants were allowed to use standard working desks or treadmill desks at will. Participants were equipped with accelerometers.
The total average daily activity caloric expenditure of participants increased by more than 74 calories, the consequence of a decline of more than an hour a day in sedentary activities and a concomitant increase in light and active activities.
31
CHAPTER 3: METHODOLOGY
According to the review of existing literature, there is a gap of knowledge in predicting
feasibility of wellness interventions in the workplace. The objective of this study was to trial two multi-component wellness programs in the targeted workplace setting as compared to a control group, in order to provide valuable information on feasibility and effectiveness of each approach. Ultimately the results of this study will inform selection-criteria used by institutional decision makers who are evaluating worksite wellness scenarios in the near future.
The Central hypotheses of this study are described as follows:
Hypothesis 1: Departmental-level use of digital activity monitors will reduce
sedentary behavior during the workday as measured by a Fitbit One® personal
activity-monitor in comparison to the control group.
Sub hypothesis A: Departmental-level use of digital personal activity-monitors in the workplace will demonstrate weight loss among overweight and obese
employees.
32
Hypothesis 2: Availability of shared active desks in the workplace will amplify the
gains made in physical activity as measured by Fitbit One® personal activity
monitor and weight loss.
Adherence and participation was evaluated in both treatment groups by reviewing activity monitor usage rates throughout the six month voluntary trial.
Setting
All participants in this study were employees from three departments that exhibit a sedentary work style (more than six hours per day seated at a desk) at a large academic medical center. The three departments were chosen due to their similarities in employee age, gender, weight and work-style. The intervention was administered in the workplace setting. Testing occurred during working hours at participant offices and at the Wake Forest University Health and Exercise Science Department Clinical Research Center.
Subjects Selection Criteria
Employees from three departments at Wake Forest Baptist Health were asked to participate in the study: 1) the Northwest Area Health Education Center (AHEC); 2) the Family Medicine Academic Support Staff (Family Med); and 3) the department of Medical Education (MedEd). Only employees from these three departments were included in this study. Employees in all three departments work in a similar sedentary office environment. All potential participants completed the Physical Activity Readiness Questionnaire (PAR-Q) to evaluate risk for engaging in a mild-to-moderate physical activity program (See appendix A). Exclusion criteria included answering “Yes” to any of the 7 questions on the PAR-Q, indicating they have a medical condition which puts them at an increased risk by engaging in moderate to vigorous exercise. Additional
33
or wellness programs. Individuals with systemic, uncontrolled diseases (ex. uncontrolled
diabetes, unstable angina, uncontrolled cardiac dysrhythmia, severe aortic stenosis, recent (last 6 months) or current treatment for cancer, thyroid disorders, cardiovascular disease, chronic obstructive pulmonary disease, and inflammatory bowel diseases) were excluded. Individuals were excluded based on their potential inability to complete the tasks required for the protocol, as well as conditions that may interfere with the interpretation of the results. These conditions included inability to ambulate, severe congestive heart failure or severe cardiovascular disease, and neoplasm for practical and neurophysiologic reasons. Individuals did not participate if they were already involved in an intervention research study.
Design
This study was a prospective cluster intervention that compared the outcomes of 2 different intervention groups to a control group. The groups were tested in three separate departments exhibiting a sedentary work-style at a large academic medical center:
1. The Usual Treatment group (UT) was asked to continue their usual work style throughout the six month trial. Blinded activity monitors were handed out to this group for fourteen days at 0 and 6 months. The UT group was instructed not to obtain and use personal activity monitors during this six-month period. Otherwise, they were asked to carry out their normal routines.
34
brochures on these topics were distributed to AM participants via email on a twice a month schedule (1 month for each topic). In addition they were provided with the Fitbit One® digital activity monitor.
3. Active Desk + Activity Monitor (ADAM) received the same treatment as AM with the addition of shared active desks. Four shared workstations equipped with a computer and phone and either a treadmill or stationary bicycle were provided to participants in this study arm. Participants received training on how to safely use the workstation and connect remotely to their usual organizational resources via the installed computer equipment. A checkout procedure was provided that enabled the employees to reserve sessions in advance. The goal was for participants to reserve and use the active desk equipment for at least 30 minutes per day, five days per week. A usage log at the conclusion of each session was completed with distance, speed and notes recorded. For both ADAM and AM, study participants were asked to attempt to exercise at least 30 minutes per day 5 days per week and issued a goal of 10,000 steps per day. They were trained on how to review the digital readout of the device, how to track their activity through steps, miles and stairs climbed and how to track their sleep using the device. The digital activity monitor software was installed on their standard departmental workstation to provide on-demand feedback about their activity and their progress towards their goals. Participants in the two groups with activity monitors joined separate “community groups” to eliminate contamination between groups. This feature automatically uploaded activity data from the Fitbit One® such that individuals could view their progress on a web-dashboard and see how they performed relative to others in their group.
35
included 1) steps taken, 2) distance traveled by foot, 3) floors climbed, and 4) daily time spent in sedentary, light, fairly light, and very active activities. This group feature
allowed easy tracking of participants on achieving their goals for steps as well as activity minutes. All participants in the intervention groups were instructed on reaching a 10,000 step goal using their Fitbit One® activity monitor. The Fitbit® served as both an
intervention component (as a self-monitoring tool), as well as an assessment tool for measuring physical activity. For incentives to enhance participation and goal
achievement, small incentives were awarded to the individual in each group with the highest number of steps for each month of the study. Additionally, all individuals who reached the goal of averaging at least 10,000 steps a day for a given month received an award.
Outcome Measures
Variables were assessed at baseline and again after six months at the end-of-study follow-up. Demographics, descriptive characteristics, and health history were obtained at baseline using standard questionnaires from previous studies. Demographic variables of interest included gender, age, race, and education. The primary outcome measures for this study were BMI, daily step counts and sedentary time as measured by the Fitbit® activity monitor. Secondary outcomes included the results from three psychosocial surveys. Testing at baseline and 6 months was obtained at the Clinical Research Center for the Department of Health and Exercise Science.
Physical Outcomes
1. Body weight and height were assessed using standard techniques. Outer garments
36
Psychosocial Outcomes
1. Satisfaction with life was measured using the Satisfaction with Life Scale (SWLS). This 5 item questionnaire utilizes a 7 point Likert scale that is anchored by the terms 7=Strongly Agree, 4=neither agree nor disagree, and 1=Strongly Disagree 52.
2. State-Strait Anxiety Inventory (STAI), a widely used inventory consisting of two, 20-item self-report scales, was used to assess state anxiety and trait anxiety53. Responses for the S-Anxiety scale assess intensity of current feelings “at this moment”: 1) not at all, 2)
somewhat, 3) moderately so, and 4) very much so. Responses for the T-Anxiety scale assess frequency of feelings “in general”: 1) almost never, 2) sometimes, 3) often, and 4) almost always.54
3. Health-related quality of life was assessed by the Medical Outcomes Short Form-3655. This survey measures global quality of life with 8 subscales in physical functioning, role-physical, bodily pain, general health, vitality, social functioning, role-emotional, and mental health. The SF-36 consists of 8 scaled scores, representing weighted sums of the questions in each subscale section.
Health Behaviors
1. Physical activity was monitored using the output from the Fitbit One® activity monitor. Measurement included number of steps, minutes of sedentary activity, and distance traveled. 2. Sleep patterns were obtained through the Pittsburgh Sleep Quality Index. The Pittsburgh
37
efficiency, sleep disturbances, use of sleeping medication, and daytime dysfunction. Scores are then summed from these seven components to provide one global score56
Data Analysis
Pre- and post- activity level data were gathered by isolating and collecting the first and last seven days of each study participant. The data analysis began the day after the first activity information was recorded, and ended the day before the last activity information was recorded. Eliminating the first and last day ensured the data were only used from whole study days. Using this method average activity levels were compared using a one-way ANOVA among the three groups for seven days at the beginning and seven days at the end of the six month intervention period. Variables such as steps and sedentary behavior were analyzed using a repeated ANOVA.
Activity level Data Collection Process
1. Eliminate any partial data collection days (steps < 500) 2. Isolate first 8 days for all study subjects
3. Eliminate first day leaving 7 days for baseline (BL) analysis variables 4. Isolate last 8 days for all study subjects
5. Eliminate last day leaving 7 days for follow up (FU) analysis variables 6. Calculate change variables by subtracting FU from BL
7. Calculate percent change variables by (6-months’ results minus baseline)/baseline x100) Statistical Analyses were performed using SPSS 23.0 software (Statistical Packages for the Social Scientist). Descriptive statistics were calculated and these values were reported as means ± standard deviations (SD). Group means at baseline and follow up were recorded. The
38
39
CHAPTER 4: RESULTS
40
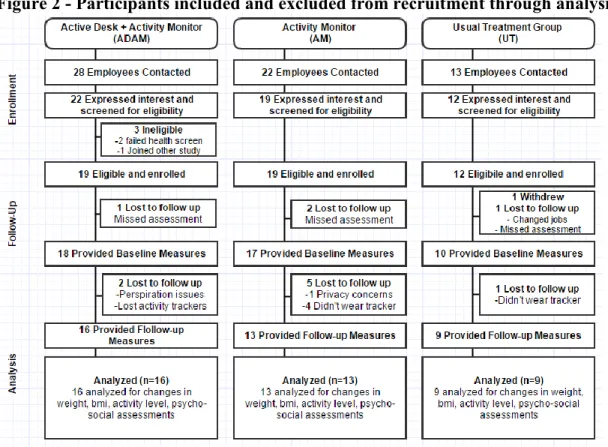
Figure 2 - Participants included and excluded from recruitment through analysis
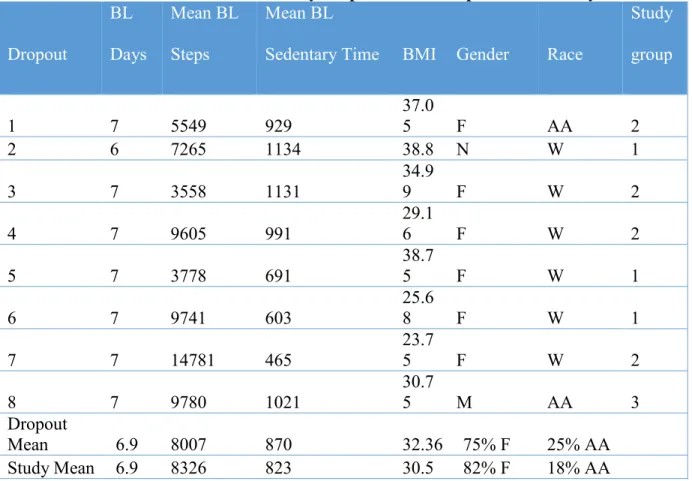
Participation data are summarized in (Figure 2). Of the 47 recruited, 44 reported complete baseline data including at least 4 days of activity data within the first two weeks studied. Three subjects did not have a record of activity during the baseline period - AM group (N=2) and Usual Treatment group (N=1). Of the 44 participants that completed baseline measures 35 reported at least 4 days of physical activity at six months with a total of 8 participants lost to follow up. Reasons for dropouts were reported as complications with increased perspiration in the
41
sedentary time at baseline, weight, gender and race are very similar to the characteristics of the entire study population, suggesting there was not differential dropout.
Table 4 - Baseline characteristics of study dropouts with comparisons to study mean.
Dropout BL Days Mean BL Steps Mean BL
Sedentary Time BMI Gender Race
Study
group
1 7 5549 929
37.0
5 F AA 2
2 6 7265 1134 38.8 N W 1
3 7 3558 1131
34.9
9 F W 2
4 7 9605 991 29.16 F W 2
5 7 3778 691 38.75 F W 1
6 7 9741 603
25.6
8 F W 1
7 7 14781 465
23.7
5 F W 2
8 7 9780 1021
30.7
5 M AA 3
Dropout
Mean 6.9 8007 870 32.36 75% F 25% AA
42
Activity Levels - Steps
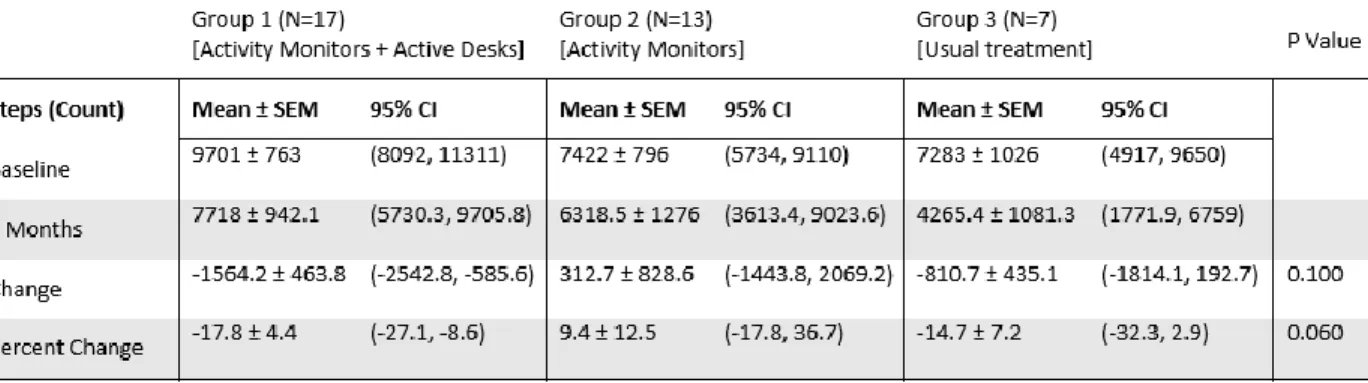
Differences from baseline to follow up for all 3 groups are shown in (Table 5) which displays data reported from activity monitors worn by study subjects for seven days at the beginning and the end of the six month observation period. Data within each activity outcome show the daily average across seven days at baseline and at six months. The change and percent change are calculated for each category. Statistical analysis was performed on change and percent change. The ADAM group showed a mean decrease in daily steps of -1564 steps while the AM showed a mean increase in daily step counts at follow up of 312 steps. The UT group showed a mean daily decrease in step counts from baseline of -810 steps. The change in step counts from baseline to follow up were not significant among the three groups. However, there was a strong trend for differences among the three groups in percent change in steps (ADAM, -17%; AM, 9%; and UT, -15%; p=.060). These results do not support the hypothesis as it was proposed that ADAM would have greater increases in steps compared to AM and UT at follow-up.
Table 5 - Steps at baseline and follow up for 3 groups
43
while the step counts reported in (Table 5) are seven-day means recorded by all 3 groups at 0 and 6 months.
When comparing the two groups with continuously recorded activity data (ADAM and AM), the mean daily step counts of the ADAM group were higher at all time points, except month 3. A significant difference (p=.017) was observed at baseline with the ADAM logging 2,596 more mean steps group than the AM group.
44
Activity Levels - Sedentary Time
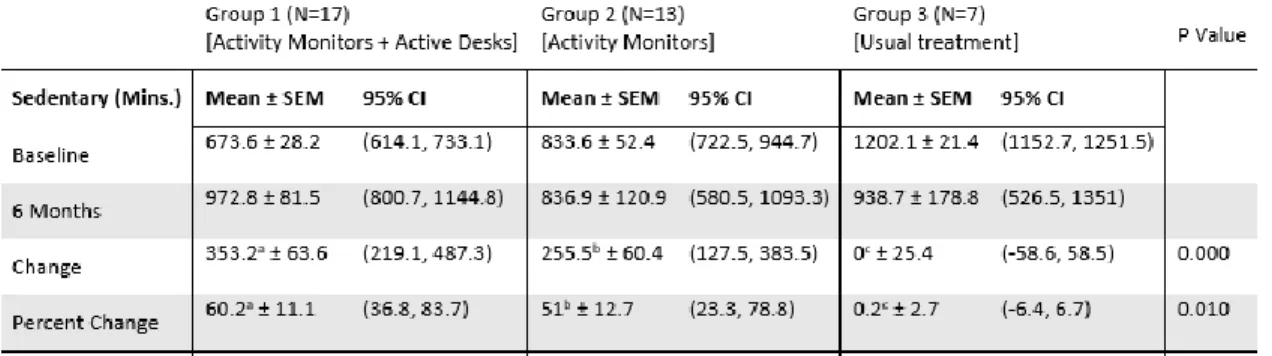
When comparing the difference in minutes of sedentary time from baseline to follow up
differences among the three groups (Table 6), an unexpected increase in sedentary time (change and percent change) was seen between baseline and 6-months for both the ADAM group
(p=.001) and the AM group (p=.012) as compared to the UT group. There was a 353.2 minute increase in sedentary minutes by the ADAM group as compared to no increase in sedentary time by the UT group. This increase in sedentary time was contrary to our hypothesis that the ADAM group would reduce sedentary time beyond sedentary time recorded in the UT group.
Table 6 - Sedentary minutes at baseline and follow up for 3 groups
45
Figure 4 - Group monthly mean sedentary minutes
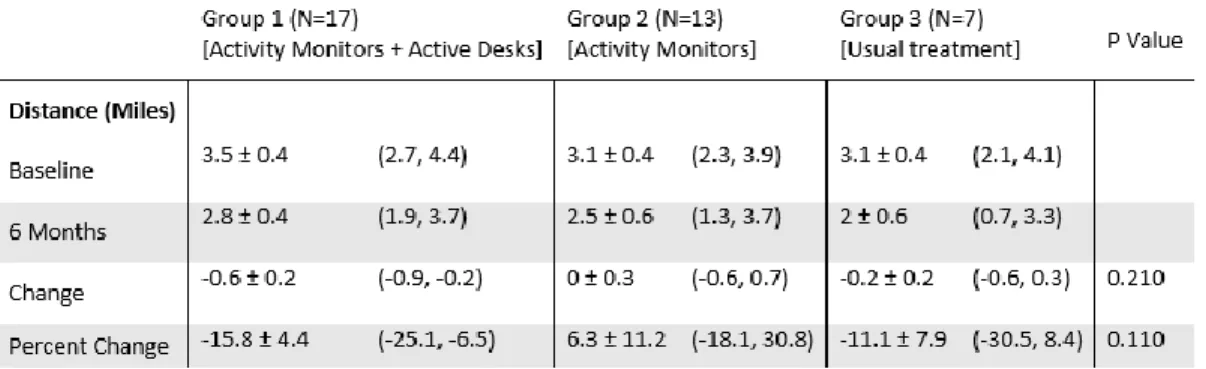
Activity Levels - Distance
46
Table 7 - Distance at baseline and follow up for 3 groups
Weight
No significant changes were observed in weight or BMI among any of the three groups among the overweight and obese (BMI ≥25 kg/m2, N=37) participants. This result is in contrast to our hypothesis that both the ADAM and AM groups would show more weight loss than the usual treatment group among the overweight and obese. There was also no evidence to support the hypothesis that those with a BMI ≥25 kg/m2 in the ADAM group would show a greater change or percent change in weight loss than in the AM group (Table 8).
47
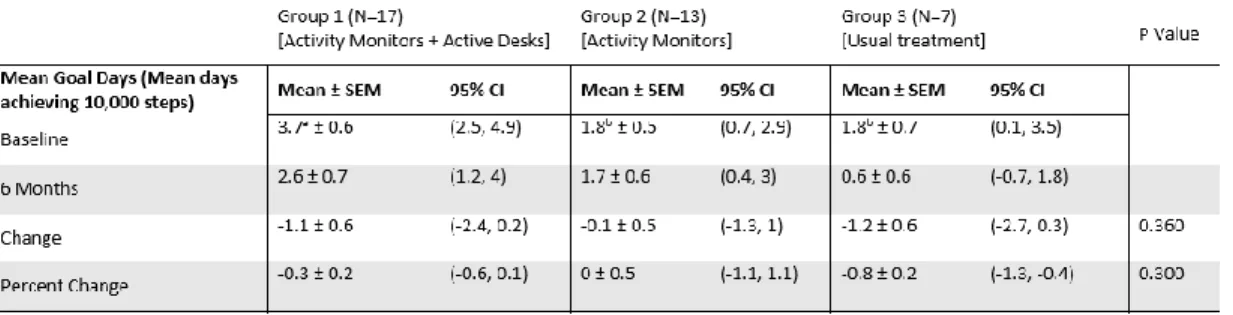
Pre/post Goal Achievement
Shape Up America59, a non-profit founded by Surgeon General C. Everett Koop is one of many programs which challenge users to make 10,000 steps per day as a fitness goal. To analyze performance on achievement of the 10,000 step benchmark, a goal day for an individual was counted for each day with at least 10,000 steps, of the 7 days analyzed at baseline and 6-month data collection period. Primary outcome variables change and percent change of mean goal days were not significantly different among the groups (Table 9).
Table 9 - Mean goal days at baseline and follow up for 3 groups
48
Figure 5 - Mean weekly group goal achievement
Monthly Group Goal Achievement
In examining the level of goal achievement for the two groups that provided daily activity data throughout the study, a Monthly Group Goal Mean (MGGM) was calculated. This number represents the ratio of number of days recorded to number of days where a goal was achieved.
Calculating Monthly Group Goal Means (MGGM)
1. For each user, count Month Days (MD) in given month where steps were reported. 2. For each user, count Goal Days (GD) in the given month with > 10,000 steps 3. Divide GD/MD to calculate Individual Monthly Goal Ratio (IMGR).
49
Example: In month 1, the ADAM group recorded goal days for nearly half (53%) of all days recorded in that month. The ADAM group recorded significantly higher MGGM in month 0 vs. AM group: 62% (ADAM) vs. 27% (AM), (p=.004) and a trend at month 1: 53% (ADAM) vs. 30% (AM) (p=.053) (Figure 6).
50
Self-perceptions of Health
All participants were asked to complete the Rand Medical Outcomes Short Form 36 item health survey at baseline and follow up. Scores were grouped into 8 categories using the grading methodology prescribed in the validated survey.60 Scores are presented below (Table 10)
51
54
Sleep
55
Table 11 - Mean scores on pre/post psycho-social self-assessments
56
57
Adherence and Retention
ADAM used active desks as part of their wellness intervention. The reservation data from study participant’s use of the active desks is a measure of adherence and sustainability to this
intervention. Participants were asked to reserve active desks in advance in 30 minute time slots. Additionally, users were instructed to return to the reservation system after using the equipment and log their time, mileage and speed after each session. Location A (n=16 participants) had two bikes and one treadmill. Location B had a single treadmill (n=2 participants). Location A
gathered 784 reservations for the treadmill, 422 reservations for bike desk 1, and 257 reservations for bike desk 2. Location B recorded 39 uses of the treadmill desk. Speed was marked in miles per hour. Mean speeds recorded were 3 and 2 MPH for each treadmill and 11 and 12 MPH for the two Bikes.
58
Figure 7 - Active desk reservations by desk
59
Table 12 - Activity monitor adherence throughout 210 day study
Subject Study Arm Total
Days Reported
Monitor Adherence (of 210 days)
1 ADAM 205 98%
2 ADAM 204 97%
3 ADAM 201 96%
4 ADAM 200 95%
5 ADAM 200 95%
6 ADAM 199 95%
7 ADAM 199 95%
8 ADAM 197 94%
9 ADAM 196 93%
10 ADAM 196 93%
11 ADAM 192 91%
12 ADAM 189 90%
13 ADAM 186 89%
14 ADAM 177 84%
15 ADAM 124 59%
16 ADAM 103 49%
17 ADAM 70 33%
18 AM 205 98%
19 AM 201 96%
20 AM 199 95%
21 AM 198 94%
22 AM 188 90%
23 AM 187 89%
24 AM 187 89%
25 AM 187 89%
26 AM 186 89%
27 AM 182 87%
28 AM 179 85%
29 AM 163 78%
30 AM 120 57%
31 AM 120 57%
32 AM 112 53%
ADAM/AM
Average: 177 84%
ADAM: 179 85%