Variation in the structure and performance of Community Care of North Carolina
Jennifer King
A dissertation submitted to the faculty of the University of North Carolina at Chapel Hill in partial fulfillment of the requirements for the degree of Doctor of Philosophy
in the Department of Health Policy and Management.
Chapel Hill 2011
iii ABSTRACT
Jennifer King: Variation in the structure and performance of Community Care of North Carolina (Under the direction of Thomas C. Ricketts, PhD)
Current models of health care delivery system reform place high expectations on primary care practices to drive improvements in the U.S. medical care system. There are concerns that not all practices are equipped to meet these expectations, especially given the wide variation in structural attributes of practices across the country. In response to these concerns, local community networks have been proposed to help diverse practices implement new models of care. Community Care of North Carolina (CCNC), a statewide program of 14 community-based care networks for Medicaid enrollees, is often cited as a successful example of this approach.
This dissertation studied the extent of variation in health care quality and utilization within CCNC and examined whether traditional associations between practice attributes and performance were present in this mature community network program. Performance was measured by four process and five utilization measures for two patient populations -- adults with diabetes and children with acute asthma -- using Medicaid claims from 2008. Key practice attributes included organization type, size, affiliation with a major health system, number of CCNC patients, and length of CCNC experience.
There was systematic variation in performance between practices within the CCNC program. Bringing all practices up to the level of performance at the best practices would result in meaningful gains in overall performance.
iv
measures, one process and two utilization measures. The impact of practice size on utilization was strongest among practices with relatively little CCNC experience; that is, the modest association between practice size and performance was moderated by length of CCNC experience.
Findings from this dissertation suggest local community network infrastructures may be a viable policy option for mitigating the impact of certain practice structural attributes on primary care
performance. Yet, within one such program, performance continued to vary between practices and there was room for improvement in performance overall. Identifying factors driving variation and
v
ACKNOWLEDGEMENTS Thank you to:
My committee, for providing thoughtful guidance and asking hard questions. Tom Ricketts for being a mentor and champion, for setting an example of engaging in research that matters and
consistently challenging me to do the same. Mark Holmes for many hours spent sharing his expertise and creativity, never hesitating to review one more thing, and keeping things fun. Sandra Greene for
invaluable assistance acquiring and using the data and providing insightful, practical direction. Rebecca Wells for thoughtful feedback and the wise lesson that “it would be interesting” is not a sufficient reason. Annette Dubard for providing insight from the field and helping to keep this project grounded.
Those at the Sheps Center who provided me a home base and served as mentors, teachers, colleagues, and friends, especially Erin Fraher and Becky Slifkin. Tim Carey and the NRSA program, faculty and peers, for providing funding and a forum for testing ideas. Stephanie Poley, for a lifeline of coffee and camaraderie.
Stephanie Pierson and Carol Porter for expert programming assistance. Katie Gaul and Jessica Carpenter for help with the licensure data and geocoding. Shelley Keir and Tammy Hogan for assistance with the CCNC program data.
vi
TABLE OF CONTENTS
Chapter 1. Introduction and study overview ... 1
Introduction ... 1
Study overview ... 5
Chapter 2. Literature review, conceptual framework, and hypotheses ... 6
Conceptual and empirical literature ... 6
Conceptual framework and hypotheses ... 13
Chapter 3. Data and measures ... 15
Data ... 15
Measures ... 18
Chapter 4. Description of CCNC patients, practices, and networks ... 24
Characteristics of the CCNC patient analysis population ... 24
Characteristics of CCNC practices ... 24
Characteristics of CCNC networks ... 26
Discussion ... 28
Chapter 5: How much does CCNC performance vary and do observed characteristics explain this variation? ... 29
Introduction ... 29
Methods ... 30
Results ... 35
vii
Chapter 6: Do traditional associations between practice characteristics and primary care performance
persist within CCNC? ... 42
Introduction ... 42
Methods ... 42
Results ... 49
Discussion ... 55
Chapter 7: Conclusion ... 58
Synthesis of findings ... 58
Limitations and directions for future research ... 62
Implications ... 64
Tables and figures ... 67
Chapter 1 ... 67
Chapter 2 ... 68
Chapter 4 ... 69
Chapter 5 ... 78
Chapter 6 ... 86
Appendix 1. Quantifying and characterizing primary care practices ... 94
viii LIST OF TABLES
Table 4.1 Characteristics of CCNC analysis population ... 69
Table 4.2 Organization type and size of CCNC practice sites ... 70
Table 4.3 CCNC scale among CCNC practice sites ... 71
Table 4.4 CCNC experience and timing of CCNC adoption among CCNC practice sites ... 72
Table 4.5 Specialty of primary care physicians at CCNC practice sites ... 72
Table 4.6 CCNC networks according to organization type and size of CCNC practice sites within the network ... 74
Table 4.7 CCNC networks according to organization type and affiliation of CCNC practice sites within the network ... 75
Table 4.8 CCNC networks according to CCNC experience of CCNC practice sites within the network .. 76
Table 4.9 CCNC networks according to CCNC scale of CCNC practice sites within the network ... 77
Table 5.1 Characteristics of the patient analysis population ... 78
Table 5.2 Overall unadjusted CCNC performance rates ... 79
Table 5.3 Unadjusted measures of between- and within-network variation in CCNC performance ... 81
Table 5.4 Adjusted measures of between- and within-network variation in CCNC performance ... 82
Table 5.5 Association between network characteristics and performance from logistic regression of performance measures with significant between-network variation ... 83
Table 5.6 Potential reduction in missed care and adverse events obtained by reducing between-practice variation ... 83
Table 5.7 Adjusted potential reduction in missed care and adverse events obtained by reducing between-practice variation, by network ... 84
Table 6.1 Characteristics of the analysis population ... 86
Table 6.2 Bivariate associations between practice characteristics and CCNC performance ... 87
Table 6.3 Logistic regression of CCNC performance ... 88
Table 6.4 Odds ratios describing association between CCNC performance and practice type, affiliation, and size ... 90
ix
Table 6.6 Incremental effects of 1000 person increase in CCNC scale on CCNC performance ... 92
Table 6.7 Odds ratios describing association between CCNC performance and practice type, affiliation, and size by CCNC experience ... 93
Table A1. Business locations of NC primary care physicians ... 102
Table A2. Unique practice sites reported as business locations of NC primary care physicians ... 102
Table A3. NC Medicaid participation options for health care providers ... 102
Table A4. Match between CCNC and Carolina Access I practice sites and practice sites identified as business locations by NC primary care physicians ... 103
Table A5. Match between practice sites identified as business locations by NC primary care physicians and CCNC and Carolina Access I practice sites ... 104
x LIST OF FIGURES
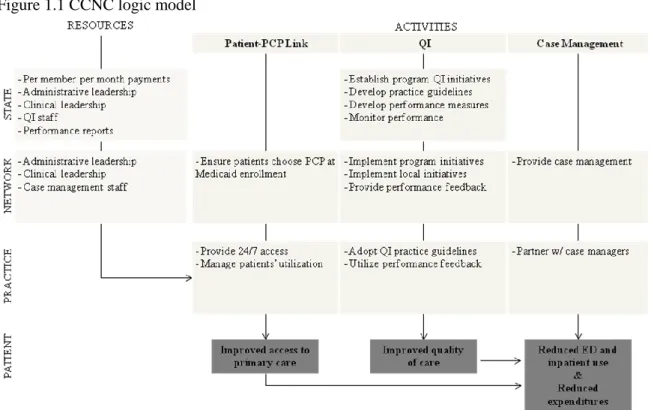
Figure 1.1 CCNC logic model ... 67
Figure 2.1 Conceptual model of factors influencing primary care practice performance ... 68
Figure 2.2 Conceptual model of factors influencing CCNC performance ... 68
Figure 4.1 CCNC patients and analysis population ... 69
Figure 4.2 Size and metropolitan status of CCNC networks ... 73
Figure 5.1 Overall unadjusted CCNC performance rates ... 80
CHAPTER 1. INTRODUCTION AND STUDY OVERVIEW Introduction
The central role of primary care practices in delivery system reform
The U.S. medical care system often fails to deliver high quality, coordinated care. Problemswith underuse of recommended care, overuse of high-risk procedures or other supply-sensitive services, and medical errors that lead to avoidable complications are well documented 1. These issues are particularly problematic for individuals with chronic illnesses. Many patients with chronic conditions receive more care than is medically beneficial or preferred by patients 2. On the other hand, patients with chronic conditions often fail to receive potentially beneficial care nearly half of the time 3. One major driver of these problems is the lack of coordination across health care settings and other community resources 4, 5, something that is especially important for patients from disadvantaged socioeconomic groups.
2
While the general principles of these models have wide support, there are concerns about whether all primary care practices are equipped to play such sweeping roles, with particular concerns for the small, independent practices in which the majority of primary care physicians currently work.7, 8 This hesitation is supported by decades of empirical health services research on variations in health care access, quality, outcomes, and cost as well as the conceptual work that underpins much of this research. Discussed in detail in Chapter 2, existing empirical and conceptual work highlights that factors at multiple levels influence health care access, quality, and resource use, and that practices experience different levels of performance according to attributes such as size, affiliation, payer mix, local supply of medical resources, and community socioeconomic characteristics.
Community care networks
Local networks or “community care teams” have been proposed to support diverse practices in overcoming traditional barriers and successfully implementing new models of care delivery.9-11 Proponents have described these ideas in general terms as community-based teams that would: provide small, local primary care practices with access to case managers, social workers, and other public health professionals; connect primary care practices and patients to existing community resources and social supports; and assist primary care practices in quality improvement initiatives.10 Such local networks or community teams could be one component of the medical or health “neighborhoods” that many
stakeholders consider critical to realizing improvements to the primary care delivery system.12, 13
3
services for enrollees with specific chronic conditions and other high cost or high risk populations. These activities are expected to lead to improved access to primary care, improved adherence to guideline recommended care for targeted chronic conditions, reduced use of emergency and inpatient care, and reduced Medicaid costs (Figure 1.1). CCNC monitors performance through reviews of claims data and annual chart audits.
Within broad parameters set at the state level, 14 regional networks implement most program activities. These networks are non-profit entities whose members include participating primary care practices, local hospitals, local public health departments, county social services offices, and potentially other community-based organizations. Provider participation in the CCNC networks is voluntary; participating providers receive enhanced monthly payments from the Medicaid program for each enrollee that is linked to the practice. In each network, a physician committee provides clinical guidance for the implementation of statewide quality improvement initiatives and may develop additional initiatives or pilot programs to address local priorities. The networks employ case managers who interact with
enrollees and primary care providers to coordinate care, provide enrollee self-management education and support, and link enrollees and providers to community resources. The networks are widely thought to enhance program effectiveness by adapting the program to local contexts and capitalizing on and strengthening relationships between network members.
4
over the study period for both CCNC and Carolina Access, with greater declines among CCNC enrollees on some measures and greater declines among Carolina Access enrollees on other measures.
Another study examined the effect of CCNC on utilization and expenditures for children with asthma in one of the CCNC networks, using claims data from 1998 and 2001 and comparing children in one CCNC network to children statewide who were in Carolina Access or fee-for-service Medicaid.18 After statistically adjusting for enrollee selection into the programs, relative to fee-for-service, CCNC and Carolina Access were associated with substantial reductions in emergency department and hospital use and substantial increases in use of asthma maintenance medications. The gains associated with CCNC were greater than those associated with Carolina Access. However, the study did not find evidence of cost savings: total spending per enrollee increased in CCNC and Carolina Access relative to fee-for-services, while spending for claims with an asthma diagnosis only were the same in all three programs.
These studies along with internal performance tracking by the CCNC program and substantial anecdotal evidence support the widespread view that CCNC has been successful in achieving at least some program goals.
Beyond this early evidence regarding CCNC, however, there is limited information about the effectiveness of using community-based networks to support diverse primary care practices in delivering high quality and efficient primary care. To some extent, the approach is being tested elsewhere. For example, three communities in Vermont are testing a medical home program that uses interdisciplinary “community care teams” to support physician practices and link patients to community resources as part of the state‟s Blueprint for Health reforms.19
5
Care Act.21 Nonetheless, to date, there is little empirical evidence on how these community network approaches may work if implemented beyond pilot stages across a wide range of practice settings.
CCNC presents a rich opportunity to expand knowledge of how mature community care network programs may work across diverse practice settings. To date there has been no comprehensive
description of the primary care practices that participate in CCNC. Moreover, there has been little study of whether CCNC performance varies systematically within the program according to practice or network characteristics. One of the early studies found substantial variation in per member month expenditures among counties with large numbers of asthma and diabetes patients, but did not examine potential reasons for this variation.17 Understanding the extent and drivers of variation in CCNC performance in the program‟s more established stages would provide valuable insight on the potential for similar community care network programs to support diverse practices in achieving delivery system improvements. Study overview
This dissertation examines the structure and performance of CCNC networks and participating practices. To measure CCNC performance, I focused on process of care quality measures and potentially preventable utilization for two patient populations, children with acute asthma and adults with diabetes. These conditions are highly prevalent and they have been the target of CCNC‟s flagship disease
CHAPTER 2. LITERATURE REVIEW, CONCEPTUAL FRAMEWORK, AND HYPOTHESES Conceptual and empirical literature
Concerns about the ability of all primary care practices to successfully implement new models of care are supported by decades of empirical health services research on variations in health care access, quality, outcomes, and cost as well as the conceptual work that underpins much of this research.
Numerous conceptual models seek to explain the determinants of health system performance; two of the most influential are Andersen‟s behavioral model of access to care and Donabedian‟s model of health care quality. Several related streams of research have used Andersen‟s model of access to care to study the relationship between patient characteristics (categorized as predisposing factors, enabling factors, and need) and access to and utilization of health care services.22 Andersen gradually expanded his original model to address the importance of community and health system characteristics in
explaining variation in health care access and utilization. Later iterations of the model also addressed the effectiveness and efficiency of health care utilization as measured by health status and patient
satisfaction.23 Donabedian‟s model of health care quality has guided researchers in assessing the relationship between structural attributes of medical care organizations and health care processes and outcomes.24 In this model, structure is viewed as the physical and organizational characteristics of the settings in which medical care is delivered that influence the ability to provide high quality care processes and achieve desired outcomes.
7
Drawing on these models, the conceptual framework below illustrates the interrelated factors that may influence the performance of primary care practices (Figure 2.1). An individual patient experiences processes and outcomes of health care; as such, patient-level factors should play an important role in the care received and its outcomes. These health care processes occur in the primary care practice, and both processes and their outcomes likely are affected by practice-level factors, including structural attributes. Finally, patients and primary care practices are situated within a broader community context that can influence the structure and activities of primary care practices along with the patient-level outcomes of health care utilization.
There is substantial empirical evidence that factors at the practice, community, and patient levels contribute to variation in health system performance.
Practice characteristics
Past empirical research has examined the relationship between structural attributes of physician practices and their ability to provide and coordinate high quality care; in particular, practice size and affiliation have been studied extensively and in general are thought to be positive attributes.26
Many studies have focused on the relationship between practice size and affiliation and other structural aspects of health care quality. Most recently, a handful of studies have examined the extent to which primary care practices have the infrastructure in place to serve as patient-centered medical homes, concluding that small independent practices are less likely to have this infrastructure than larger practices or those affiliated with a larger organization.27-30{{}} More generally, other studies have found positive associations between medical group size and participation in quality improvement activities,31, 32 use of care management processes,33 and the likelihood of offering health promotion and smoking cessation programs.34, 35
8
care coordination, and office staff interactions.36 Among Medicare patients nationally, those treated by physicians in groups of three or less were less likely to receive certain recommended preventive services than those treated by physicians in larger groups.37 And among Medicare patients with acute myocardial infarction, those treated by physicians in groups of ten or more were more likely to receive recommended care and less likely to die than those treated by physicians from smaller practices, with especially
pronounced differences between solo and non-solo practitioners.38 However, the evidence is not entirely consistent: studies failed to find consistent or statistically significant relationships between practice size and preventive care measures in California39 or HEDIS quality measures in Massachusetts.40
There are particular concerns about the structural characteristics of practices that serve large numbers of Medicaid patients. Nationally, care for Medicaid patients is becoming increasingly concentrated among a subset of providers.41 Research using data on Medicare patients has found the share of a practice‟s revenue derived from Medicaid to be negatively associated with receipt of certain recommended preventive services37 and positively associated with ambulatory care sensitive
9
Some health care leaders have voiced concerns about barriers facing small practices that serve Medicaid patients in particular. In 2005, about 40% of total Medicaid revenue earned by physicians nationally went to physicians in solo or small group practices.41 A four state study designed to assist states in implementing Medicaid quality improvement interventions found somewhat varied relationships between practice size and selected performance measures for Medicaid patients. Measures of access to care for children tended to be better in smaller practices, while receipt of recommended care (specifically, A1c testing for diabetes patients and appropriate asthma medication use) tended to be better in larger practices.46
With some exceptions, existing research supports concerns that small, independent practices and practices serving high numbers of Medicaid patients may face barriers to providing and coordinating high quality care.
Communitycharacteristics
A related stream of health services research has highlighted that community characteristics also contribute to variation in health system performance and patient outcomes.
There is substantial geographic variation in health system performance as measured by resource use, quality indicators, and health outcomes. Wennberg‟s seminal work in the 1970s demonstrated substantial small area variation in physician practice patterns.47 Over the subsequent decades, the Dartmouth Atlas of Health Care and others have continued to explore geographic differences in care, documenting that areas of high resource use generally do not experience any discernable benefit in terms of quality of care or outcomes (for example see the work of Fisher and colleagues (2003)48, 49). This research has largely been based on the hypothesis of supplier-induced demand for medical care,
emphasizing that supply and makeup of health care resources are key to explaining differences in health system performance.
10
of small area variation in ambulatory care sensitive hospitalization in North Carolina found that social factors like area-level income were predictors of hospitalization rates while primary care provider supply was not.50 Many studies using individual-level data have demonstrated associations between community-level socioeconomic factors such as insurance coverage rates, unemployment, and income and a wide range of health care related outcomes, including: several measures of access to care,51, 52 patients‟ trust in physicians,51 satisfaction with care,36, 51 receipt of guideline-recommended mammography,53 early stage breast cancer diagnosis,54 and use of preventive dental care.55 This work suggests at least two causal mechanisms to explain the relationship between community factors and health system performance: (a) health care resources in lower socioeconomic status communities are stretched thin because of a relatively poor payer mix and (b) lower socioeconomic status communities tend to have higher disease burden and higher levels of health care needs, putting strain on local health care systems.
Relative importance of characteristics at different levels
Given the conceptual and empirical knowledge that factors at multiple levels affect health system performance, researchers have employed techniques such as multilevel or hierarchical regression models to quantify variation in performance and to shed light on the relative importance of different levels in explaining this variation.
Fung and colleagues recently conducted a comprehensive review of 39 studies that examined and partitioned variation in health system performance across two or more nested levels.56 One common finding across almost all studies was that most variation in performance is often attributable to the
11
attributable to the facility level ranged from 1% to 18%. Another study examined variation in asthma care across 20 physician groups in California, finding that the physician group was responsible for 3-10% of variation in process of care measures, 1-6% in outcome measures, and 10% in patient satisfaction.63
Studies such as these that describe the relative distribution of variation in performance across multiple levels of the health system can be useful in designing and monitoring quality improvement interventions. For example, understanding whether performance varies between groups at a certain level more than would be expected based on chance is an important component of determining whether that level represents a meaningful intervention target.64, 65 Beyond statistical significance and proportions of variation at different levels, however, it is important to quantify variation in clinically- or policy-relevant terms. Low relative variability at a certain level does not necessarily equate to low variability in absolute terms or low potential for improvement.66
Taken together, previously published studies examining components of variation have
demonstrated that statistically significant variation in performance exists across multiple levels of the health system and that the majority of variation in performance can usually be attributed to the individual patient level. This body of work provides useful guidance for quantifying and explaining variation in performance within CCNC.
Variation in network effectiveness
As described in Chapter 1, community care networks have been proposed as one solution to support different types of practices in overcoming traditional barriers to performance, and CCNC is often cited as a successful example of such an approach. The 14 CCNC networks historically have had
considerable flexibility in their organizational structure and activities. Differences in network structural attributes and activities may influence CCNC performance in at least two main ways.
12
partnerships, and quality improvement collaboratives, but do not fit any one of those models completely. Nonetheless, literature on these types of networks provide some guidance for characteristics that may influence how successful CCNC networks are in achieving program goals, including: network
composition and heterogeneity; range of network initiatives; financial resources; history of collaboration among network members; and processes to hold members accountable for performance.67-69
Second, the case management approaches used by some networks may be more successful than others. Lessons from the Medicare care coordination demonstration point to features of case management programs that may be important in explaining variations in CCNC performance, including: frequency of in-person contact with patients; level of interaction between case managers and primary care physicians; access to timely information on hospital and emergency room admissions; and staffing issues like case load per case manager and case manager credentials (e.g., nurse or social worker).70, 71
Anecdotally, the 14 CCNC networks differ substantially on many of these dimensions; however these network characteristics have not been systematically documented and their relationships with CCNC performance have not been studied.
In sum, the set of conceptual and empirical literature reviewed here highlights that factors at multiple levels influence health care access, quality, and resource use, and that practices experience different levels of performance according to attributes such as size, affiliation, payer mix, local supply of medical resources, and community socioeconomic characteristics. Although previous studies suggest that CCNC patients experienced better quality and utilization outcomes than other Medicaid patients during the early stages of the program, little is known about the extent of variation in performance within CCNC in its more mature stages and whether traditional relationships between practice and community
13 Conceptual framework and hypotheses
A combination of the general conceptual framework (Figure 2.1) and the CCNC logic model (Figure 1.1) provides the conceptual framework for this study (Figure 2.2).
Consistent with the design of the CCNC program, the two levels of primary interest in this study are the network and practice levels. The primary CCNC activities are coordinated and implemented by the 14 CCNC networks, and the networks are thought to differ in ways that influence the success of these activities. Therefore, I hypothesize that:
H1 Variation in CCNC performance between networks is greater than would be expected based on chance alone.
The primary CCNC activities target care processes and outcomes that take place (or fail to take place) in the primary care practice. There is a formal link between each CCNC patient and his or her primary care practice, the practice is responsible for managing and authorizing care that patients seek from other providers, and CCNC quality improvement interventions are targeted to the practice level.1 Given the central role of the primary care practice to the CCNC intervention and empirical evidence that primary care performance varies between practices, I hypothesize that:
H2 Variation in CCNC performance between practices within networks is greater than would be expected based on chance alone.
Further, several hypotheses emerge from the body of empirical evidence on the relationship between specific attributes of primary care practices and primary care performance. Four practice characteristics are of primary interest in this study: size, affiliation, scale of the CCNC intervention, and CCNC experience. Regarding practice size and affiliation, I hypothesize:
H3 Practice size is positively associated with performance.
1
Although variance components studies have shown that the individual provider can be an important source of variation in primary care performance, this study focuses on the primary care practice as a unit of interest rather than individual health care practitioners. With few exceptions, CCNC providers join the program as a practice (as detailed in Appendix 1). Other primary care delivery system reform models also emphasize the practice as the unit of interest. For example, various models envision changes that would be implemented at the practice level, such as: streamlined processes for scheduling patients; team-based care; group visits; information technology systems; and
14
H4 Health system affiliation is positively associated with performance.
At first glance, it would be reasonable to expect that the scale of the CCNC intervention at a practice (i.e., the number of CCNC patients for which a practice is responsible) is positively related to program performance. If a practice has a small number of CCNC patients, the practice may not consider it worthwhile to fully engage with the CCNC program, and CCNC practice guidelines and other
initiatives will likely have less influence over patterns of care at the practice. Moreover, practices receive a monthly case management fee for each enrolled patient--to the extent that practices invest this money in case management and quality improvement, the number of CCNC patients at the practice should have a positive relationship with performance. However, existing research suggests that practices that serve very high number of Medicaid patients can face barriers to providing high quality care. Therefore, I
hypothesize that the relationship between the scale of the CCNC intervention at the practice (that is, the number of CCNC patients for which the practice is responsible) and performance is more complex:
H5 CCNC scale has a non-monotonic relationship with performance, with a positive association that becomes negative as scale increases.
I also hypothesize that as practices gain more CCNC experience their performance will improve. Moreover, if CCNC‟s community-based network approach effectively assists diverse primary care
practices in overcoming traditional barriers to providing high quality care, I expect CCNC experience will moderate the differences in performance between different types of practices. For example, previous research in other settings suggests that practice size is positively associated with structural capabilities necessary to provide high quality care and that patients at smaller practices experience worse outcomes for some types of care. By facilitating quality improvement initiatives and providing case management and other resources at the community level, the CCNC networks are designed to address this disparity in structural resources. Therefore, I hypothesize that:
H6 CCNC experience has a positive relationship with performance.
CHAPTER 3. DATA AND MEASURES
This study utilized a new data set that linked information on CCNC networks and practices with patient-level data on health care quality and utilization. Mirroring the nature of the CCNC program, with patients nested in practices nested in CCNC networks, the data had a hierarchical structure. I compiled information on CCNC networks and practices using administrative data from the CCNC program and physician licensure data from the North Carolina Medical Board. Patient level performance measures were derived from Medicaid claims. Additional county-level data to describe the communities in which CCNC practices were located were obtained from the Area Resource File and state licensure data. All data were from calendar year 2008.
Data Patient data
Patient-level data were from Medicaid administrative claims. Analyses were conducted on two patient populations: children with acute asthma and adults with diabetes. I restricted the asthma population to children and the diabetes population to adults in order to focus on relatively homogenous patient populations and because these patient populations have been the primary targets of their respective CCNC initiatives. Individuals were included in the analysis if they were enrolled in CCNC for at least 10 months during the year and were enrolled with the same primary care practice throughout that entire period. Individuals 65 years of age or older and individuals dually eligible for Medicare and Medicaid were excluded from the analysis.
Individuals were identified as having diabetes or asthma based on the National Voluntary Consensus Standards for Ambulatory Care specifications.72 Individuals were identified as having
16
room visit with a primary diagnosis of diabetes, at least two outpatient visits with any diabetes diagnosis, or at least one insulin or oral hypogylcemics/antihyperglycemics prescription dispensing event.
Individuals were identified as having acute asthma if they met any of the following criteria during the year: at least one hospitalization or emergency room visit with a primary diagnosis of asthma, at least four outpatient visits with any asthma diagnosis and at least two asthma medication dispensing events, or at least four asthma medication dispensing events. Patients with chronic obstructive pulmonary disease or emphysema (identified by at least one emergency room visit or hospitalization or two outpatient visits with the relevant diagnoses) were excluded from the asthma population.
Practice data
Data on practices participating in CCNC were derived from two main sources: administrative licensure data on all active primary care physicians in the state and administrative information on all entities enrolled as CCNC practices.
NC primary care practices To quantify and characterize primary care practices in the state, I used physician licensure data from the North Carolina Health Professions Data System. The North Carolina Health Professions Data System is maintained by the Cecil G. Sheps Center for Health Services Research at the University of North Carolina at Chapel Hill in partnership with the North Carolina Medical Board. The Medical Board annually provides files to the Sheps Center containing information on all licensed physicians in the state. North Carolina law requires that physicians hold an active license to practice in the state, and physicians are required to renew their licenses annually. Therefore, the Health Professions Data System contains records on the universe of physicians practicing in the state. Information on specialty, practice characteristics, and demographic characteristics are self-reported by physicians when they apply for a new license and are updated when physicians apply for renewal.
17
12.3, MapInfo Corporation) was used to obtain the latitude and longitude of the street address, city, and zip code each physician reported as his or her business location. I grouped physicians according to their latitude and longitude coordinates and verified that these latitude-longitude groupings represented distinct practice sites.2 I used information from health plan directories and web searches to flag practice sites that were part of the same larger practice organization and flag practice sites that were affiliated with a major hospital system.
This process resulted in allocating the 8,346 primary care physicians in North Carolina in 2008 into a) one of 2,710 community-based practice sites, b) hospital-based practice, or c) another location type. These results are described in more detail in Appendix 1.
CCNC practices I obtained an administrative list of all entities that were enrolled as CCNC practices. This administrative list contained: practice name, address, CCNC network, date the practice enrolled in CCNC, and practice type/specialty.
To understand the extent to which the denominator of North Carolina primary care practices were participating in CCNC and to describe characteristics of primary care physicians at CCNC practices, I merged this file of CCNC practices with the file of all sites reported as primary practice locations by NC primary care providers. The file of CCNC practices was geocoded and merged with information on physicians at the practice site based on latitude and longitude. The merged file was verified by hand to ensure all matches were correct. There were some entities that appeared in the list of CCNC practices but did not appear as the business location of a primary care physician in the Health Professions Data System; I investigated these cases to determine whether they were satellite sites of practices that did appear in the Health Professions Data System. The results of this match are described in detail in Appendix 1.
2
18 County data
I obtained county-level information on socioeconomic and health system characteristics from the 2009 Area Resource File. County-level information on physician supply and specialty was obtained from the North Carolina Health Professions Data System.
Network data
I obtained information on characteristics of the 14 CCNC networks from publicly available descriptions of the CCNC program. I also characterized the networks using aggregations of lower-level data on the practices and patients within the network.
Measures
Patient-level measures
19
values of one and a very small portion having values greater than one.3 Therefore, I modeled these measures as dichotomous variables indicating any emergency room use or inpatient hospitalization (hospital use) during the year.
Other patient characteristics I obtained information on patient age and gender from the Medicaid enrollment files.
To measure patients‟ underlying health status, I used an adapted version of the Charlson
comorbidity index. The Charlson index was originally derived from inpatient medical records with the purpose of predicting one-year mortality after hospitalization. Deyo and colleagues adapted this index for use with administrative inpatient data employing ICD-9 diagnosis codes; Quan and colleagues have subsequently refined these coding algorithms.73, 74 I used this refined set of ICD-9 codes to identify comorbidities in the asthma and diabetes patient populations. Because relying solely on inpatient data may miss information on comorbidities for the vast majority of individuals who do not have a
hospitalization in a given year,75 I took into account claims from inpatient stays as well as emergency room visits and outpatient visits in creating the comorbidity index (for outpatient claims, I required the diagnosis code to appear for at least two different visits during the year). In the diabetes-specific analyses I excluded the diabetes categories from the index, and I excluded the chronic pulmonary disease category (which includes asthma) from the index in the asthma-specific analyses.
Practice-level measures
Key independent variables There were five practice characteristics of interest in this study: organization type, size, affiliation with major hospital system, CCNC scale, and CCNC experience.
Organization type was measured in two categories: institutional/specialty practices and
community-based primary care practices. The institutional/specialty category included community health centers, county public health departments, hospital-based clinics, and non-primary care specialty
3 Among asthma patients, 2.8% had more than one emergency room visit and 0.3% had more than one
20
practices. The remaining practices were coded as community-based primary care practices. All of the institutional sub-categories are presented in the descriptive statistics in Chapter 4 and in some of the multivariate analyses in Chapters 6.
Community-based primary care practices were further categorized based on size. I used five categories based on the number of primary care physicians at the practice: one, two, three to five, six to ten, and 11 or more. These categories were based partly on distinctions found to be important in previous studies (e.g., some previous studies have found an important distinction between solo practitioners and practices of other sizes38) and partly on visual inspection of natural breaks in the distribution of patients across practice sizes. All categories are presented in the descriptive statistics in Chapter 4. In the
multivariate analyses, specification tests showed that it was appropriate to collapse the two physicians and three to five physicians categories into one category for practices with two to five physicians. This specification is used for the analyses presented in Chapter 5 and Chapter 6.
The community-based primary care practices were also characterized as affiliated with a major hospital system if they were affiliated with one of the four university health systems or two other major hospital systems in the state.4
CCNC scale was measured as the number of unique CCNC patients that the practice was
responsible for at any point during the year. I also created measures of CCNC scale calculated as a) the total number of CCNC patient-months at the practice and b) the average number of CCNC patients enrolled in a month at the practice. These two alternate measures were very highly correlated with the number of unique CCNC patients measure (r=.99) and model fit, measured by Akaike‟s information criterion statistic (AIC), was very similar across alternate measures of scale. The results presented in subsequent chapters focus on the number of unique patients the practice was ever responsible for during
4 The four university health systems were: Duke University Health System, University Health Systems of
21
the year. In the multivariate analyses, I modeled CCNC scale in the quadratic form to allow for a non-monotonic association between scale and performance.
CCNC experience was the number of years the practice had been enrolled in CCNC (calculated as 2008 minus enrollment year), which ranged from zero to ten. For the multivariate analyses, I tested alternate specifications of CCNC experience as a spline with knots at two years and five years, as the log of years, and as a quadratic. The AIC from models with alternate specifications were very similar; I proceeded with the linear specification for simplicity.
Other practice characteristics I also created categorical measures of the specialties of the primary care physicians at each practice. To describe CCNC practices in general, I categorized practices as all family medicine, all internal medicine, all pediatrics, all obstetrics/gynecology, or a mix of at least two of those specialties. Because the specialties of physicians caring for the pediatric asthma population and adult diabetes population differ substantially, I created specialty measures specific to each population for the analyses focused on practice characteristics and performance in Chapter 6. For the pediatric asthma population, practices were categorized as: (a) all pediatrics, (b) mix of pediatrics and other primary care specialties, (c) no pediatrics but at least one family medicine, and (d) no pediatrics or family medicine (i.e., all internal medicine and/or obstetrics/gynecology). For the adult diabetes population, practices were categorized as: (a) all family medicine, (b) all internal medicine, (c) mix of primary care specialties including at least one family medicine or internal medicine, and (d) no family medicine or internal medicine (i.e., all obstetrics/gynecology and/or pediatrics).
Finally, I calculated a measure of practices‟ CCNC adoption timing -- that is, how long the practice waited to join CCNC after having the opportunity to do so. This measure was equal to the year CCNC entered the practice‟s county subtracted from the year the practice joined CCNC (this measure and the rationale behind it is discussed in detail in Chapter 6).
22
main analyses, I measured practice size and specialty mix at this larger practice level and measured CCNC scale and CCNC experience at the lower practice site level. In a small number of cases, individual physicians at the same practice site were enrolled as CCNC providers individually (see Appendix 1). For the main analyses, I collapsed these individual providers into their practice. I conducted sensitivity analyses with practice characteristics measured at alternate levels, as detailed in Chapter 6.
Missing data As described in more detail in Appendix 1, some CCNC community-based practice sites were not identified as the business location of any primary care physicians in the licensure data. It was not possible to measure practice size or specialty mix for these practices. These practices were coded as “unknown” and included in the descriptive analyses presented in Chapter 4 and in the analyses of between-practice variation presented in Chapter 5. In the analyses of the relationships between specific practice characteristics and CCNC performance presented in Chapter 6, I used complete case analysis and omitted patients at practices with unknown size and specialty from the analysis (529 patients from the adult diabetes population (five percent) and 528 patients from the pediatric acute asthma population (two percent)).
County-level measures
I measured county-level socioeconomic and health system characteristics that previously have been shown to influence primary care performance. Specifically, I measured poverty (percent population below federal poverty line), unemployment (percent of the civilian labor force over age 16 unemployed), metropolitan statistical area status (metropolitan, micropolitan, or neither), and health care supply and composition (number of short-term general hospital beds per 10,000 people, number of physicians per 10,000 people and percent of physicians that were primary care physicians).
Network-level measures
23
number of patients in the network. I used two measures of age: the year in which the network was initially formed and the year in which the network acquired the bulk of its member practices (defined as 75% of the practices that were participating in 2008). For example, consider a network that was formed in 2000 and had 100 participating practices in 2008, 75 of which had joined the network by 2005. The value for the first age measure would be 2000 and the value for the latter age measure would be 2005. Finally, I described the composition of each network‟s practices according to the four main practice characteristics of interest and the distribution of each network‟s patients across these types of practices.
As detailed in Chapter 2, anecdotally the 14 CCNC networks differ on several other dimensions that may influence performance. Given the lack of previous systematic study of the importance of the 14 networks in explaining variation in overall CCNC performance, this study focused on network
CHAPTER 4. DESCRIPTION OF CCNC PATIENTS, PRACTICES, AND NETWORKS
Characteristics of the CCNC patient analysis population
Over one million Medicaid patients were enrolled in CCNC at some point during 2008 (Figure 4.1). (This figure excludes Medicaid patients age 65 or older and other Medicaid patients also enrolled in Medicare; the total number of individuals ever enrolled in CCNC during the year is likely slightly higher). Just over half of these patients were enrolled with CCNC for at least ten months during the year, and about 90% of these patients were enrolled with same practice during that entire time. Thus, about half a million patients (521,025) met the analysis population criteria of being between younger than age 65, not being enrolled in Medicare, being enrolled in CCNC for at least ten months during 2008 and being enrolled at the same CCNC practice the entire time. Of these patients, 11,505 were adults identified as having diabetes and 30,221 were children identified as having acute asthma.
The median age in the adult diabetes population was 51 and the median age in the pediatric asthma population was seven (Table 4.1). As measured by the adapted Charlson comorbidity index, the pediatric asthma population was quite healthy: 99.1% had a comorbidity index score of zero. The adult diabetes population had more comorbidities but was also fairly healthy: 16.3% had a comorbidity index of one and 13.8% had a score of two or higher.
Characteristics of CCNC practices
25 Practice type and size
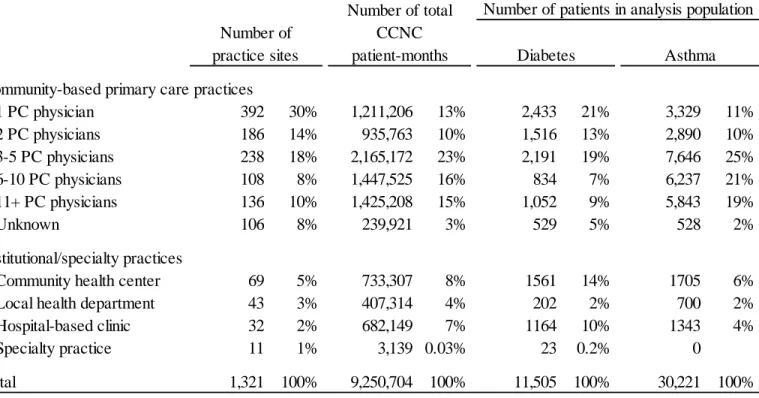
The vast majority of practice sites (88%) were community-based primary care practices (Table 4.2). Community health centers, local health departments, hospital-based clinics, and specialty practices collectively accounted for 12% of CCNC practice sites.
Many of the CCNC practice sites were small primary care practices. Forty-four percent of CCNC practice sites had one or two primary care physicians reporting the practice as their business location; nearly one-third (30%) had just one primary care physician. These one or two physician practices
accounted for 23% of all CCNC patient-months during 2008. Compared to the overall CCNC population, adults in the diabetes analysis population were more likely to belong to small practices or institutional practices. Children with acute asthma were more likely than the overall CCNC population to belong to practices with six or more primary care physicians.
Affiliation
Fifteen percent of the CCNC practice sites were affiliated with one of the six large hospital systems in North Carolina (results not shown). These practice sites accounted for a proportionate share of patients: 12% of patients in the diabetes population and 13% of patients in the asthma population.
CCNC scale
The median practice site was responsible for 425 unique CCNC patients over the course of the year (interquartile range 158 to 985) and had 235 CCNC patients enrolled in the average month
(interquartile range 77 to 590) (Table 4.3). CCNC scale varied widely by organization type: community health centers, local health departments, and hospital-based clinics tended to be responsible for higher numbers of patients than non-institutional primary care practices.
CCNC experience and adoption timing
26
patients with diabetes were less likely to be at a practice site in the most experienced category: 53% were at a practice site with at least five years experience, compared to 65% of children with acute asthma.
The majority of practice sites (65%) joined CCNC within one year of CCNC entry into the practice‟s county; an additional five percent of practice sites were part of a CCNC network before CCNC had fully expanded into their county (Table 4.4). The remaining 30% of practice sites joined CCNC between two and ten years after CCNC entered the practice‟s county. The earliest adopters accounted for a disproportionate share of total CCNC months during 2008 (19%). Adults with diabetes were
substantially less likely to be at a practice in the earliest adopter category (4%), while one-quarter of children with acute asthma were at such a practice.
Physician specialty
All primary care specialties were represented among the subset of CCNC practice sites that were community-based primary care practices. Practices composed of family medicine physicians accounted for the largest number of practice sites (30%), but accounted for only 16% of all CCNC patient-months in 2008 (Table 4.5). While practices composed exclusively of pediatricians accounted for just 16% of practice sites, they were responsible for 40% of all CCNC patient-months.
Characteristics of CCNC networks Network size and metropolitan status
27 Network age
The CCNC program began with nine networks in 1998. The remaining five networks were created in 2002 (n=2), 2003 (n=2) and 2005 (n=1). Networks have gradually added practices since their inception. The year by which networks had acquired the bulk of their practices (at least 75% of practices that were in the network at the time of the study) ranged from 2003 to 2007 with a median of 2005 (results not shown).
Practice characteristics & distribution of patients
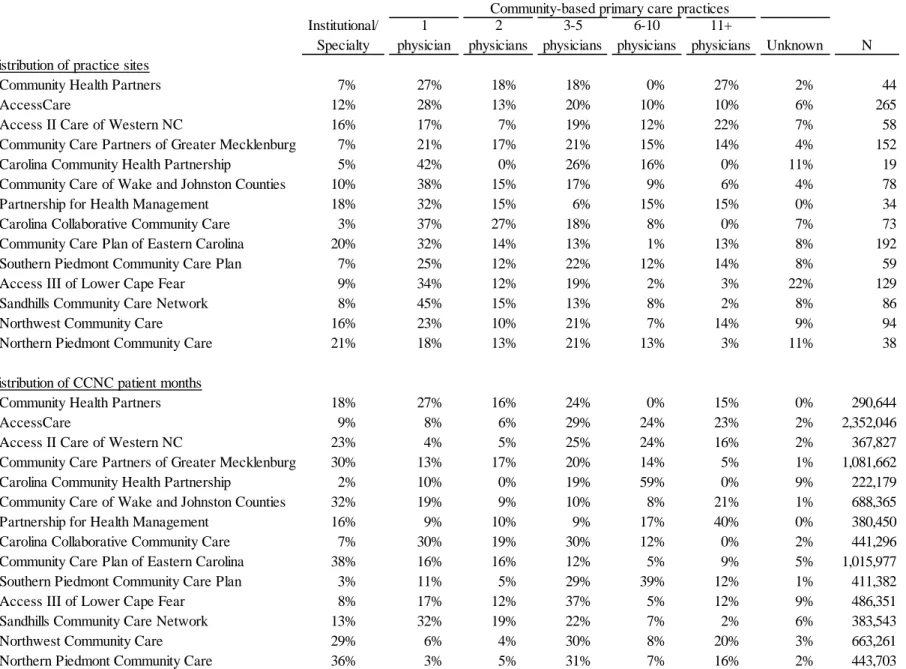
The distribution of practices in terms of characteristics hypothesized to influence CCNC
performance varied across networks; likewise, there were differences in the extent to which practices with certain characteristics were accountable for a network‟s patient population.
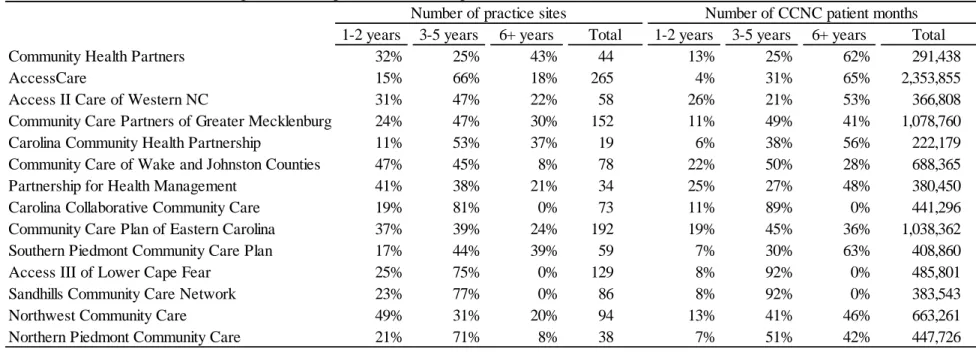
Very small practices made up a larger share of practices in some networks than in others: in three networks over half of the practice sites had one or two physicians while practices of this size accounted for less than one-third of sites in three different networks (Table 4.6). The share of total CCNC patient-months belonging to practices with just one or two physicians ranged from 8% to 50%.
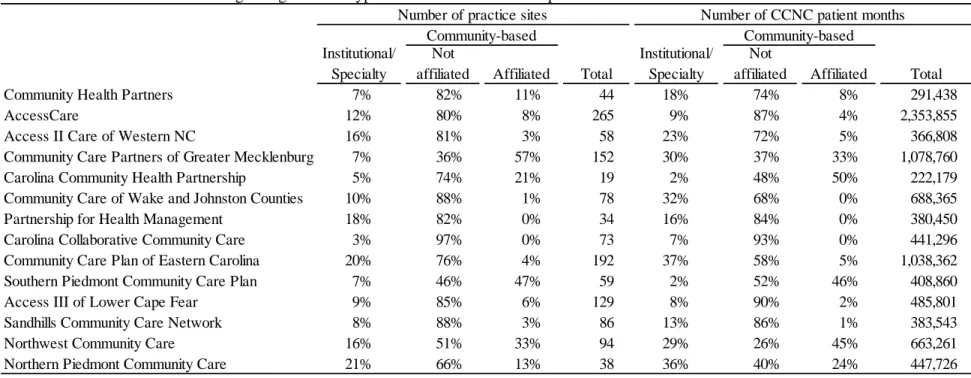
In some networks there were very few or no practices affiliated with one of the six major hospital systems in the state, while affiliated practices made up about half or more of practices in two networks (Table 4.7). Similarly, the share of total CCNC patient-months belonging to practices affiliated with one of the 6 major hospital systems ranged from 0% to 50%.
The share of practices with less than 3 years experience ranged from 11% to 49% (Table 4.8). Practices with less than 3 years experience accounted for 11% of patients in the median network, with a range of 4% to 26%.
28
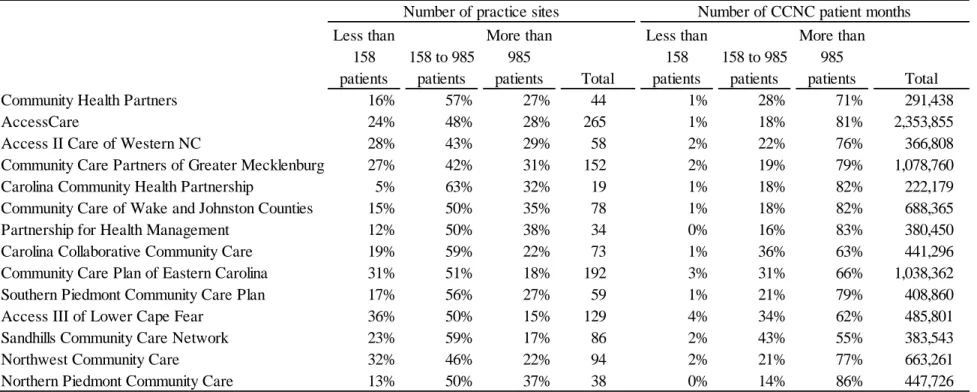
level of scale or higher. This ranged from 55% to 86% (Table 4.9). Practices with scale in the bottom 25 percent (158 unique patients or fewer) accounted for less than 5 percent of patient months in any network. Discussion
In 2008 CCNC was operating in over 1300 primary care practices that were quite diverse in terms of structural attributes and CCNC experience. The majority of CCNC practices were community-based primary care practices; over 500 of these sites were part of practices with just one or two primary care physicians. The vast majority of CCNC practices were not affiliated with one of the major health systems in the state. Further, a substantial minority (over one in five) of CCNC practice sites were institutional practices that traditionally play a major role in the safety net: community health centers, public health departments, and hospital primary care departments. This diversity coupled with the fact that 41% of these practices have at least five years of experience in the CCNC program provides a rich setting in which to examine whether traditional associations between structural attributes and primary care performance persist within a mature community care network program.
CHAPTER 5: HOW MUCH DOES CCNC PERFORMANCE VARY AND DO OBSERVED CHARACTERISTICS EXPLAIN THIS VARIATION?
Introduction
Given substantial variation in the characteristics of CCNC practices and networks, the analyses presented in this chapter examine the degree of variation in performance between and within CCNC networks and whether differences in patient, practice, and community characteristics can explain this variation. As described above, performance was measured in terms of process of care and utilization for adult patients with diabetes and pediatric patients with asthma.
I approached these general goals in three slightly different ways. First, I statistically tested whether variation in performance was greater than would be expected based on chance alone, evaluating two hypotheses:
H1 Variation in CCNC performance between networks is greater than would be expected based on chance alone.
H2 Variation in CCNC performance between practices within networks is greater than would be expected based on chance alone.
I evaluated these hypotheses with and without adjusting for differences in patients, practices, and communities within networks. Second, I examined the relative contribution of variation at three levels--network, practice, and patient--to total variation in each performance measure with and without
adjustment for patient, practice, and community characteristics. Finally, in order to characterize performance variation in a clinically- and policy-relevant manner, I also described the level of
30 Use of multi-level models
Analyzing variation between geographic areas and according to health system attributes is a longstanding hallmark of health services research. Increasingly, researchers are employing variance components models to quantify variation in health system performance and to shed light on the relative importance of factors at different levels in explaining this variation. These models are an attractive tool because they allow the residual variation in a given outcome to be partitioned into variation due to (a) differences between groups at one or more levels and (b) differences between individuals. Another attractive feature of these models is their ability to produce empirical Bayes estimates of the systematic component of variation, one of the more robust metrics for quantifying the degree of variability across groups.76, 77
One criticism of many contemporary variance component studies is researchers‟ tendency to over-interpret intraclass correlation coefficients derived from these models and their failure to examine or discuss the magnitude of variation components in clinically- or policy-relevant terms.56 This dovetails with a main drawback to many statistics describing variability, including the systematic component of variation: their lack of intuitive meaning. (Coory and Gibberd proposed one creative approach to address this shortcoming, discussed in detail below.)
Notwithstanding these cautions, multilevel variance components models are well suited to the goal of documenting the extent and drivers of variation in performance between and within CCNC networks. Moreover, as a mature community care network program, CCNC presents an opportunity to add to our substantive knowledge of performance variation within such programs and to contribute to the growing body of variance components literature in a way that addresses common shortcomings.
Methods
31
Eq 1. Yipn = f(β0 + wn + upn + eipn)
The subscript i denotes the individual patient, p denotes the primary care practice that serves as the patient‟s medical home, and n denotes the practice‟s CCNC network. The residual variance in Yipcn is decomposed into three components: wn, a network-specific error component that varies between networks but is constant for all patients within a given network, upn, a practice-specific error component that varies between practices but is constant for all patients within a given practice, and eipn, a patient-specific error component.
To evaluate H1, I first conducted a likelihood ratio test of the null hypothesis that wn=0 using information from a model with network random intercepts only and a model with no random intercepts--this tests the hypothesis that between-network variation is greater than would be expected based on chance alone ignoring clustering at the practice level within networks. I then tested H1 after accounting for practice-level clustering by conducting a likelihood ratio test of the null hypothesis that wn=0 using information from Eq 1 and an analogous model with random intercepts at the practice level only. To evaluate H2, I conducted a likelihood ratio test of the null hypothesis that upn=0 using information from Eq 1 and an analogous model with random intercepts at the network level only.
After establishing a baseline understanding of whether CCNC performance varies more than would be expected based on chance alone, I examined whether differences in the characteristics of patients, practices, and communities explain this variation in performance. I repeated the above analyses based on an expanded model:
Eq 2. f(Yipn = β0 + Iipn + ηPpn + Ccn + wn + upn + εipn)
where I, P and C are vectors of explanatory variables at the individual patient, practice, and community levels hypothesized to be associated with CCNC performance. These explanatory variables were described in detail in Chapter 3 and are summarized in Table 5.1.
32
performance measure into the three levels--network, practice, and patient--by calculating intraclass correlation coefficients. These coefficients indicate the proportion of variance in the outcome measure at each level. For example:
Eq 3. ρn = σw 2
/ (σw 2
+ σu 2
+ σe 2
)
expressesthe proportion of variance at the network level, ρn, as a function of the variances of the three errors. In the logistic model, the variance of eipn, σe
2
,is fixed at π2/3. The variance of wn and upn are calculated in the estimation of the random intercept models. The intraclass correlation coefficient ρn can be interpreted as the proportion of the total variation in the performance measure that is due to variation between networks.
A second way to describe the extent of variation between groups at different levels is the median odds ratio approach developed by Larsen and colleagues.78, 79 This approach is built on the notion of randomly choosing two patients from different groups and forming the odds ratio comparing the patient with the larger random intercept to the patient with the smaller random intercept.5 If this process is conducted repeatedly with patients from different networks, for example, the median odds ratio tells us that when two patients are randomly chosen from two different networks, the odds ratio comparing the patient with the larger network random intercept to the patient with the smaller network random intercept will exceed the value of the median odds ratio 50% of the time.
To describe the magnitude of within-network variation in clinically- and policy-relevant terms I calculated two measures: (1) the number of missed care or adverse events that would be expected if all patients within a network were at a practice with performance equal to practices with superior rates and (2) the percent of missed care or adverse events that might be avoided if all patients within a network were at a practice with the performance equal to practices with superior rates. This component of the
5
For example, randomly choosing two patients from different networks would yield an odds ratio of
exp(|wnhigh - wnlow|). The median odds ratio can be calculated by setting the cumulative distribution function of these
33
analysis was motivated by the approach proposed by Coory and Gibberd,80 although I implemented the concept somewhat differently.6
I calculated these measures using the empirical Bayes modal predictions of the within-network practice-specific random intercepts and probabilities from Eq 1 (unadjusted) and Eq 2 (adjusted). The empirical Bayes predictions take into account two sources of variation in performance: 1) true variation in performance between groups and 2) random variation of the observed performance rate around the true rate within groups. Often called “shrunken” estimates, they can be viewed as estimates of group-specific performance that have been adjusted to account for random error. Group-specific performance is adjusted toward the overall mean performance at a rate that is inversely proportional to the precision of the group-specific estimate and the variance of the group random intercepts. The overall mean performance rate will have more influence on a group-specific rate when a) the number of observations in the group is smaller, b) the variance of the group level random intercept is smaller, or c) the proportion of residual variance at level 1 (here, the patient level) is large.
I began by calculating the baseline number of “missed care” events (e.g., the number of diabetes patients who did not receive an A1c test during the year) or “adverse” events (e.g., the number of asthma patients with at least one hospitalization during the year) in each network. To do so, I used information from Eq 1 (the unadjusted model) to calculate the mean empirical Bayes predicted probabilities for each network and multiplied this rate by the number of patients in the network.
Next, I calculated the empirical Bayes modal predictions of the practice-level random intercepts and then defined the “superior” performance rate in each network as the 10th percentile of the practice-level random intercepts in each network (since this portion of the analysis is focused on missed care or adverse events, the 10th percentile contains the best ten percent of practices, that is the practices with the
6 Coory and Gibberd calculated these measures based solely on the variance of the group-level intercepts
34
lowest rates of adverse or missed care events). I then set the random intercept for each patient equal to this superior rate or the patient‟s original random intercept, whichever was lower, and re-calculated the predicted probability. This new predicted probability represents the probability of the outcome assuming each patient was at a practice with a random intercept equal to that of the network‟s superior practices. I calculated the mean of this new prediction for each network and multiplied the mean by the number of patients in the network to estimate the number of adverse or missed care events that would have occurred if all practices in a network performed like the network‟s superior practices. The difference between this estimate and the baseline estimate above represents the number of missed care/adverse events that could have been avoided by bringing all practices up to the superior level of performance within their network. I performed this calculation twice for each measure, once without adjusting for differences in patient, practice, and county characteristics (Eq 1) and once after adjusting for these factors (Eq 2).
These measures are a function of a) the predicted practice-specific random intercepts in a network (which will be closer to the network‟s overall mean performance when the variance of the practice-level random intercept is smaller and when the number of patients at the practice is smaller) b) how closely clustered all of a network‟s practices are to the network‟s superior performers and c) the distribution of patients across practices with different performance rates. (For example, consider 2 networks, each with 100 practices. In both networks, 80% of practices have shrunken A1c test performance rates within 5 percentage points of the network‟s superior performers. In Network A, these 80% of practices account for 80% of patients, and the 20% of practices with lower performance account for 20% of patients. In Network B, these 80% of practices account for 50% of patients, and the 20% of practices with lower performance account for 50% of patients. The estimated share of missed A1c tests that could be avoided will be higher in Network B than in Network A.)
35
Eq 1, except that the variance of the practice-level random intercept, upn, is σun 2
instead of σu 2
. The subscript n indicates that it is possible for the variance to vary between networks. To determine whether heteroskedasticity was present at a statistically significant level, I used likelihood ratio tests to compare this model to the model that assumed homoskedasticity.
Results
Description of the analysis population and overall performance rates
In the diabetes analysis population, there were over 11,000 patients nested in 913 practices. In the asthma analysis population, there were over 30,000 patients nested in 876 practices. At the patient level, there were substantial differences between the two populations in individual characteristics and practice characteristics (Table 5.1). Patients in the two populations were similar in terms of
characteristics of the counties in which their CCNC practices were located.
In CCNC as a whole, unadjusted performance on the receipt of recommended diabetes care measures varied by measure, ranging from a high of 88% for A1c testing to a low of 43% for eye exams (Table 5.2). Rates of emergency room visits and hospitalizations with a primary diagnosis of diabetes were fairly low (6% and 4% respectively), as were rates of asthma hospitalizations and beta agonist overuse (3% each). However, nearly one in five children with acute asthma (18%) had at least one asthma emergency room visit.
Does performance vary between and within networks?
Before adjusting for lower level covariates, there was a range of about 10 percentage points or more across networks in the network-specific rates of performance (Figure 5.1). The range in