ELUCIDATIG SNF5 RREGULATED GENE EXPRESSION IN MALIGNANT RHABDOID TUMOR DEVELOPEMNT
Darmood Wei
A dissertation submitted to the faculty at the University of North Carolina at Chapel Hill in partial fulfillment of the requirements for the degree of Doctor of Philosophy in the
Curriculum in Toxicology.
Chapel Hill 2014
Approved by:
Bernard E. Weissman Ian J. Davis
Ilona Jaspers
W. Kimryn Rathmell
ABSTRACT
Darmood Wei: Elucidating SNF5 Regulated Gene Expression in Malignant Rhabdoid Tumor Development
(Under the direction of Bernard E. Weissman)
Malignant Rhabdoid Tumors (MRTs), a pediatric renal cancer, lack SNF5, a subunit
of the SWI/SNF chromatin remodeling complex which regulates nucleosome positioning and
gene expression. MRTs offer a unique model for an epigenetically driven cancer because,
unlike other cancers, they often have no other detectable mutations. Recent data on SWI/SNF
mutations in cancer reveal mutations of 20 SWI/SNF subunit genes across 18 different
cancers. Combined, the mutation rate of SWI/SNF complex members occurs at a frequency
of 19% comparable to the 26% mutation frequency of TP53. Therefore understanding the
SWI/SNF complex is highly relevant in our understanding of the mechanisms of not only
tumorigenesis but also to the contribution of non-genotoxic carcinogens to this process. In
these dissertation studies, we focused on the role of SNF5 inactivation in the development of
MRTs. We hypothesize that SNF5 loss compromises the SWI/SNF complex resulting in
aberrant targeting of the SWI/SNF complex, altered gene expression and tumorigenesis. To
test this notion, we re-expressed SNF5 in MRT cell lines and examined the subsequent
effects in SWI/SNF complex composition and gene expression. Our results indicated that
SNF5 mediates the composition of the SWI/SNF complex, and its loss potentially disrupts
SWI/SNF complex variants required for differentiation. SWI/SNF subunits are
SWI/SNF complex composition also alter targeting of the complex with subsequent changes
gene expression. We validated our results using two known targets of SNF5, p21 and p16,
and also through the identification of 2 two novel SNF5 targets, NOXA and CCNG2. These
genes are upregulated after the reconstitution of the SWI/SNF complexes with SNF5 and
may play critical roles in MRT development. These data demonstrate the intricacies of
chromatin regulation and our incomplete understanding of this process in tumorigenesis.
Together, this body of work serves as another milestone on our path to gain a better
understanding of the relationships between chromatin structure and regulation, cancer
PREFACE
This Doctoral Dissertation contains the results of research conducted by the author,
Darmood Wei, at the Curriculum in Toxicology at the University of North Carolina. The goal
of this dissertation seeks to elucidate the role of SNF5 in the SWI/SNF complex using
malignant rhabdoid tumors as a model system. These data are published or are in the process
of being published.
A version of Chapter 1 was published at eLS. I was the lead author responsible for the
majority of the manuscript and Weissman BE was the supervisory author.
A version of Chapter 2 has submitted for publication at Molecular Cancer Research. I
was the lead investigator, responsible for all major areas of concept formation, data
collection and analysis, as well as the majority of manuscript composition. Song S and
Sakellariou-Thompson D assisted in the characterization of inducible SNF5 cell lines.
Kuwahara Y completed the chromatin immunoprecipitation experiments. Cannon C and
Emannuelle M provided the compound, MG132, and the expertise in ubiquitin dependent
degradation. Goldfarb D and Major MB provided the mass spectrometry data and analysis.
Weissman BE was the supervisory author.
A version of Chapter 3 was published at Molecular Cancer Research. Kuwahara Y
was the lead investigator, Responsible for all major areas of concept formation, data
collection and analysis, as well as the majority of manuscript composition. I was second
composition. Durand J also assisted in the data collection and analysis and manuscript
composition. Weissman BE was the supervisory author.
A version of Chapter 4 will be submitted for publication. I was the lead investigator,
responsible for all major areas of data collection and analysis, as well as manuscript
composition. Charboneau A, Davies B, was involved in the early stages of concept
formation, data collection, and contributed to the manuscript, and Sakellariou-Thompson D
contributed to the data collection. Weissman BE was the supervisory author on this project
TABLE OF CONTENTS
LIST OF FIGURES ... xii
LIST OF TABLES ... xiv
LIST OF ABBREVIATIONS ...xv
Chapter 1: Genetics and Genomics of Malignant Rhabdoid Tumors ...1
1.1 Summary ...1
1.2 Introduction ...1
1.3 Pathology ...4
1.4 SNF5 loss in MRT patients ...5
1.5 RTK vs. AT/RT ...6
1.6 SNF5 is a member of the SWI/SNF complex ...7
1.7 Mechanisms of SNF5 Tumor Suppression...10
1.7.1 Cell Cycle Regulation ...12
1.7.2 DNA Damage Repair ...13
1.7.3 Dysregulation of transcription factor activity ...14
1.7.4 Altered Nucleosome Positioning ...15
1.7.5 SWI/SNF Complex Disruption ...16
1.8 Environment As Etiological Factor in MRTs ...17
1.9 Future Directions ...18
Chapter2: SNF5/INI1 Deficiency Destabilizes the SWI/SNF Complex During Malignant Rhabdoid Tumor Development ...20
2.1 Summary ...20
2.3.1 Cell lines. ...22
2.3.2 Adenovirus infection. ...23
2.3.3 Protein extracts and Western blotting. ...23
2.3.4 RNA extraction and quantitative real-time reverse transcription–PCR analysis...24
2.3.5 Immunoprecipitation. ...25
2.3.6 Mass Spectrometry ...25
2.3.7 Lentiviral procedures and small hairpin RNA ...26
2.3.8 Inducible SNF5 Cell lines ...26
2.3.9 ß-galactosidase staining. ...26
2.3.10Protein degradation inhibition. ...27
2.4 Results ...27
2.4.1 SWI/SNF Complex Components Are Post-Transcriptionally Regulated in MRT Cell Lines. ...27
2.4.2 hSNF5 Re-expression in MRT Cell Lines Increases SWI/SNF Complex Component Levels. ...32
2.4.3 hSNF5 Expression Increases the Complexity of SWI/SNF Complexes. ...35
2.3.5 Inhibition of SNF5 Expression in Normal Human Fibroblasts Causes Reduced Complex Component Expression. ...41
2.3.6 SWI/SNF complex components are degraded in a proteasome-independent mechanism ...44
2.4 Discussion ...46
2.5 Supplementary Figures ...50
Chapter 3: hSNF5 reexpression in malignant rhabdoid tumors regulates the transcription of a subset of p53 target genes by recruitment of SWI/SNF complexes and RNAPII to their promoters. ...51
3.1 Summary ...51
3.2 Introduction ...52
3.3.1 Cell culture and adenovirus infection. ...54
3.3.2 Protein extracts and Western blotting. ...54
3.3.3 RNA extraction and Quantitative real-time reverse transcription-PCR analysis. ...54
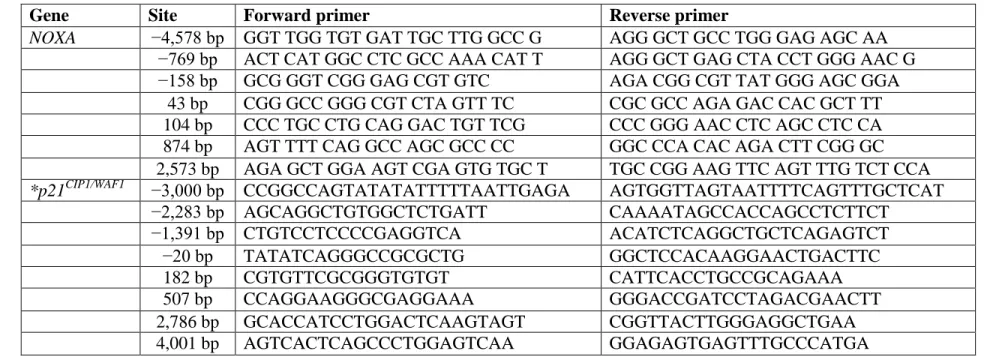
3.3.4 Chromatin immunoprecipitation. ...57
Table 3.2 – PCR primer sequences for ChIP assays ...58
3.4 Results ...59
3.4.1 The effects of reexpression of hSNF5 on p53 target genes in MRT cell lines. ...59
3.4.2 hSNF5-induced NOXA mRNA and protein expression in MRT cell lines. ...61
3.4.3 Recruitment of hSNF5 on NOXA locus correlates with NOXA transcription in MRT cell lines. ...64
3.4.4 Reexpression of hSNF5 induces p21CIP1/WAF1 and NOXA transcription accompanied with SWI/SNF complex recruitment. ...67
3.4.5 Reexpression of hSNF5 induces p21CIP1/WAF1 and NOXA transcription accompanied with RNAPII recruitment and histone modification. ...68
3.4.6 p53 is not required for hSNF5-induced transcriptional activity on the NOXA and p21CIP1/WAF1 promoters. ...69
3.5 Discussion ...70
Chapter 4: Cyclin G2, a Novel Target of the SNF5/BAF47 Tumor Suppressor Gene ...76
4.1 Summary ...76
4.2 Introduction ...77
4.3 Materials and Methods ...78
4.3.1 Cell Culture: ...78
4.3.2 Western Blotting: ...79
4.3.3 Chromatin Immunoprecipitation: ...79
4.3.5 Immunoprecipitation: ...81
4.3.6 Cell Cycle SuperArray...81
4.3.7 Primary MRT Gene Expression Analyses ...81
4.4 Results ...83
4.4.1 Identification of novel SNF5 target genes- ...83
4.4.2 Validation of gene expression in A204.1 cells by qPCR- ...87
4.4.3 Chromatin Immunoprecipitation (ChIP) analysis...90
4.4.4 Downregulation of CCNG2 expression in primary MRTs ...94
4.4.5 CCNG2 does not associate with the SWI/SNF complex ...96
4.5 Discussion ...98
4.6 Supplementary Figures ...101
Chapter 5: Conclusions and Perspectives ...102
5.1 Summary of Findings ...102
5.2 Challenges encountered and observations...104
5.3 Relevance to toxicology ...106
5.4 MRT cell of origin...109
5.5 Therapeutic strategies for cancers with SWI/SNF mutations ...110
5.5.1 Synthetic lethality ...111
5.5.2 Stabilization of SWI/SNF subunits...112
5.5.3 Short-term expression of tumor suppressor ...113
5.6 Future Directions ...116
LIST OF FIGURES
Figure 1.1 – Histopathology of MRT ...3
Figure 1.2 – SNF5 comprises all SWI/SNF complexes ...9
Figure 2.1 – Decreased SWI/SNF complex protein but not mRNA in MRT cell lines ...29
Figure 2.2 – Decreased SWI/SNF complex proteins in primary tumor samples ...31
Figure 2.3 – hSNF5 Re-expression in MRT Cell Lines Increases SWI/SNF Complex Component Levels ...34
Figure 2.4 – Inducible MRT cell lines ...36
Figure 2.5 –SWI/SNF complex composition changes after SNF5 re-expression ...40
Figure 2.6 – Reduction of BAF180 protein levels after inhibition of SNF5 in normal human fibroblasts ...43
Figure 2.7 – SWI/SNF complex components are degraded in a proteasome-independent mechanism ...45
Supplementary Figure 2.5.1 – A204.1 pIND20-fSNF5-HA Time Course ...50
Figure 3.1 – hSNF5-induced p53 target genes’ expression ...60
Figure 3.2 – hSNF5-induced NOXA mRNA expression ...62
Figure 3.3 – hSNF5-induced NOXA protein expression ...63
Figure 3.4 - Recruitment of hSNF5, SWI/SNF complexes and RNAPII to the NOXA locus and histone modification on NOXA locus after hSNF5 reexpression ...65
Figure 3.5 – Recruitment of hSNF5, SWI/SNF complexes, RNAPII, and p53 to the NOXA locus and histone modification on NOXA locus after hSNF5 reexpression ...68
Figure 4.3- SNF5 expression correlates with CCNG2 expression in
MRT cell lines and primary tumors ...95 Figure 4.4. CCNG2 does not associate with the SWI/SNF complex ...97
Supplementary Figure 4.1 - Comparison of SNF5 expression
after Ad-SNF-GFP vs. Ad-HA-SNF5 infection ...101 Figure 5.1 – 24hrs of SNF5 induction sufficient for reduction in
LIST OF TABLES
Table 1.1 – Cellular Pathways Affected by SNF5 Inactivation ...11
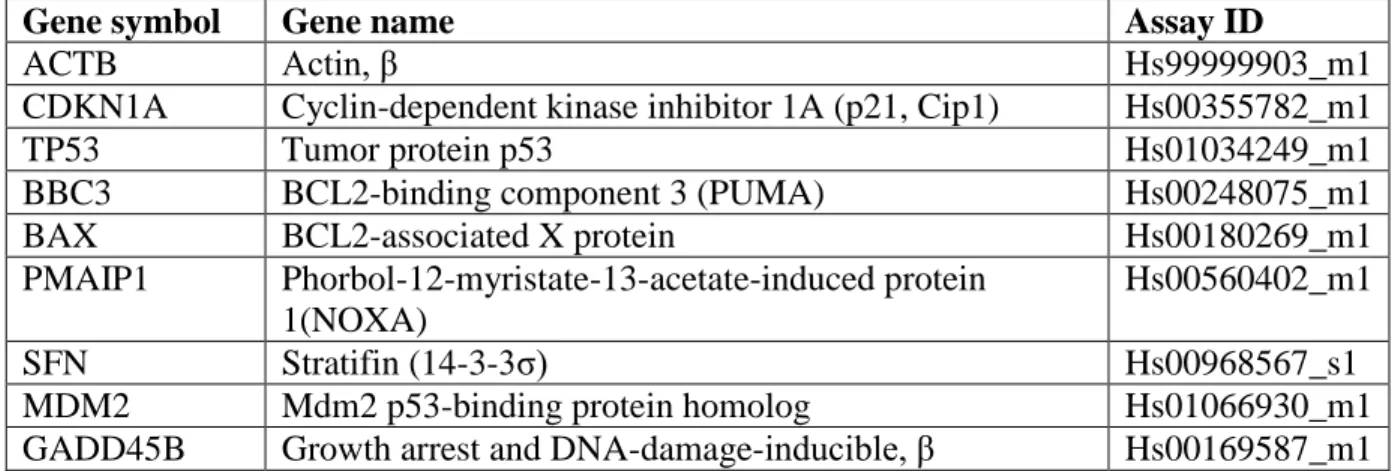
Table 3.1 – TaqMan gene expression primer/probes ...56
Table 3.2 – PCR primer sequences for ChIP assays ...58
Table 4.1: Primer/Probes for genes analyzed by RT-PCR. ...80
Table 4.2 – Summary of gene expression common to Ad-Rbcdk and Ad-SNF5 infection of A204.1 cells ...85
Table 4.2 – Summary of gene expression changes correlated to SNF5 infection of A204.1 cells ...86
LIST OF ABBREVIATIONS
Ad - Adenoviral Vector
AT/RT – Atypical Teratoid/Rhabdoid Tumor
ATP – Adenosine Triphosphate
BAF0 – BRG1 (or BRM) associated factor
BRG1 – Brahma-Related Gene 1
BRM – Brahma CCNG2 – Cyclin G2
CCNH – Cyclin H
cDNA – Complementary Deoxyribonucleic acid
ChIP – Chromatin Immunoprecipitation
CMV – Cytomegalovirus Promoter DNA – Deoxyribonucleic Acid
GFP - Green Fluorescent Protein
HA – Hemagglutinin Tag
H3K4m3 – Histone H3 Lysine 4 Trimethylation
MOI – Multiplicity of Infection MRT – Malignant Rhabdoid Tumor
PBS – Phosphate Buffered Saline
PCA – Principal Components Analysis
PCR – Polymerase Chain Reaction
Rb – Retinoblastoma Protein
RTK – Rhabdoid tumor of the kidney
shRNA – short hairpin Ribonucleic Acid
siRNA – Small Interfering Ribonucleic Acid
SMARC - SWI/SNF related, matrix associated, actin dependent regulator of chromatin
Chapter 1: Genetics and Genomics of Malignant Rhabdoid Tumors1
1.1 Summary
Malignant rhabdoid tumors (MRTs) represent an aggressive pediatric cancer with
limited treatment options. While MRTs mainly arise in the kidney and brain of patients
under the age of 8 years, they may appear in other major organs as well as the soft tissues.
Remarkably, these tumors possess few mutations other than ones that inactivate the
SNF5/INI1 gene, the smallest member of the SWI/SNF chromatin-remodeling complex. In
addition, these cancers lack other hallmarks of adult malignancies including genomic
instability, aberrant karyotypes and abnormal regulation of cellular stress response pathways.
Their major defect appears to arise from epigenetic instability, presumably through changes
in nucleosome positioning due to defective chromatin remodeling activity. Recent reports
have shown that SNF5 loss affects key signaling pathways such as cell cycle regulation,
DNA damage repair and gene transcription. Thus, MRTs offer a unique model for studying
the role of epigenetics in driving tumorigenesis and for the development of novel treatment
approaches.
1.2 Introduction
The National Wilms Tumor Study first described malignant Rhabdoid Tumor (MRT),
a highly aggressive pediatric cancer, in 1978 as a rhabdomyosarcomatoid variant of a Wilms
tumor (Tomlinson et al., 2005a). Rhabdomyosarcomatoid, later abridged to rhabdoid,
1
referred to absence of muscular differentiation in these tumors despite their microscopic
appearance (Tomlinson et al., 2005a). MRTs were later determined to be a distinct cancer
from Wilms tumors and rhabdomyosarcomas. While MRTs were first reported in kidney,
they have been found in various locations in the body, including the brain, liver, lung, skin,
and heart (Parham et al., 1994; Rorke et al., 1996). MRTs occur with the greatest frequency
in the kidneys, designated as rhabdoid tumors of the kidney (RTK), and in the brain, atypical
teratoid/rhabdoid tumors (AT/RT).
At first the diagnosis of MRT relied upon the expertise of a limited number of
pathologists, based upon the histology of the tumor and the appearance of the diagnostic
rhabdoid cell (Figure 1.1). However, MRTs are now identified by the bi-allelic loss of the
SMARCB1/INI1/SNF5/BAF47 gene, hereafter referred to as SNF5. SNF5 is a highly
conserved subunit of the SWI/SNF chromatin-remodeling complex. Intriguingly, SNF5 loss
does not affect genetic stability in MRT, but causes epigenetic instability(McKenna et al.,
2008a). Next generation sequencing of these tumors revealed few mutations in MRTs
beyond those found in SNF5 (Lee et al., 2012). These results pose the question of how loss
of a singular protein can profoundly affect tumorigenesis. Thus, these tumors offer a true
epigenetically driven model for human cancer development. Further insights into the
etiology of MRTs will promote our understanding of the role of epigenetic changes during
Figure 1.1 – Histopathology of MRT. Hematoxylin and eosin staining of a brain malignant
rhabdoid tumor (AT/RT) from a young pediatric patient. The black arrow denotes a rhabdoid
cell with significant accumulation of intermediate filaments with the cytoplasm. The white
arrows demonstrate the prominent single nucleolus often observed in MRTs. Photograph
1.3 Pathology
MRTs are extremely aggressive- approximately, 80-90% of children die from the
disease within a year of diagnosis (Tomlinson et al., 2005a). For patients with MRT, the age
at diagnosis appears to be a prognostic factor. Infants diagnosed between 0 and 5 months of
age have the worst 4-year survival rate- 8.8% compared to 41.1% in infants 24 months or
older (Tomlinson et al., 2005a). Additionally, high-stage (stage III/IV) disease at diagnosis is
also correlated with an adverse outcome. The median appearance of tumors in children, 11
months, suggests that younger patients may likely exhibit germ line mutations resulting in a
more aggressive disease (Tomlinson et al., 2005a). Furthermore, 70% of patients present with
stage III or IV disease (Tomlinson et al., 2005a). The existing protocols for treatment
include tumor resection, followed by adjuvant chemotherapy and/or radiation (Biswas et al.,
2009). This current protocol suffers from several inadequacies, including the difficulty of
resection due to the tumor size and the contraindication of radiation in young patients,
especially in the developing brain (Biswas et al., 2009). It is unknown whether the
aggressiveness of the disease is the result of underlying germ line mutations or the presence
of multiple tumors (Roberts and Biegel, 2009a). While malignant rhabdoid tumors are
generally considered pediatric malignancies, there have been rare occurrences in adults.
Approximately 31 cases have been reported between 1992 and 2011, with the mean age of
diagnosis at 30 years of age (Samaras et al., 2009; Shonka et al., 2011). MRTs in adults are
no less aggressive with mean survival times of slightly less than 2 years (Samaras et al.,
2009).
Classic malignant rhabdoid tumors contain diagnostic cells with a distinctive
prominent nucleoli. The acentric nucleus is the result of swirls of intermediate filaments
pushing the nucleus to the side (Schmidt et al., 1982). Additionally, the loss of SNF5 can be
easily distinguished through immunohistochemistry (IHC) staining. Histology and IHC
staining for SNF5 now comprise the diagnostic features of malignant rhabdoid tumors
(Roberts and Biegel, 2009a).
1.4 SNF5 loss in MRT patients
SNF5 loss in MRTs occurs through a combination of frame shifts, nonsense
mutations, and deletions, with the latter alteration appearing most commonly (Versteege et
al., 1998c). SNF5 mutations can either arise de novo or be inherited from a parent. An
estimated 35% of MRT patients carry a germ line mutation of SNF5 (Eaton et al., 2011).
Eaton et al. undertook a study to examine the SNF5 status in 100 MRT cases. The majority
of parents of MRT patients with germ line mutations appears healthy and has a normal SNF5
sequence (Eaton et al., 2011). This finding suggests a de novo origin for most of the SNF5
mutations in these patients, with the mutations occurring pre-zygotically, during
gametogenesis, or post-zygotically, during the early stages of embryogenesis. Eaton et al.
observed only 9 cases where the mutated SNF5 gene came from a parent. In 8 of the 9 cases,
family members have been diagnosed with malignant rhabdoid tumors or schwannomas
(Eaton et al., 2011). The parents who were carriers of the SNF5 mutation often developed
schwannomas. In cases of asymptomatic parents, their siblings were affected by the SNF5
mutations, indicative of gonadal mosaicism. Presently, no data suggest a parental bias for the
origin of SNF5 mutations (Eaton et al., 2011). In rare cases, mutations in the
BRG1/SMARCA4 gene, coding for the ATPase of the complex, are found in MRTs in lieu of
pathology of these tumors to those with SNF5 loss further emphasizes the key role of loss of
SWI/SNF complex activity in the development of this cancer.
1.5 RTK vs. AT/RT
There has been significant controversy in the field regarding the distinction between
RTKs and AT/RTs. While these rhabdoid tumors arise in different anatomical sites, they are
linked by one commonality, SNF5 loss. One must therefore ask whether both RTKs and
AT/RTs should be reclassified as a single group of MRTs. A recent study found compared
mRNA to microRNA (miRNA) expression in RTKs and AT/RTs (Grupenmacher et al.,
2013b). Intriguingly, they found that while gene expression varied between these two
classes, microRNA expression appeared very similar (Grupenmacher et al., 2013b).
miRNAs are small non-coding RNA molecules that have been implicated in both positive
and negative gene regulation. Mammalian miRNA has partial complementarity to its mRNA
targets allowing it to target multiple mRNA targets. Additionally, as demonstrated by
Grupenmacher and colleagues, a given target may be targeted by several distinct miRNAs
(Grupenmacher et al., 2013b). Given the complex nature of miRNA regulation of gene
expression, it seems surprising that the differences in mRNA expression patterns between
these tumor subtypes are not reflected in divergent miRNA patterns. One possible
explanation put forth by Grupenmacher and colleagues suggests that the mRNA differences
between RTK and AT/RT reflect the divergent microenvironments in their tissues of origin
(Grupenmacher et al., 2013b). In contrast, similar miRNA patterns may indicate a common
cell of origin for MRTs in both tissues.
Because MRTs are found in different tissues, the cellular origin remains unclear.
the cell of origin, potentially a neuronal stem cell. For example, Okuno et al. found that
MRTs express neuronal stem cell markers including CD133, nestin, and Musashi-1 (Msi-1)
(Okuno et al., 2010). More intriguingly, MRT cell lines can be induced to differentiate by
N-(4-hydroxylphenyl) retinamid (4-HPR) with concomitant downregulation of CD133, nestin,
and Msi-1 (Okuno et al., 2010). The possible origin of MRTs from neuronal stem cells could
support the observation that families with history of SNF5 loss often have members that
develop schwannomas (Eaton et al., 2011). SNF5 and NF2 mutations, frequently observed in
schwannomas are located in close proximity on chromosome 22 (Boyd et al., 2008). Thus, a
single genetic event could result in loss of both genes (Boyd et al., 2008). The identification
of the cell(s) of origin for MRTs will allow provide clearer insights into their development.
1.6 SNF5 is a member of the SWI/SNF complex
SNF5 is a core member of the SWI/SNF chromatin-remodeling complex. The
SWI/SNF complex has multiple variants and is classified by their mutually exclusive ATPase
subunits, BRM and BRG1. However, in the majority of MRTs, BRM is believed to undergo
epigenetically silencing leaving only the BRG1 containing complexes (Glaros et al., 2007).
BRG1 containing SWI/SNF complexes can be subdivided into two mutually exclusive
groups BAF180/PBRM1 and BAF250A/ARID1A containing complexes (Wilson and
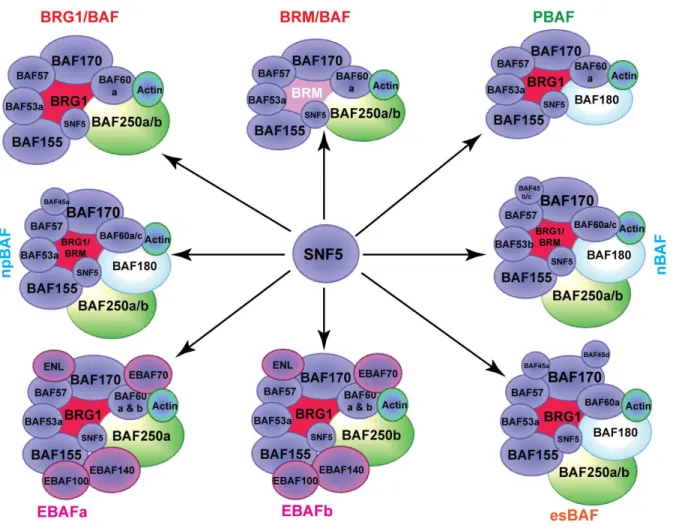
Roberts, 2011). While SNF5 appears in all the SWI/SNF complexes, little is known about
the effects of SNF5 loss upon SWI/SNF activity (Figure 2). One previous study by Doan et
al. showed that the SWI/SNF complex appeared intact in MRT cell lines despite the loss of
SNF5 (Doan et al., 2004). They also demonstrated that BRG1-dependent genes did not show
altered expression in MRT cell lines (Doan et al., 2004). However, in genetically engineered
BRG1-containing SWI/SNF complexes, suggesting that its loss fundamentally alters the complex
activity (Wang et al., 2009). In general, previous reports have suggested two distinct roles
for SNF5 loss during MRT development: as a classical tumor suppressor and as a critical
element for cell survival (Isakoff et al., 2005; Roberts et al., 2000). Interestingly, MRTs
Figure 1.2 – SNF5 comprises all SWI/SNF complexes. Each SWI/SNF complex identified by previous studies varies in their subunit
composition. However, all SWI/SNF complexes contain the SNF5 protein suggesting that its loss would affect all SWI/SNF complex
1.7 Mechanisms of SNF5 Tumor Suppression
To understand the contribution of SNF5 loss to the etiology of MRT, considerable
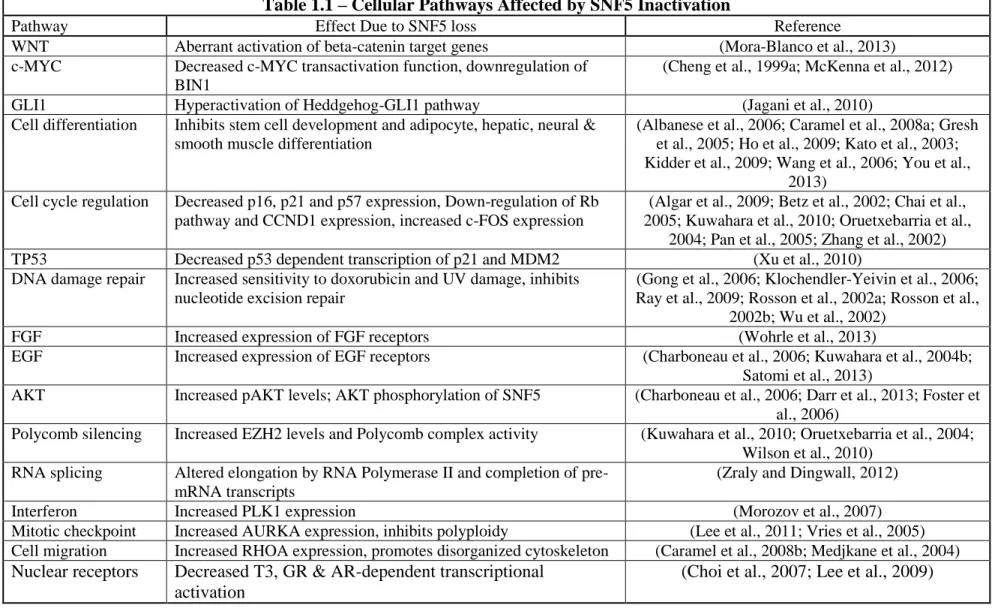
studies have focused upon identifying the underlying mechanisms. As shown in Table 1.1,
inactivation of SNF5 functions impacts a broad range of cellular functions including cell
cycle control, DNA damage response and cellular differentiation. We have not included all
pathways associated with SWI/SNF complex activities, only those directly linked to SNF5
loss. Below, we discuss in more detail some of the most intriguing possibilities for how
Table 1.1 – Cellular Pathways Affected by SNF5 Inactivation
Pathway Effect Due to SNF5 loss Reference
WNT Aberrant activation of beta-catenin target genes (Mora-Blanco et al., 2013) c-MYC Decreased c-MYC transactivation function, downregulation of
BIN1
(Cheng et al., 1999a; McKenna et al., 2012) GLI1 Hyperactivation of Heddgehog-GLI1 pathway (Jagani et al., 2010)
Cell differentiation Inhibits stem cell development and adipocyte, hepatic, neural & smooth muscle differentiation
(Albanese et al., 2006; Caramel et al., 2008a; Gresh et al., 2005; Ho et al., 2009; Kato et al., 2003; Kidder et al., 2009; Wang et al., 2006; You et al.,
2013) Cell cycle regulation Decreased p16, p21 and p57 expression, Down-regulation of Rb
pathway and CCND1 expression, increased c-FOS expression
(Algar et al., 2009; Betz et al., 2002; Chai et al., 2005; Kuwahara et al., 2010; Oruetxebarria et al.,
2004; Pan et al., 2005; Zhang et al., 2002) TP53 Decreased p53 dependent transcription of p21 and MDM2 (Xu et al., 2010)
DNA damage repair Increased sensitivity to doxorubicin and UV damage, inhibits nucleotide excision repair
(Gong et al., 2006; Klochendler-Yeivin et al., 2006; Ray et al., 2009; Rosson et al., 2002a; Rosson et al.,
2002b; Wu et al., 2002)
FGF Increased expression of FGF receptors (Wohrle et al., 2013)
EGF Increased expression of EGF receptors (Charboneau et al., 2006; Kuwahara et al., 2004b; Satomi et al., 2013)
AKT Increased pAKT levels; AKT phosphorylation of SNF5 (Charboneau et al., 2006; Darr et al., 2013; Foster et al., 2006)
Polycomb silencing Increased EZH2 levels and Polycomb complex activity (Kuwahara et al., 2010; Oruetxebarria et al., 2004; Wilson et al., 2010)
RNA splicing Altered elongation by RNA Polymerase II and completion of pre-mRNA transcripts
(Zraly and Dingwall, 2012)
Interferon Increased PLK1 expression (Morozov et al., 2007)
Mitotic checkpoint Increased AURKA expression, inhibits polyploidy (Lee et al., 2011; Vries et al., 2005) Cell migration Increased RHOA expression, promotes disorganized cytoskeleton (Caramel et al., 2008b; Medjkane et al., 2004) Nuclear receptors Decreased T3, GR & AR-dependent transcriptional
activation
(Choi et al., 2007; Lee et al., 2009)
1.7.1 Cell Cycle Regulation
A consistent property of MRT cell lines is that upon SNF5 re-expression, they
undergo a G1 cell cycle arrest (Betz et al., 2002; Versteege et al., 2002). SNF5 re-expression
results in increased levels of 2 cyclin-dependent kinases, p21WAF1/CIP1 and p16INK4A, two well-established tumor suppressors (Kamb et al., 1994; Yang et al., 1995). Of note,
induction of p21 and p16 occurs through two distinct mechanisms (Betz et al., 2002; Kia et
al., 2008c; Kuwahara et al., 2010).
The SWI/SNF complex forms independently of SNF5 (Doan et al., 2004), and ChIP
data suggest that the constant presence of BRG1 containing complexes missing SNF5 along
the p21 promoter (Kuwahara et al., 2010). It is believed that these “incomplete” complexes
initiate transcription but cannot displace the nucleosomes at the promoter. These obstacles
prevent the elongation of RNA polymerase II resulting in promoter pausing concomitant with
decreased p21 expression (Brown et al., 1996; Neely et al., 1999). During SNF5
re-expression, SNF5 stabilizes and recruits BAF180 to the SWI/SNF complex thus changing the complex’s stoichiometry (unpublished observations). The reconstituted SWI/SNF complex
binds to the TSS of p21 promoter, as evidenced by the similar binding profile of SNF5 and
BAF180 (Wei, Weissman and Kuwahara- unpublished observation). The “complete”
SWI/SNF complex is able to effect chromatin remodeling and to allow robust p21
transcription. Alternatively, these events could indicate a model where BAF180 can be
recruited to the p21 promoter and initiate expression independent of SNF5. However, levels
of p21 remain low due to degradation of BAF180 in the absence of SNF5 (Wei, Weissman
complex leading to increased p21 expression. Interestingly, this p21-dependent mechanism
can function in either a p53-independent or p53-dependent manner (Kuwahara et al., 2010).
In contrast to p21 expression, p16 expression is silenced epigenetically by binding of
the polycomb complex to its promoter (Jacobs et al., 1999). Kia and colleagues
demonstrated in MRT cell lines that SNF5 recruits BRG1 and by extension the SWI/SNF
complex to the p16 promoter resulting in polycomb eviction and p16 re-expression (Kia et
al., 2008b). Additionally, they showed that p16 expression is BRG1 dependent (Kia et al.,
2008b). The silencing of p16 by the polycomb complex in MRTs probably occurs normally
in its cell of origin i.e. a stem cell, rather than an active process initiated by SNF5 loss. Thus,
this mechanism of gene expression differs from the mechanism at the p21 promoter where
the SWI/SNF complex remains in the absence of SNF5 (Kuwahara et al., 2010). However,
on closer examination, the expression of p21 occurs prior to p16 suggesting that SNF5
induced cell cycle arrest is initially driven by a p21-dependent mechanism.
1.7.2 DNA Damage Repair
The SWI/SNF complex has been implicated in DNA damage repair, including
nucleotide excision repair. In general, nucleosomes can obstruct protein complexes from
binding to DNA, including DNA repair enzymes. Thus, the presence of SWI/SNF complex
affects chromatin remodeling to allow access by DNA repair enzymes and increase the rate
of DNA repair (Gaillard et al., 2003). Of note, MRT cell lines retain intact p53 pathways
(Chai et al., 2005). Complementary studies conducted in MEFs found that reduction of
SNF5 leads to accumulation of p53 (Klochendler-Yeivin et al., 2006). Klochnendler-Yeivin
et al. demonstrated, in SNF5-null MEFs, that DNA damage could activate p53
dependent genes MDM2 and PUMA, yet had no effect on other p53 targets such as p21 and
BAX (Klochendler-Yeivin et al., 2006). Additionally, they observed that SNF5 loss in MEFs
increased susceptibility to UV irradiation (single strand breaks) and doxorubicin (double
strand breaks) (Klochendler-Yeivin et al., 2006). We have observed similar results in human
MRT cell lines where either PUMA or NOXA expression increases after SNF5 re-expression
(Kuwahara et al., 2013a). These data imply that SNF5 plays an important role in a cell’s
ability to survive DNA damage. These observations appear consistent with the aggressive
malignancies caused by SNF5 loss, but not with their lack of additional mutations, i.e. no
genetic instability. The paradoxical nature of SNF5 further underscores the complexity of
this disease.
1.7.3 Dysregulation of transcription factor activity
SNF5 has been demonstrated to interact with a wide range of transcription factors.
Consequently, SNF5 loss can lead to dysregulation of the pathways regulated by each
transcription factor. For example, SNF5 has been demonstrated to interact with
glioma-associated oncogene family zinc finger-1 (GLI1) as well as c-Myc. SNF5 loss results in
aberrant activation of GLI1, an effector protein for the Hedgehog signaling (Jagani et al.,
2010). Jagani et al. demonstrated that that SNF5 not only interacts with GLI1 but also
localizes to GLI1-regulated promoters. Intriguingly, loss of SNF5 results in hyperactivation
of GLI1 and PTCH1, while SNF5 re-expression MRT cell lines results in their
down-regulation (Jagani et al., 2010). These findings suggest that SNF5 plays repressive role in
relation to the Hedgehog-GLI pathway, an oncogenic pathway associated with many tumors
A second example is c-MYC, a sequence specific transactivator that interacts with
SNF5 resulting in the recruitment of the SWI/SNF complex (Cheng et al., 1999a). It is
further believed that this interaction results in the transcription of a small subset of c-MYC
target genes including those that are involved in apoptosis (Cheng et al., 1999a). Many
human tumors overexpress the C-MYC oncogene including a large number of pediatric
cancers. It can also act as an oncogene in many animal models of cancer (Albihn et al.,
2010). Thus, the normal suppression of their transcriptional activities may play a role in SNF5’s tumor suppressor functions (Morton and Sansom, 2013).
1.7.4 Altered Nucleosome Positioning
SNF5 has been found to be important for chromatin remodeling during
differentiation. You et al. demonstrated that SNF5 is recruited to both OCT4 activated and
repressed genes as indicated by H3 methylation patterns. The OCT4 transcription factor
plays a key role in maintaining pluripotency (Young, 2011). Yet, SNF5 levels appears to be
inversely correlated with OCT4 expression levels which seems to suggest that levels of SNF5
may change as a cell differentiates (You et al., 2013). During differentiation, SNF5 is
recruited to genes activated by OCT4, resulting in nucleosome enrichment, and to genes
repressed by OCT4, leading to nucleosome depletion (You et al., 2013). This interaction
supports that notion that SNF5 and the SWI/SNF complex play critical roles in
differentiation. Furthermore, the kinetics of the activity suggest that given a differentiation
cue, SNF5 condenses chromatin regions of active transcription and then opens the chromatin
regions of Oct4 repressed genes in a two-step manner. Given this scenario, it is not
surprising that SNF5 loss results in a stem cell like state and over-expression of SNF5 biases
embryonic and differentiated cellular states. Loss of SNF5 can disrupt the timing of gene
expression during differentiation, further underscoring the impact of disruption of
nucleosome positioning. Paradoxically, there is evidence that the SWI/SNF complex plays
an intimate role in maintain pluripotency. Over-expression of BRG1 and BAF155, other
SWI/SNF complex members, increases re-programming efficiency in iPS cells (Singhal et
al., 2010). Also BAF155 and BRG1 have been shown to be critical for self-renewal in ES
cells (Ho et al., 2009). These observations appear consistent with enrichment of the stem
cell-associated signatures as well as their associated proliferation deficient signatures found
in SNF5-deficient MEFs (Wilson et al., 2010).
1.7.5 SWI/SNF Complex Disruption
Previous reports have shown the effects of loss of individual SWI/SNF complex
members upon the organization and stability of the remaining complex members. For
example, studies by Chen and Archer posited that BAF155 serves as a scaffolding element
required for stability of other SWI/SNF complex components including BRG1 (Sohn et al.,
2007) and BAF57 (Chen and Archer, 2005). Another report demonstrated that
ARID2/BAF200 regulated BAF180 expression at the level of mRNA expression (Yan et al.,
2005). Other reports have shown increased expression of BRM upon loss of BRG1
expression. Recent evidence has also shown decreased BAF57 and SNF5 levels in BAF155
deficient cells lines (DelBove et al., 2011). In drosophila, loss of the SNF5 ortholog, SNR1,
leads to SWI/SNF complex instability (Zraly and Dingwall, 2012).
Only one previous study addressed the effects of SNF5 loss in mammalian cells upon
SWI/SNF complex assembly and function. Doan et al. showed assembly of the complex in
2004). However, loss of SNF5 protein has profound impact on another SWI/SNF complex
member, BAF180. Our lab has demonstrated that BAF180 is regulated post-transcriptionally
(unpublished observations). BAF180 protein is stabilized by the presence of SNF5; however,
in the absence of SNF5, BAF180 is degraded via an ubiquitin-ligase dependent manner. This
reconstituted complex has been shown to target to the p21 promoter (Kuwahara et al.,
2013a). This demonstrates that the stoichiometry of the complex has a broad impact on gene
expression, consistent with previous evidence demonstrating that other SWI/SNF complex
members are interdependent in their role to maintain complex integrity. Future studies into
understanding the mechanism of BAF180 instability could prove instrumental in treating not
only MRTs but also in cancers have demonstrated SNF5 loss.
1.8 Environment As Etiological Factor in MRTs
Little else is known regarding the etiology of this cancer. The low incidence of
MRTs has made it difficult to conduct epidemiological studies to better understand this
unique cancer. However, a variety of environmental agents are known to modulate
epigenetic machinery in living organisms, including ATP-dependent chromatin remodeling.
Some reports have suggested MRTs may arise from a shared parental environment
implicating environmental factors in mutations and/or loss of SNF5 (Swinney et al., 2006b).
The most compelling case for environmental factors as the etiological agent was published in
2006 where doctors observed 3 cases in which unrelated children developed rhabdoid
tumors, lived in the same geographic area, and had parents that worked at the same job site
(Swinney et al., 2006b). These investigators examined the relevant parent of two of these
patients: a 4-month old Caucasian female with an AT/RT and a 4-month old Asian American
through infancy. Subsequent genetic analysis revealed that she had a germ line SNF5
mutation. Genetic analysis revealed found no germ line mutation of SNF5 in either the
second patient or the parents. The mother of the second patient also worked at the same job
site prior to conception to through infancy. No genetic analysis was conducted on the third
case.
In the majority of patients the SNF5 mutations have been found to be de novo in
origin with the parents unaffected (Eaton et al., 2011). This would suggest the majority of
the cases are a result of a mutation arising either pre-zygotically (gametogenesis) or
post-zygotically (embryogenesis). This time course is consistent with possibility of environmental
exposure as an etiological agent. However, due to the low frequency of these tumors,
conducting epidemiological studies has been challenging.
1.9 Future Directions
Currently, the protocols for MRT treatment include tumor resection, followed by
adjuvant chemotherapy with vinicristine/actinomycin D/cyclophosphamide (VAC) regimen
(Biswas et al., 2009). These treatment options suffer from several inadequacies including the
difficulty of resecting large tumors, sometimes in sensitive sites such as the brain and spinal
cord, as well as the contraindication of chemotherapy in young patients (Biswas et al., 2009).
Therefore, a great need exists for treatment approaches that will improve patient outcome in
these pediatric patients. Unfortunately, direct targeting of the SWI/SNF complex does not
appear feasible because of the potential cross-reactivity with a wide range of other
ATP-dependent enzymes (Keppler and Archer, 2008). Therefore, a better understanding of how
SNF5 loss contributes to MRT development should provide new targets for novel drugs or
SNF5 is a multifaceted protein with involvement in a wide array of cellular process,
consistent with its contribution to SWI/SNF complex activities. Identifying the pathways
activated during SNF5 re-expression should reveal potential targets for specific therapeutic
interventions. Furthermore, it has been conjectured that the cell of origin may be a neuronal
progenitor cell. Confirmation of the cell of origin would provide information not only on the
critical development period when these tumors arise but also biomarkers for identifying
exposures. This research will further our understanding of chromatin remodeling, and
provide knowledge for translation into the clinic in the context of improving the outcomes of
patients with MRTs. Furthermore, this knowledge will extend beyond the scope of MRT
patients to the treatment of other cancers with mutations in other members of the SWI/SNF
complex. Finally, dissecting the molecular mechanisms driving MRT development will
provide new insights into the general role of epigenetic changes during human tumor
Chapter2: SNF5/INI1 Deficiency Destabilizes the SWI/SNF Complex During
Malignant Rhabdoid Tumor Development2
2.1 Summary
Malignant Rhabdoid Tumors (MRTs), a pediatric cancer that frequently arises in the
kidney, lack SNF5, a subunit of the SWI/SNF chromatin-remodeling complex. Recent
studies have established that multiple SWI/SNF complexes exist due to the presence or
absence of different complex members. Therefore, we investigated the effect of SNF5 loss
upon SWI/SNF complex formation in human MRT cell lines. We initially observed that
MRT cell lines and primary tumors exhibited reduced levels of many complex proteins.
Furthermore, reexpression of SNF5 in MRT cell lines increased SWI/SNF complex protein
levels without concomitant increases in mRNA. Mass spectrometry analysis of a MRT cell
line before and after SNF5 reexpression indicated the recruitment of different components
into the complex along with the expulsion of others. IP-Western blotting confirmed these
results and demonstrated similar changes in other MRT cell lines. Finally, we found that
reduced expression of SNF5 in normal human fibroblasts led to altered levels of these same
complex members. Our data establish that SNF5 loss during MRT development alters the
repertoire of available SWI/SNF complexes, generally disrupting those associated with
cellular differentiation. Our findings support the model that SNF5 inactivation blocks the
conversion of growth promoting SWI/SNF complexes to differentiation inducing ones.
Therefore, restoration of these complexes in tumors cells may provide an attractive approach
for the treatment of these tumors.
2.2 Introduction
Malignant Rhabdoid Tumors (MRT) are a highly aggressive pediatric cancer
commonly found in the kidneys (RTK) and brain (AT/RT). These tumors have a median
onset of 11 months and 80-90% of children die from the disease within a year of diagnosis
(Roberts and Orkin, 2004). MRTs are characterized by the loss of
SNF5/BAF47/INI1/SMARCB1, a core member of the SWI/SNF complex, hereafter referred
to as SNF5 (Biswas et al., 2009). Interestingly, SNF5 loss does not affect genetic stability in
MRT, but causes epigenetic instability (McKenna et al., 2008a). Thus, this consistent and
specific molecular change, SNF5 inactivation, provides a unique model for understanding the
role of epigenetics in human tumor development. Numerous studies have shown that SNF5
loss affects multiple signaling pathways (Wei and Weissman, 2014). However, little else is
known regarding the etiology of this cancer.
The SWI/SNF complex has multiple variants and is classified by their mutually
exclusive ATPase subunits, BRM and BRG1. BRG1 containing SWI/SNF complexes can be
subdivided into two mutually exclusive groups- BAF180/PBRM1 and BAF250A/ARID1A
containing complexes. While SNF5 appears in all the SWI/SNF complexes, little is known
about the effects of SNF5 loss upon SWI/SNF activity. One previous study by Doan et al.
showed that the SWI/SNF complex appeared intact in MRT cell lines despite the loss of
SNF5 (Doan et al., 2004). They also demonstrated that BRG1-dependent genes did not show
altered expression in MRT cell lines (Doan et al., 2004). However, they did not address the
with chromatin. Other studies have indicated that loss of a SWI/SNF complex member could
affect the stability of other complex members in mammalian cells and in flies(Chen and
Archer, 2005; Curtis et al., 2011; Decristofaro et al., 2001; DelBove et al., 2001; Jung et al.,
2012; Moshkin et al., 2007; Zraly et al., 2006). Furthermore, a growing number of studies
have identified multiple SWI/SNF complexes defined by the presence or absence of different
components (Eaton et al., 2011; Lessard et al., 2007; Tonelli and Wachholtz, 2014; Wade
and Chang, 2014). Importantly, these different complexes can promote either growth or
differentiation depending upon their composition (Ho et al., 2009; Kadoch and Crabtree,
2013; Lessard et al., 2007; Wei and Weissman, 2014).
In order to address whether SNF5 loss affects SWI/SNF complex composition during
MRT development, we examined the effects of SNF5 expression in MRT cell lines. Our
studies demonstrate that re-expression of SNF5 in MRT cell lines altered total protein levels
of many components while knock down of SNF5 in normal human fibroblasts showed the
opposite effect without altering mRNA expression. After SNF5 reexpression, many
components were recruited into SWI/SNF complexes that are generally associated with
induction of differentiation. Therefore, SNF5 loss may promote MRT development by
preventing a switch from SWI/SNF complexes that promote proliferation to those associated
with differentiation. These studies emphasize the need to resolve the scope and composition
of SWI/SNF complexes among different tissues and may account for the low incidence of
these deadly childhood cancers.
2.3 Materials and Methods
Our laboratory previously described the A204.1, D98OR, and G401.6 cell lines (Chai
et al., 2005a; Weissman, 1987; Weissman and Stanbridge, 1980). The MCF-7, A673, Jurkat,
DAOY and RD cell lines were obtained from the American Type Tissue Collection (ATCC).
The TTC642 and TTC549 cell lines were kindly provided from Dr. Timothy Triche,
Children's Hospital of Los Angeles. Dr. Peter Houghton, St. Jude’s Children’s Hospital
kindly provided the BT-12 AT/RT cell line. 293FT cells were kindly provided by Dr. Inder
Verma, Salk Institute. All cell lines were cultured in RPMI 1640 plus 10% fetal bovine
serum (Gibco, Grand Island, NY) and were used within 30 passages of their initial arrival to
minimize chances of cross-contamination.
2.3.2 Adenovirus infection.
The Ad/pAdEasyGFPINI-SV+ adenoviral vectors expressing hSNF5 and
coexpressing green fluorescent protein (GFP; designated Ad-hSNF5) and the
Ad/pAdEasyGFP expressing GFP (designated Ad-GFP) were previously published (Reincke
et al., 2003). To generate adenovirus expressing HA-tagged SNF5, we used the pAdEasy
system (He et al., 1998). We first subcloned the insert from the pMDK225 lentivirus (Kaeser
et al., 2008) expressing SNF5 with a c-terminal triple-HA tag into the pShuttle vector. The
UNC Vector Core generated Ad-SNF5-HA following the pAdEasy system protocol. The
SNF5-HA was sequenced to verify the wild-type gene and the triple HA tag at the
c-terminus. To achieve infection of over 90% of cells, we infected at a multiplicity of infection
(MOI) of 20 for the A204.1 cell line, 10 for the G401 cell lines, 10 for the TTC549 cell line,
and 200 for the TTC642 cell line. Infection of cell lines were carried out as previously
described (Kuwahara et al., 2010).
Isolation of nuclear protein and Western blotting was carried out as described
previously (Chai et al., 2005; DeCristofaro et al., 1999). Western blot analyses for protein
expression were carried out using anti-ß-ACTIN (A2066; Sigma), anti-BAF57 (A300-810A;
Bethyl), anti-BRG1 (A300-813A; Bethyl or G-7; Santa Cruz), anti-BRD7
(A302-304A;Bethyl), BAF170 (A301-038A; Bethyl), BAF200 (A302-229A; Bethyl),
anti-BAF250A 040A; Bethyl), anti-BAF60A 594A; Bethyl), anti-BAF60B
(A301-596A; Bethyl), anti-HA (F-7; Santa Cruz), anti-hSNF5 (A301-087A; Bethyl or 612111; BD
Transduction Laboratories), anti-p21CIP1/WAF1 (AB1; Calbiochem), anti-BAF180 (A2218;
a kind gift from Dr. Ramon Parsons, Columbia University), anti-BAF155 (DXD7; Santa
Cruz), anti-KU70/80 (a kind gift from Dr. Dale Ramsden, University of North Carolina),
anti-Ran (sc-271376; Santa Cruz), anti-c-FOS (H-125; Santa Cruz), anti-H3 (Cat#39163;
Active Motif) and horseradish peroxidase–conjugated anti-rabbit or anti-mouse IgG (GE
Healthcare). Densitometry was carried out using the BioRad Imagelab 4.1 software.
2.3.4 RNA extraction and quantitative real-time reverse transcription–PCR analysis. RNA was extracted using the RNeasy mini kit (Qiagen), and 1 μg was used for cDNA
synthesis primed with random primers (Invitrogen). cDNA was analyzed using TaqMan
(Applied Biosystems) quantitative real-time reverse transcription–PCR (qPCR) analysis, with β-ACTIN as the reference gene in each reaction. Reactions were performed on an ABI 7900
HT sequence detection system (Applied Biosystems), and relative quantification was determined using the 2−ΔΔCt method (Chai et al., 2005a). The following TaqMan gene
expression assay primer/probe sets (Applied Biosystems) were used:
p21CIP1/WAF1-Hs00355782_m1, BAF180/PBRM1-Hs00217778_m1, SNF5/SMARCB1-Hs00268260_m1,
BRD7-Hs04186169_g1, BAF200/ARID2-Hs00326029_m1, BAF170/SMARCC2-Hs00161961_m1,
BAF155/SMARCC1-Hs00268265_m1, BAF57/SMARCE1-Hs00705034_s1,
BRG1/SMARCA4-Hs00946396_m1, BAF60A/SMARCD1-Hs00161980_m1,
β-ACTIN-Hs99999903_m1 (Applied Biosystems).
2.3.5 Immunoprecipitation.
Cells were infected with adenovirus expressing either HA tagged SNF5
(Ad-SNF5-HA) or empty vector (Ad-CMV). Proteins were isolated from the infected cells using IP
buffer (50mM Tris, 400 mM NaCl, 2mM EDTA, 10% Glycerol, 1% NP-40, 0.5% sodium
deoxycholate, 0.1 mM PMSF, 4 mM sodium fluoride, 40 nM sodium orthovanadate, 1x
complete Mini protease inhibitor cocktail (Roche Diagnostics)). The isolated protein was
quantified and adjusted to 500ug/ml. 500 ug of protein from each sample was incubated with
BRG-1 (A303-877A ; Bethyl), or normal rabbit IgG (sc-2027; Santa Cruz Biotechnology) rotating overnight at 4oC with 30 µl of a 50% slurry of protein A/G Sepharose beads. The
beads were then washed 3 times with IP wash buffer (1x PBS, 10% glycerol, 1% Triton) and
then suspended in 1x Nupage LDS loading buffer supplemented with 125mM DTT and
boiled for 5 minutes. The supernatants were then run on 4-12% Bis-Tris polyacrylamide gel,
transferred to PVDF membranes and probed with SNF5, BRG1, BAF155,
anti-BAF180, anti-BAF200, anti-BAF250A, anti-BAF170, anti-BAF60A, or anti-BAF57
(referenced above).
2.3.6 Mass Spectrometry
The determination of SWI/SNF complex components by mass spectrometry was
carried out on immunoprecipitated samples prepared as in the immunoprecipitation protocol
2.3.7 Lentiviral procedures and small hairpin RNA
Lentivirus was generated using 293FT cells following the protocol of Kafri and
colleagues (Xu et al., 2001). Either pLKO.1, a nontargeting small hairpin RNA (shRNA)
control vector (SHC002; Sigma), or SNF5 shRNA lentiviral transduction particles (TRCN
39585 and 39587) were cotransfected with the packing construct ΔNRF (from Dr. Tal Kafri,
University of North Carolina; (Xu et al., 2001)) and the VSV-G envelope expression plasmid
(pMDK64; from Dr. Matthias Kaeser, Salk Institute) into 293FT cells using calcium
phosphate transfection. pLKO.1 is a negative control containing an inert sequence that does
not target any human or mouse gene but will activate the RNAi pathway. For infection, cells
were incubated with lentiviral particles and polybrene and then selected with puromycin.
2.3.8 Inducible SNF5 Cell lines
Flag tagged SNF5 was amplified from an existing plasmid, pcDNA3-fSNF5, by PCR
(T7 promoter F primer, hSNF5 ORF R primer – TTA CCA GGC CGG CGT GTT) (Chai et
al., 2005a). The resulting PCR product was TOPO-cloned into a Gateway vector using the
pCR®8/GW/TOPO® TA cloning kit (45-0642, Invitrogen). The fSNF5 was transferred into
the pINDUCER20 vector that provided a c-terminal HA tag using Gateway® LR Clonase ™
II Plus Enzyme Mix (12538-120, Invitrogen) . The identity of the fSNF5HA insert was
confirmed by DNA sequencing.
2.3.9 ß-galactosidase staining.
To identify ß-galactosidase positive cells, we used the Senescence β-Galactosidase
Staining kit (Cell Signaling #9860). Cells were prepared and stained following the kit
2.3.10 Protein degradation inhibition.
To inactivate the proteasome, cells were treated with 10µM MG132 (1748, Boston
Biochem) or DMSO vehicle control for 6 hours. Cells were harvested and prepared lysates
were analyzed by immunoblotting, as described above.
2.4 Results
2.4.1 SWI/SNF Complex Components Are Post-Transcriptionally Regulated in MRT
Cell Lines.
We first examined whether component protein levels differed between
SNF5-deficient MRT and AT/RT cell lines and SNF5-positive non-MRT cell lines including
pediatric (A673 Ewing sarcoma, DAOY medulloblastoma, and RD rhabdomyosarcoma) and
adult (D98OR Hela derivative, Jurkat acute T cell lymphoma and MCF-7 breast cancer)
tumor cell lines. As expected, we found a clear loss of SNF5 protein in the four MRT cell
lines and one AT/RT cell line in comparison to non-MRT cancers (Figure 2.1A)
(DeCristofaro et al., 1999). We also found no expression of BRM/SMARCA2 protein or
mRNA, consistent with previous reports (Figure 2.1A & B) (Jagani et al., 2010; Yamamichi
et al., 2005) while levels of the other ATPase, BRG1/SMARCA4, appeared similar among
all cell lines. Surprisingly, the other component proteins showed generally lower levels in
MRTs compared to other pediatric and adult tumor cell lines ranging from nearly complete
absence (ARID1A, SMARCC2 and SMARCD2) to moderate reduction (ARID2) (Figure
2.1A).
We next asked whether the reduced protein levels reflected changes in mRNA
expression. Thus, we assessed component mRNA levels using quantitative PCR (qPCR)
SWI/SNF complex members (Wang et al., 2006; Wang et al., 1996). Consistent with the
western blot data, SNF5 mRNA expression was undetectable in MRT cell lines, with the
exception of TTC642, a cell line that contains a nonsense mutation in the SNF5 gene,
(DeCristofaro et al., 1999). In contrast, we could not observe consistent changes in the
mRNAs of other complex components in MRT cell lines that could account for their lower
Figure 2.1 – Decreased SWI/SNF complex protein but not mRNA in MRT cell lines. (A) Total cellular proteins (30 μg) isolated from MRT and non-MRT cell lines were separated on a 4% to 12% SDS-polyacrylamide gel, transferred to PVDF membranes and probed with antiserum against SWI/SNF complex members. We used Ku70/80 as the loading control. (B) RNA was extracted from the indicated cell lines. The mRNA levels were measured for each gene by qPCR and normalized to D98OR β-actin expression. Columns – mean of four independent experiments; Error bars – standard error
A
B
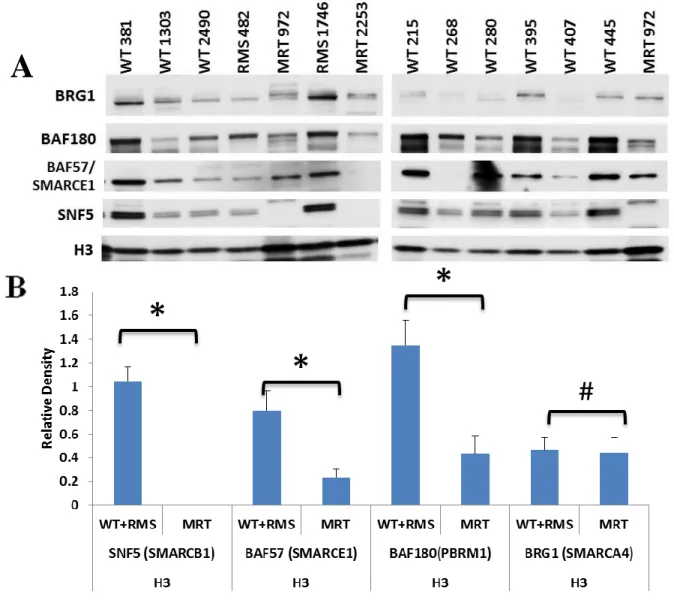
To extend these findings to primary MRTs, we examined protein expression in
nuclear extracts from a series of primary tumors derived from MRTs as well as other prototypical childhood cancers, including Wilm’s tumors (WT), and rhabdomyosarcomas
(RMS) (DeCristofaro et al., 1999). Due to limited amount of starting material, we could only
assess a subset of SWI/SNF components. Protein levels in these nuclear extracts were
normalized to histone H3 protein levels and aggregated by MRT vs non-MRT tumor type.
Loss of SNF5 protein again was apparent in the MRTs compared to the other tumor types
(Figure 2.2A). The average ratio of BAF180 and BAF57 to H3 in MRTs was significantly
lower than in non-MRT samples.while the BRG1 levels remained the similar (Figure 2.2B).
Figure 2.2 – Decreased SWI/SNF complex proteins in primary tumor samples. (A) Nuclear protein (3 μg) isolated from primary tumors were separated on a 4 to 12% Bis-Tris polyacrylamide gel, transferred to PVDF membranes and probed with BRG1, anti-BAF57, anti-SNF5, anti-BAF180, or anti-H3. WT = Wilms’ tumor; RMS =
Rhabdomyosarcoma; MRT = Malignant Rhabdoid Tumor. (B) Densitometry was carried out using Bio-Rad Imagelab 4.1. All values expressed as a ratio to H3. The values were then aggregated by tumor types and averaged. Columns, mean of ratio of each tumor type; Error bars – standard error *,P < 0.05 relative to MRT; #, P > 0.05 relative to MRT using
Student’s T-test .
A
*
*
*
2.4.2 hSNF5 Re-expression in MRT Cell Lines Increases SWI/SNF Complex
Component Levels.
We next examined the effects of SNF5 re-expression on SWI/SNF complex members
in MRT cell lines. To carry out these experiments, we utilized adenovirus to re-express SNF5
in 3 representative MRT cell lines. We examined SWI/SNF complex component protein
expression by Western blotting and mRNA levels by qPCR before and after 24 hours of
doxycycline treatment. We focused on the MRT cell lines, G401, TTC549 and TTC642 and
omitted the soft tissue derived A204 to maintain our focus on renal-derived MRTs. As
shown in Figure 2.3A, we observed a consistent increase in the protein levels of several
components as a result of SNF5 re-expression in all MRT cell lines including BAF180 and
BAF155. In contrast, BRG1 and BAF200 protein levels did not change significantly after
SNF5 reexpression. Other complex members showed differential changes with BAF155
increasing in the G401 and TTC642 cell line and BAF250A showing an increase in the
TTC549 cell line. These findings appear consistent with the observations in primary tumors
(Figure 2.1C) in which SNF5 negative MRTs demonstrated decreased BAF180 and BAF57
levels but not BRG1 in comparison to WT and RMS. Similar to the results in Figure 2.1 A &
B, changes in protein levels did not result from altered mRNA expression (Figure 2.3B),
Figure 2.3 – hSNF5 Re-expression in MRT Cell Lines Increases SWI/SNF Complex
Component Levels. (A) Cells were harvested at time 0 and 24 hours after infection with
Ad-CMV, Ad-GFP or Ad-SNF5-GFP. Total cellular proteins (30 μg) were separated on a 4% to
12% Bis-Tris polyacrylamide gel, transferred to PVDF membranes and probed with indicated
antibody . UN, uninfected control. (B) Cells were harvested at time 0 and 24 hours after
infection with Ad-CMV, Ad-GFP or Ad-SNF5-GFP and RNA extracted from the indicated
cell lines. The mRNA levels were measured for each gene by qPCR and normalized to
β-ACTIN expression at time 0. Columns, mean of four independent experiments; Error bars-
2.4.3 hSNF5 Expression Increases the Complexity of SWI/SNF Complexes.
Our data thus far demonstrated that global SWI/SNF complex component levels
increase following SNF5 over-expression. Next, we determined if this global change is
mirrored within the SWI/SNF complex. To carry out these experiments, we developed a
tet-inducible SNF5 vector using the pINDUCER system (Meerbrey et al., 2011b) to develop
MRT cell lines with inducible SNF5 expression (Figure 2.4). To maximize hSNF5
expression, we first determined the temporal course of induction in the
A204.1pIND20-fSNF5-HA cell line as well as a dose response for doxycycline concentration (Supplementary
Figure 2.1). Based upon these results, we used 1.0 μg/ml doxycycline for maximum
induction of SNF5 for analyses. As shown in Figure 2.4, the tet-inducible cell lines validated
Figure 2.4 – Inducible MRT cell lines. Cells were induced with doxycycline (DOX) at Time 0 and samples were harvest at 24 hours after induction. Total cellular proteins (30 μg)
were separated on a 4% to 12% Bis-Tris polyacrylamide gel, transferred to PVDF
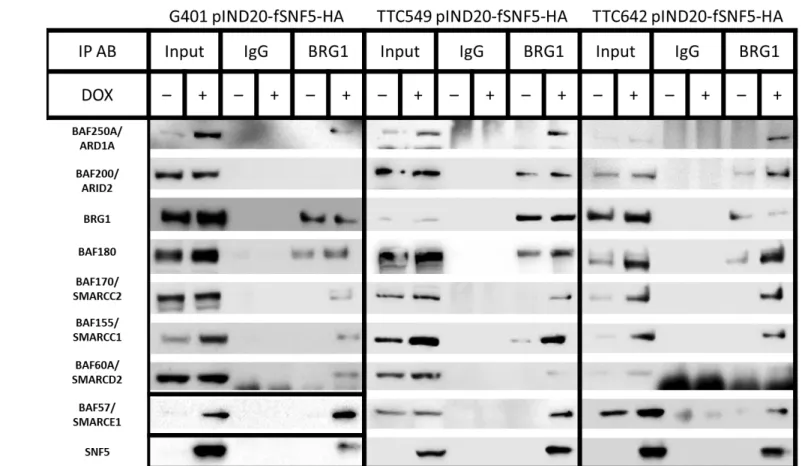
To determine the composition of the SWI/SNF complex in the presence and absence
of SNF5, we initially carried out mass spectrometry on the TTC642 cell line. We isolated
SWI/SNF complexes from this cell line +/- SNF5 from whole cell lysates by
immunoprecipitation with an antibody against BRG1. Because the MRT cell lines cell lines
used in this study do not express the mutually exclusive BRM ATPase (Figure 2.1A),
functional complexes must possess the BRG1 ATPase. As shown in Figure 2.5A,
reexpression of SNF5 resulted in the incorporation of the other components with increased
overall expression.
In order to confirm the semi-quantitative mass spectrometry results, we assessed
individual component protein levels by Western blotting after immunoprecipitation with our
BRG1 antibody. Because BRG1/SMARCA4 levels did not change or are decreased after
SNF5 reexpression (Figures 2.3 and 2.4), we used the ratio of complex subunits to BRG1 to
measure changes in component levels within the complex. Whole cell protein extracts from
MRT cell lines, G401.6, TTC549 and TTC642 cells, either untreated or induced with doxycycline for 24 hours, were harvested, immunoprecipitated with α-IgG or α-BRG1
antibodies and Western blotted to determine the protein levels of BRG1 and other complex
members.
While the overall levels of most component proteins increased, BRG1 levels either
remained the same or decreased after SNF5 reexpression (compare Input lanes in each cell
line in Figure 2.5B). Furthermore, without the confounding issue of viral infection, we found
increased expression of BAF57 and BAF170 in all cell lines. As shown in Figure 2.5B, the
ratio of most component proteins to BRG1 increased in all MRT cell lines after SNF5
and BAF170/SMARCC2 were absent from the complex in the absence of SNF5. Other
components showed a differential pattern among the cell lines. For example, the complexes
in the TTC549 and TTC642 cell lines contain BAF200/ARID2 after SNF5 reexpression
while it is absent in complexes from the G401 cell line. Therefore, the increased component
protein levels observed in MRT cell lines after SNF5 reexpression coincides with increased
A
Figure 2.5 –SWI/SNF complex composition changes after SNF5 re-expression. (A) The relative abundance of SWI/SNF complex components in the absence (untreated) and presence (Dox) of SNF5 in the TTC642 cell line was determined by mass spectrometry. Each data point is the average of 2 technical replicates of 2 biological replicates. (B) The indicated cell lines (A-C) were induced with doxycycline, and the samples were immunoprecipitated with either rabbit IgG or anti-BRG1. IP samples were then separated on a 4% to 12% Bis-Tris polyacrylamide gel, transferred to PVDF membranes and probed with the indicated antibodies.
40
2.3.5 Inhibition of SNF5 Expression in Normal Human Fibroblasts Causes Reduced
Complex Component Expression.
While our studies indicated that restoration of SNF5 in MRT cell lines increased
expression of SWI/SNF complex components, they did not address whether SNF5 loss in
normal cells would lead to decreased protein levels. To address this issue, we infected
normal human fibroblasts (NHF-1) with 2 different shRNAs against SNF5 and assessed
component mRNA and protein levels. Because the cell of origin for MRTs remains
unknown, we used NHFs as a well-characterized normal human cell line model. As shown
in Figure 2.6A, we achieved an approximately 80% decrease in SNF5 expression 48 hours
after lentiviral infection with 2 different shRNAs. We observed a similar decrease in
BAF180 protein levels only after expression of the shRNA against SNF5. The non-targeting
shRNA control, pLKO.1, did not show any effect. However, similar to our results with the
MRT cell lines, the change in component protein levels did not mirror its mRNA expression
(Figure 2.6B). We also observed an increase in p21 protein levels with either the
non-targeting control or shSNF5 expression suggesting a stress response after lentiviral infection. However, using β-galactosidase staining, we observed senescence only in the cells with
Figure 2.6 – Reduction of BAF180 protein levels after inhibition of SNF5 in normal
human fibroblasts. (A)SNF5 knockdown cells were generated by infecting normal human
fibroblasts (NHF-1) with lentivirus expressing 2 different shRNAs against SNF5 (TRCN
39585 and TRCN 39587) or a non-targeting shRNA control (pLKO.1) and immediate
selection with puromycin. After 72 hrs. on selective medium, total cellular protein (30 μg),
separated on a 4% to 12% Bis-Tris polyacrylamide gel, transferred to PVDF membranes and
probed with anti-SNF5, anti-BAF180, or anti-KU70/80 antibodies.(B) RNA was extracted
from the SNF5 knockdown cells generated as in part A. The mRNA levels were measured for each gene by qPCR and normalized to β-ACTIN expression at time 0. Columns, mean of
four independent experiments; Error bars – standard error. (C) Knockdown of SNF5 in
NHF-1 cells results in senescence. SNF5 knockdown cells were generated by infecting normal
human fibroblasts (NHF-1) with lentivirus expressing 2 different shRNAs against SNF5
(TRCN 39585 and TRCN 39587) and immediate selection with puromycin. After 72 hrs. on
selective medium, the cells were stained using a senescence β-Galactosidase cell staining
protocol (Cell Signaling).
2.3.6 SWI/SNF complex components are degraded in a proteasome-independent
mechanism
The levels of many cellular proteins are regulated through ubiquitination and
subsequent degradation via the proteasome machinery (Asher et al., 2006). To confirm a
posttranscriptional change in component levels in the MRT cell lines, we examined the
effects of MG132, a potent proteasome inhibitor, on protein expression in TTC642 cell lines
(Lee and Goldberg, 1998).
We treated the cell lines with DMSO or 10uM MG132. After 6 hrs., we assessed
representative SWI/SNF complex members as well as c-FOS (positive control) and RAN
(negative control/loading control) protein levels by Western blotting. As shown in Figure
2.7A, MG132 treatment either increased expression (BAF180) or augmented the increase
after SNF5 re-expression (BAF250A and SNF5).
We then asked whether MG132 treatment would restore BAF250A and BAf180
expression after SNF5 knockdown in NHF-1 cells. Figure 2.7B shows that exposure to
MG132 increased BAF180 levels after SNF5 knockdown by 2 different shRNAs. However,
BAF250A levels were unaffected. The pLKO.1 lentivirus served as a negative control. These
results implicate proteasome-dependent mechanism in lowering some component protein
Figure 2.7 – SWI/SNF complex components are degraded in a proteasome-independent mechanism. (A) The TTC642
pINDUCER20-fSNF5-HA cell line, +/- SNF5 expression, were treated with DMSO or 10uM MG132 for 6 hrs. After protein
isolation, protein levels for BAF180/PBRM1, BAf250A/ARID1A, c-ROS and RAN were detected by SDS-PAGE and Western
blotting as previously described (Chai et al., 2005a). c-FOS served as a positive control for inhibition while Ran, unaffected by
MG132 treatment, served as a loading control (B) NHF-1 hTert cells were infected with indicated lentivirus and placed in selective
media for 3 days. Then the samples were treated with MG132 for 6 hours before harvesting. After protein isolation, protein levels for
BAF180/PBRM1, BAF250/ARID1A, SNF5/SMARCB1 and Ku were detected by SDS-PAGE and Western blotting.