CORTICAL DIAGNOSTICS: MEASURING BRAIN HEALTH THROUGH SOMATOSENSATION
!!
!!
!
Eric Francisco
!!
!!
!
A dissertation submitted to the faculty of the University of North Carolina at Chapel Hill in partial fulfillment of the requirements for the degree of Doctor of Philosophy in the School of
Medicine (Biomedical Engineering)
!!
!!
!
Chapel Hill 2014
!!
!!
!
Approved by:
Mark Tommerdahl
Robert Dennis
Oleg Favorov
Richard Gracely
!
!
!
!
!
!
!
!
!
!
!
!
!
!
!
!
!
!
!
!
!
!
!
!!
!!
!
!
ABSTRACT
!
Eric Francisco: Cortical Diagnostics: Measuring Brain Health through Somatosensation (Under the direction of Mark A Tommerdahl)
!
Overall the past several years, a number of unique quantitative tactile based sensory testing methods were designed with the intent of obtaining objective metrics that would be sensitive to alterations in cortical information processing. The design of these tasks was based on information obtained from neurophysiological studies of the nonhuman primate (NHP) cerebral sensory cortical response to a variety of modes of natural skin stimulation, and these NHP studies typically exhibit characteristics of cortical modularity, or cortical-cortical dynamics that occur between adjacent and near-adjacent assemblies of cortical neurons. The initial goal of these studies was to demonstrate cortical correlates of perception by comparing
observations of stimulus evoked activity in primary somatosensory cortex of non-human primates, and a secondary goal was to demonstrate that these measures of sensory perception were altered in a predictable fashion with neurological insult. To date, observations consistent with systemic cortical alterations have been made in individuals with neurotrauma (concussion/ TBI, stroke), neurodevelopmental disorders (Autism, ADHD, Tourette’s, OCD) and chronic pain (migraine, fibromyalgia, VVS, TMJD, carpal tunnel syndrome). One unifying theme of these findings is the role that cortical modularity plays in sensory information processing and that when cortical modularity is disrupted, significant quantifiable deficits in sensory information processing can be detected.
!
!!
!!
!!
TABLE OF CONTENTS
!
LIST OF FIGURES ...viii
LIST OF ABBREVIATIONS ...x
INTRODUCTION ...1
CHAPTER 1: CM4: A FOUR-POINT VCA BASED VIBROTACTILE STIMULATOR ...3
Overview ...3
Introduction ...4
Methods ...5
Hardware ...5
Software ...7
Protocols ...8
Subjects ...9
Experimental Procedure ...9
Analysis ...11
Results ...12
Discussion ...14
CHAPTER 2: VIBROTACTILE AMPLITUDE DISCRIMINATION CAPACITY PARALLELS MAGNITUDE CHANGES IN SOMATOSENSORY CORTEX AND FOLLOWS WEBER’S LAW ...18
Overview ...18
Introduction ...18
Methods ...21
Results ...23
NOVEL STIMULUS PARADIGMS ...32
CHAPTER 3: RATE DEPENDENCY OF VIBROTACTILE STIMULUS MODULATION ...34
Introduction ...34
Results ...36
Discussion ...42
Conclusions ...46
Experimental procedures ...47
CHAPTER 4: TACTILE DISCRIMINATION OF DURATION & AMPLITUDE ...50
Overview ...50
Introduction ...51
Results ...54
Duration discrimination follows Weber’s law. ...54
Impact of an amplitude confound on duration discrimination ...55
Impact of the location of the amplitude confound ...56
Amplitude confound impact on concussed individuals ...57
Stimulus duration impacts amplitude discriminative capacity ...58
Discussion ...59
Experimental Procedure ...63
Duration discrimination ...64
Duration discrimination with an amplitude confound ...65
Amplitude discrimination with a duration confound ...67
Pilot Concussion Study ...67
CHAPTER 5: THE IMPACT OF NON-NOXIOUS HEAT ON TACTILE INFORMATION PROCESSING ...69
Overview ...69
Introduction ...69
Results ...71
Impact of temperature on dual-site conditioning ...75
Summary and general discussion ...76
Experimental Procedures ...82
Detection Threshold ...84
Amplitude Discrimination ...85
Amplitude Discrimination with Adaptation ...86
Dynamic Tracking of Adaptation ...86
APPLICATIONS ...88
CHAPTER 6: THE ROLE OF CORTICAL MODULARITY IN TACTILE INFORMATION PROCESSING: AN APPROACH TO MEASURING INFORMATION PROCESSING DEFICITS IN AUTISM ...90
Background ...90
Cortical modularity and spatial localization ...91
Cortical modularity and adaptation ...98
Cortical modularity and synchronization ...102
Interim Summary ...107
The role of sub-threshold stimulus-evoked inhibition ...107
Temporal integration: Rate dependent modulation of vibrotactile stimuli ...110
Generating an individual CNS profile from multiple measures ...111
Conclusions ...112
CHAPTER 7: ALTERED CENTRAL SENSITIZATION IN WOMEN WITH VULVODYNIA ...114
Overview ...114
Introduction ...115
Materials and Methods ...116
Static detection threshold ...119
Dynamic detection threshold ...120
Amplitude discrimination at baseline ...120
Amplitude discrimination with single-site adaptation ...121
!
Analysis ...122
Results ...122
Detection Thresholds ...122
Dynamic Tracking with Adaptation ...127
Discussion ...128
CHAPTER 8: SOMATOSENSORY INFORMATION PROCESSING IN THE AGING POPULATION ...135
Overview ...135
Introduction ...136
Material and Methods ...137
Reaction Times ...139
Static detection threshold ...140
Dynamic detection threshold ...141
Amplitude discrimination at baseline ...141
Adaptation metric ...142
Analysis ...143
Results ...143
Vibrotactile detection threshold increases with age ...147
Discussion ...151
FUTURE DIRECTIONS ...156
Protocols ...156
Imaging ...158
Neuroinflammation ...160
Pain ...167
!!
!!
!!
LIST OF FIGURES
Figure 1.1: Four Site Vibrotactile Stimulator ...7
Figure 1.2: Schematics of Finger Agnosia Protocols ...12
Figure 1.3: Impact of Conditioning on Finger Agnosia Task ...14
Figure 1.4: Percent Inaccuracy on Finger Agnosia with 100 μm Conditioning Stimuli ...15
Figure 2.1: Schematic of the Protocol Used for Amplitude Discrimination ...22
Figure 2.2: Averaged Difference Limen Values at Various Standard Amplitudes ...24
Figure 2.3: Difference Limens Plotted as Percent Difference ...25
Figure 2.4: Correlating Data with Optical Imaging ...26
Figure 3.1: Summary of Average Difference Limens ...37
Figure 3.2: Linearity of Averaged Difference Limens ...38
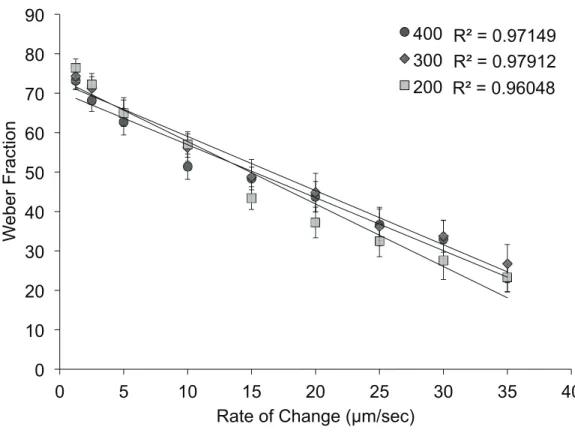
Figure 3.3: Correlation of Amplitude Modulation Rate to Weber Fraction ...39
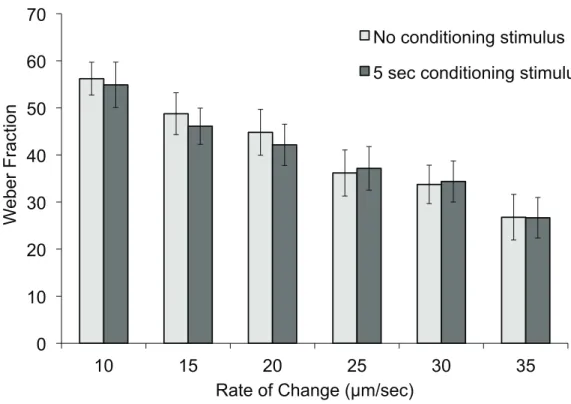
Figure 3.4: Impact of Pre-Conditioning on the Matching Task ...40
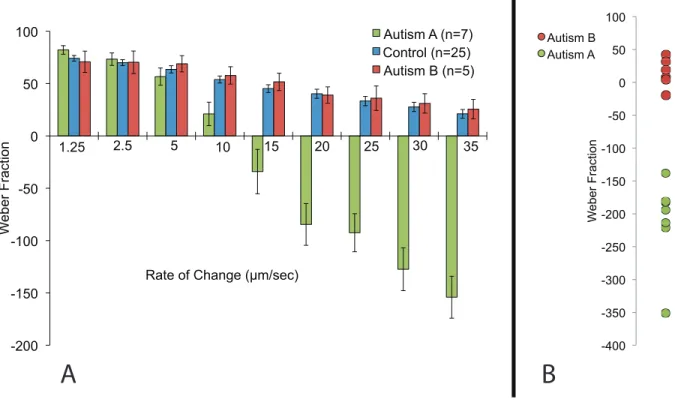
Figure 3.5: Comparison of Data Obtained from Controls vs. Individuals with Autism ...41
Figure 3.6: Amplitude Matching Protocol. ...48
Figure 4.1: OIS Pictorialization. ...52
Figure 4.2: Adherence to Weber’s Law ...54
Figure 4.3: Effect of Amplitude Confound on Duration Discrimination ...55
Figure 4.4: Impact of the location of the Amplitude Confound ...56
Figure 4.5: The Impact of the Amplitude Confound on Concussed ]Individuals ...57
Figure 4.6: Effect of Duration Confound on Amplitude Discrimination. ...58
Figure 4.7: Schematics of the Duration Discrimination Protocol ...64
Figure 4.8: Schematics of the Amplitude Confound applied to Duration Discrimination 66 ... Figure 5.1: Vibrotactile Detection Thresholds under Three Temperatures ...72
Figure 5.2: Difference Limens Obtained with Two Amplitude Discrimination Protocols ...73
Figure 5.3: Effects of Temperature on Dual-Site Conditioning. ...75
Figure 5.5: Schematics of the Protocols Used in this Study ...84
Figure 6.1: Summary of Minicolumnar RF Organization in SI Somatosensory Cortex ...93
Figure 6.2: Summary of OIS Evoked Responses in SI cortex ...94
Figure 6.3: Spatial Localization of Adapting Stimulus Duration in Autism ...95
Figure 6.4: Radial Histograms of SI cortical Activity Across Subjects ...96
Figure 6.5: Comparison of Amplitude Difference Thresholds to Adaptation ...100
Figure 6.6: Comparison of Difference Limens Normalized to the Unadapted Condition 101 .... Figure 6.7: TDT and TOJ Performance Metrics with/without 25 Hz Conditioning ...105
Figure 6.8: Extracellular Recordings Obtained from SI in the Squirrel Monkey ...106
Figure 6.9: Visual Representation of Feed Forward Inhibition ...107
Figure 6.10: Static Thresholds vs. Dynamic Thresholds using a Ramping Stimulus. ...108
Figure 6.11: Difference Limens for Various Rates of Amplitude Modulation ...110
Figure 6.12: Principal Component Analysis ...112
Figure 7.1: Images of the Multi-Site Vibrotactile Stimulator. ...117
Figure 7.2: Schematics of the Protocols Used in this Study. ...118
Figure 7.3: Summary of Group-Averaged Vibrotactile Detection Thresholds ...123
Figure 7.4: Comparison of Weber‘s Fraction with/without Conditioning ...124
Figure 7.5: Percentage Change with Adaptation on Amplitude Discrimination ...126
Figure 7.6: Comparison of the Group-Performance on Dynamic Tracking ...127
Figure 8.1: Images of the Multi-Site Vibrotactile Stimulator ...138
Figure 8.2: Schematics of the Protocols Used in this Study ...142
Figure 8.3: Summary of the Group-Averaged RTs for Six Age Groups ...144
Figure 8.4: Summary of Group-Averaged RTs Plotted Against Mean Age ...145
Figure 8.5: Variability in Reaction Times Across Six Age Groups ...146
Figure 8.6: Summary of Group-Averaged Vibrotactile Detection Thresholds ...147
Figure 8.7: Comparison of the Predicted and Observed Dynamic Thresholds ...148
Figure 8.8: Ratio of Dynamic vs. Static Thresholds ...149
!!
!!
!!
LIST OF ABBREVIATIONS
!
2AFC Two-alternative forced choice 4AFC Four-alternative forced choice ABS Acrylonitrile butadiene styrene
ADHD Attention deficit and hyperactivity disorder ADI-R Autism diagnostic interview - revised
ADOS-G Autism diagnostic observation schedule - generic ANOVA Analysis of variance
ASD Autism spectrum disorder CNC Computer numeric control CNS Central nervous system
DAQ Data aquistion
DL Difference limen
EEG Electroencephalography FDM Fused deposition modeling
fMRI Functional magnetic resonance imaging GAD Glutamic acid decarboxylase
GABA γ-Aminobutyric acid
MEG Magnetoencephalography msec milliseconds
mTBI Mild traumatic brain injury NMDA N-methyl-D-aspartate
NMDAR N-methyl-D-aspartate receptor
NHP Non human primate
OCD Obsessive compulsive disorder OIS Optical intrinsic signal
PC Personal computer
PCA Principal component analysis
RF Receptive field
RMS Root mean squared
SI Primary somatosensory cortex SD Standard deviation
SCAT-2 Sports concussion assessment tool-2
SE Standard error
TBI Traumatic brain injury TD Typically developing
TDT Temporal discriminative threshold TMJD Temporomandibular joint disorder TOJ Temporal Order Judgment
VCA Voice coil actuator
VVS Vulvar vestibulitis syndrome
WASI Wechsler Abbreviated Scale of Intelligence
WF Weber fraction
!!
!!
!!
INTRODUCTION
!
A large number of neurological disorders (developmental, degenerative, or trauma induced) are difficult to diagnose or assess, thus limiting treatment efficacy and overall
understanding. Existing solutions and products attempting to fill this gap are costly, extremely slow, often invasive, and in many cases fail to definitively (and quantitatively) diagnose or assess treatment. The somatosensory system is ideally suited for the design of a CNS diagnostic system. First, the organization of the system is such that adjacent skin regions project to adjacent cortical regions (i.e., it is somatotopic). Second, ambient environmental noise in the system can be easily controlled (i.e., it is less likely that a patient will be exposed to distracting tactile input than auditory or visual input). Third, the somatosensory system is the only sensory system that is highly integrated with the pain system, and this is often an important aspect of a patient’s diagnosis. The diagnostic system our lab has developed delivers a battery of somatosensory-based tests that are conducted rapidly, much like an eye exam with verbal feedback. Neuro-adaptation, functional connectivity (e.g., cortical synchronization), and feed-forward inhibition are just a few of the cortical mechanisms that can be quantified using
somatosensory testing protocols. Many of these protocols leverage tactile illusions which act as confounds on top of a basic somatosensory test, allowing each subject to serve as his or her own control. Design and validation of the perceptual metrics is accomplished via correlative studies that compare non-invasive observations of human sensory percepts with non-human primate neurophysiological studies.
information on how the cortex responds to tactile stimuli, through electrode/OIS studies on animals; simple somatosensory testing that correlate well with the data provided from their imaging studies; and development/improvement of the portable vibrotactile stimulator used in the majority of our experiments. The goal of this dissertation is to show how somatosensory testing can be improved through novel testing methods that are targeted at providing new diagnostic information about how the cortex functions, in the typically developing and those with neurological deficits.
The first 2 chapters of this dissertation show the foundations of current somatosensory testing. The first chapter outlines the design and improvement of the vibrotactile stimulator we use to deliver vibrations to our subjects fingertips. This device is constantly evolving into a more portable, more user friendly, and more powerful diagnostic device. The technological advancements outlined in the first chapter allowed the new novel testing paradigms, seen in chapters 3, 4, &5, to be designed and executed. The second chapter explores amplitude
discrimination and its compliance to Weber’s Law in the tactile modality. This paper showcases a rather simple method of measuring a subjects discriminative capacity to different intensity stimuli and how data obtained from subjects correlate with classic psychophysical principles (Weber’s Law) and animal data acquired under similar testing conditions.
!!
!!
!
!
CHAPTER 1: CM4: A FOUR-POINT VCA BASED VIBROTACTILE STIMULATOR 1
!
Overview
Current methods for applying multi-site vibratory stimuli to the skin typically involve the
use of multiple, individual vibrotactile stimulators. Limitations of such an arrangement include difficulty with both positioning the stimuli as well as ensuring that stimuli are delivered in a synchronized and deliberate manner. Previously, we reported a two-site tactile stimulator that was developed in order to solve these problems (Tannan et al., 2007a). Due to both the success of that novel stimulator and the limitations that were inherent in that device, we designed and fabricated a four-site stimulator that provides a number of advantages over the previous
version. First, the device can stimulate four independent skin sites and is primarily designed for stimulating the digit tips. Second, the positioning of the probe tips has been re-designed to provide better ergonomic hand placement. Third, the device is much more portable than the previously reported stimulator. Fourth, the stimulator head has a much smaller footprint on the table or surface where it resides. To demonstrate the capacity of the device for delivering tactile stimulation at four independent sites, a finger agnosia protocol, in the presence and absence of conditioning stimuli, was conducted on seventeen healthy control subjects. The study
demonstrated that with increasing amplitudes of vibrotactile conditioning stimuli concurrent with the agnosia test, inaccuracies of digit identification increased, particularly at digits D3 and D4. The results are consistent with prior studies (Tommerdahl et al. 2007) that implicated synchronization of adjacent and near-adjacent cortical ensembles with conditioning stimuli in impacting TOJ performance.
This chapter previous appeared in the Journal of Neuroscience Methods. The original citation is as follows: 1
Introduction
For the past several years, our research group has been working towards the development
of a portable tactile stimulator that could effectively be used to study changes in sensory information processing in clinical and clinical research venues across a diverse spectrum of neurological disorders. Thus far, we have gone through several iterations in the development of this stimulator. The first prototype of the device (Tannan et al., 2005a) was used to
The utility of this device has been recently reported in a paper that reported phenotypic differences within a spectrum of patients with vulvodynia (Zhang et al., 2011), and in a paper that describes its utility for describing phenotypic differences within the autism spectrum via modulating vibrotactile stimuli (i.e., sinusoidal stimuli that dynamically change in amplitude), but the device itself, as well as a demonstration of its capability to deliver four-digit protocols, has not been fully described, which is the purpose of this report. In a subsequent paper, a magnet-compatible version of this device will be reported.
Methods Hardware
The Cortical Metrics (CM-4; see Figure 1.1) stimulator was developed in our laboratories
for use in series of experiments such as those described in this report. The system was designed using state-of-the-art rapid manufacturing technology to allow multiple identical systems to be built and used in different locations. Also, the use of rapid manufacturing permitted very rapid design evolution, thereby potentiating the production of special fixtures and changes to geometry as needed for special applications. The device consists of two
separate parts: the main body and a detachable head unit. The flat plates of all exterior housing and other components of approximately planar geometry are direct manufactured using laser-machined 6 mm acrylic sheet, cut on a 120 Watt CO2 laser engraving system, model number X660 (Universal Laser Systems, Scottsdale, AZ). The more complex housing and internal
mechanism components are direct manufactured from ABS plus, by fusion deposition modeling (FDM) on a StrataSys Dimension bst 1200es (StrataSys, Inc., Eden Prairie, MN). The cylindrical trays forming the disks of the head unit are CNC machined from 1" thick Acetal (Delrin) plate. All housing and mechanism components and assemblies were solid modeled prior to
fabrication using SolidWorks solid modeling software (SolidWorks Corporation, Concord, MA). The internal mechanism of the head unit is comprised of identical cylindrical disks placed
sideways and four abreast (130 mm in diameter, 11 mm in depth) between two plastic
test subject. A voice coil actuator (VCA) and an optical position sensor are mounted in each disk. Each VCA is attached to a plastic probe (5 mm diameter) which slightly protrudes through a hole (7 mm diameter) in the side of the cylinder. The amount of protrusion for each probe is independently adjustable as are the positions of the holes to accommodate the length of the subject’s fingers. The VCAs drive the plastic stimulator probe tips according to prescribed sinusoidal waveforms. The moving components of the stimulator tips are directly
manufactured from Polycarbonate (PC) by 3-D FDM as a single compliant mechanism
component integrating a mounting flange, a thin-beam four-bar linkage, a magnet coil bobbin, an optical displacement sensor vane, and the extension to the mechanical stimulator tip. The compliant four-bar linkage mechanism allows the coil, optical position sensor vane, and tip to be displaced vertically along a straight line for a distance of ±1 mm. The 4-bar compliant mechanism also provides a very low hysteresis linear restoring force to center each tip vertically when no current is applied to the VCA coil. The VCA coil is 400 turns of 34 AWG magnet wire (approximately 30 Ohms total resistance), wrapped in a rectangular bobbin
permanently solvent bonded into the four-bar mechanism. The entire four-bar mechanism is 5.3 mm in thickness, and is positioned such that the VCA coils sit directly between two opposed rectangular N42 rare-earth-element magnets (catalog number BCC2, K & J Magnetics, Jamison, PA) similar to those found in computer hard drives. The resulting VCA motors generate
extremely linear force outputs as a function of drive current with very low hysteresis due to the “frictionless” nature of the single-piece bearing-less four-bar compliant mechanism. The
Figure 1.1: Four Site Vibrotactile Stimulator
Each of the four probe tips is positioned by rotating the four independently positioned drums to maximize contact between finger pads and the stimulator tips. During an experimental session, subjects were seated comfortably in a chair with their arm resting on the arm rest attached to the head unit of the device. Digits D2 through D5 were then positioned for vibrotactile stimulation.
!
The custom electronics were designed using free CAD software from ExpressPCB (www.expresspcb.com). The printed circuit boards were manufactured using the resulting CAD files, also by ExpressPCB. The hybrid circuit includes signal amplifiers for the position sensors, an analog controller to allow either “force” or “position” control of each VCA motor and tip, a tunable analog PID controller for position control of each tip, and a bipolar push-pull high-current op-amp output stage to drive each VCA motor. This hybrid circuit is interfaced via four parallel pin connectors (2 banks of 50 pins for digital signals and 2 banks of 34 pins for analog signals) to an internal NI-USB-6259 data acquisition (DAQ) board. The DAQ board then
interfaces via a USB connection to any standard PC running Microsoft Windows XP or later. Software
A custom line-of-business application was developed for the Microsoft .Net platform
control the stimulator and administer the data collection protocols. The interface was designed to be intuitive, extensible, and aesthetically pleasing. The software needed to be extensible to facilitate the development of future protocols for a device as flexible as the CM-4. The core extensibility was achieved by using a “plugin” architecture with a shell application whose function is to discover, load and execute small plugins. The shell exposes a software contract (an inheritable C# class) that is consumed and extended by each plugin. Each task described in this paper represents one such plugin. Most traditional neuropsychological protocols using the standard X-alternative forced-choice (X-AFC) tracking method (Cornsweet, 1962) can be created with only a couple dozen lines of C# code. While most plugins interact directly with the CM-4 stimulator, this is not a requirement of the plugin contract. Plugins can, for example, be designed to collect arbitrary subject information pertinent to the given study (e.g., participant demographics, relevant medical history, various surveys, etc.). The net effect is not only a significant reduction in the amount of clinical paperwork that needs to be completed by each participant, but also a marked reduction in data-entry time for clinicians. All data collected by the application are stored in an encrypted (128-bit RC4) SQLite database in a user-specified location. Each database can be shared with multiple instances of the shell application, providing a mechanism for seamless networking of CM-4 stations (Holden, et al. 2011). The software is also capable of storing, as well as creating and customizing, all relevant initialization
information for each plugin, such that a given battery of protocols can be administered repeatedly and in a consistent manner, while maintaining flexibility for future projects. The batteries allow for greater reuse of each plugin, resulting in shorter development times a more efficient workflow throughout an experiment.
Protocols
In order to demonstrate exemplary use of the CM-4, a finger agnosia test, in the presence
similar to tactile finger recognition or localization tests (Boll, 1974; Reitan and Wolfson, 1993) utilized in current neuropsychological diagnostics.
Subjects
Seventeen healthy subjects (8 males and 9 females), ranging from 22 to 57 (39.1±2.9)
years of age, were recruited for the study. None of the subjects reported any
neuropsychological impairment and all were naïve to both the study design and issue under investigation. The study was performed in accordance with the Declaration of Helsinki, all subjects gave their informed consent, and the experimental procedures were reviewed and approved in advance by an institutional review board.
Experimental Procedure
During an experimental session, the subjects were seated comfortably in a chair with the
right arm resting on the device. Because the lengths of fingers typically vary among subjects, the positions of the probe tips were individually adjusted to ensure that they contacted the glabrous, padded tips of the fingers of each subject. These loci were chosen in order to allow the convenience of access and comfort of participants as well as for the wealth of
neurophysiologic information that exists for the corresponding somatotopic regions of cortex in primates (Chen et al., 2003, 2007, 2009; Francisco et al., 2008; Friedman et al., 2008; LaMotte and Mountcastle, 1975; Mountcastle, 1969; Tommerdahl et al., 1993, 1998, 2002, 2005, 2006, 2010). As depicted in Figure 1.1, probe tip positioning was accomplished by loosening a set screw and rotating each of the drums independently to conform to the natural hand shape of each subject. After proper positioning, if the probe tips still failed to make proper contact with the digits, the tips themselves were either raised or lowered. Once adjusted, the probe tips were locked in place prior to initiation of the battery so that they would remain immobile during testing. At the start of each run, the four tips were driven towards the tips of the fingers in order to ensure good contact with the skin.
During the assessment, the device delivered constant-amplitude sinusoidal skin
contact with the tips of the index (D2), middle (D3), ring (D4), and little (D5) fingers of the right hand. The independent probe tips were computer-controlled and capable of delivering a wide range of vibrotactile stimulation of varying frequencies (Hz) and amplitudes (μm). Stimulus
parameters were specified by test algorithms that were based on specific protocols as well as subject responses during those protocols.
Subjects viewed a computer monitor that provided continuous visual cueing during the
experimental session. Specifically, an onscreen light panel indicated to the participant when stimuli were being delivered and when subjects were to respond. Training trials were not included prior to testing, and the subjects were not given performance feedback or knowledge of the results during data acquisition. The sensory testing session was conducted by
application of low frequency (25 Hz) vibration to selected fingers. Each battery of testing lasted between 15 and 20 minutes depending on the protocols being run and on subject performance. Each individual protocol typically lasted 2 to 3 minutes.
Finger Agnosia Protocol
Finger agnosia tests are typically utilized to diagnose the ability of subjects to recognize
and identify stimulated digits (Boll, 1974; Reitan and Wolfson, 1993). In order to assess the ability of the subject to discriminate one digit from another, a four-alternative forced-choice (4-AFC) protocol was implemented. Figure 1.2 represents a timeline for the finger agnosia
protocols evaluated. The device delivered a short pulse or tap (300 μm, 25 Hz, 40 ms) to one of
the four digits in a pseudo-random order on a trial-by-trial basis, and subjects were queried as to which digit was stimulated (Figure 1.2). The simple test was used in order to determine baseline values for each subject. A more complex agnosia test was subsequently administered in which test stimuli were delivered to the skin as a tap as in the previous test (300 μm, 25 Hz,
40 ms), but in the presence of conditioning stimuli at variable amplitudes. In each case, a 25 Hz, 500 ms conditioning stimulus was delivered to all four digits at one of four amplitudes: 30, 40, 50, and 100 μm. The conditioning stimulus was delivered 500 ms prior to, and 500 ms
which finger was perceived to have received the large amplitude tap by choosing the respective digit on an image of the dorsal side of a hand presented on a computer monitor. Test stimuli sites were pseudo-randomized on a trial-by-trial basis. The subjects were assessed on their accuracy over a total of 16 trials (4 trials for each digit as the test stimulus).
Analysis
For the finger agnosia protocols, accuracy percentages were calculated by analyzing the
ratio of correct to total responses of the subjects. Percent accuracies were trial-independent and reflected accuracies across all 16 trials. The 100 μm conditioning condition was chosen for
further analysis because of the significantly lower percent accuracy compared to the simple agnosia task. Percent inaccuracies were quantified for the 100 μm conditioning stimulus by
calculating the frequency at which digits were incorrectly chosen. Results were calculated in this manner in order to compare percent inaccuracies with difference limens (DLs), where lower value might suggest higher accuracies and increased discriminative capabilities. The data were analyzed for significance by calculating p-values across mean inaccuracy metrics for each digit. Histograms were plotted in order to visualize the differences among each of the digits with respect to standard error of the means. Statistical t-tests were used to evaluate the difference of the performance of each subject under different conditions. A probability value of less than 0.05 was considered statistically significant.
Auditory Cue Analysis
To ensure that the stimulator did not produce any audible clues during the agnosia task,
an auditory output analysis was conducted using a standard USB microphone and the open source software suite Audacity. The microphone was placed on a table 31 cm from the
stimulator head unit. Four one-second recordings were created with each condition consisting of an initial 250 ms period of silence followed by a single-channel 300 μm 25 Hz sinusoidal
Success Criteria 1.4.7. This tool was used to calculate the RMS amplitude in decibels (dB) during each vibration and period of silence.
!
Figure 1.2: Schematics of Finger Agnosia Protocols
The simple finger agnosia assessment (top panel) consisted of a 4AFC protocol where a short test (T) pulse (300 μm, 25 Hz, 40 ms) was delivered to one of the four digits followed by a subject response interval (RI). The finger agnosia test was also conducted in the presence of conditioning stimuli of amplitudes 30, 40, 50, or 100 μm (bottom panel). The conditioning stimulus was delivered 500 ms prior to, and 500 ms following, the tap of the test digit. For all finger agnosia tasks, subjects indicated which finger was perceived to have received the large amplitude tap by choosing the respective digit on an image of the dorsal side of a hand presented on a computer monitor. Test stimuli sites were pseudo-randomized on a trial-by-trial basis.
!
Results
This study employed a finger agnosia protocol, in the presence and absence of
(silence is considered to be in the range of -30 dB for humans). The average RMS amplitude (during all vibrations) was -58.90±0.11 dB. The average RMS amplitude during the periods of silence was -58.83±0.10 dB. Comparing each condition’s vibration to the immediately preceding silence yielded an average difference in RMS amplitude of 0.05±0.13 dB. The finger agnosia task was evaluated in order to quantify the ability of subjects to recognize and identify stimulated digits in the absence and in the presence of conditioning stimuli at different amplitudes. This task included seventeen healthy subjects (8 males and 9 females) ranging from 22 to 57 (39.1±2.9) years of age. As shown in Figure 1.3, the average percent accuracy in the absence of conditioning stimuli was 98.2±0.9% (n=17), and accuracy across subjects decreased with increasing amplitude of conditioning stimuli. Conditioning amplitudes of 30 and 40 μm
resulted in percent accuracies of 93.7±3.0% and 94.9±4.2%, respectively, and were not
statistically significant compared to subject performance in the absence of conditioning stimuli. The effect of conditioning on the finger agnosia task became statistically significant at
conditioning amplitudes greater than 50 μm: 89.0±4.2% at 50 μm (p<0.06) and 60.0±7.6% at 100 μm (p<0.01). Because the conditioning stimuli at 100 μm resulted in the most significant
percentage of incorrect responses compared to the simple finger agnosia protocol, the frequency of inaccurate responses for each digit was quantified (Figure 1.4). The results
suggested that subjects, on average, made the largest number of inaccurate responses when the correct answer should have been D3 and D4 (percent inaccuracies of 60.0±10.0% and
55.0±14.6%, respectively). Subjects were relatively better at identifying stimulation of D2
(inaccuracy of 15.0±10.0% significantly better than that for D3, p<0.01) and better at identifying D5, though not statistically significantly more.
Figure 1.3: Impact of Conditioning on Finger Agnosia Task
The average percent accuracy in absence of conditioning stimuli was 98.2±0.9% (n=17). In the presence of 30, 40, 50, and 100 μm conditioning stimuli, the percent accuracies gradually decreased with increased amplitude of conditioning stimuli: 93.7±3.0% at 30 μm (n=17), 94.9±4.2% at 40 μm (n=16), 89.0±4.2% at 50 μm (n=17, p<0.06), and 60.0±7.6% at 100 μm(n=5, p<0.01).
!
Discussion
The delivery of sinusoidal displacements to a single skin site via mechanical transducer
stimuli at a frequency range (1 to 250 Hz) with amplitudes of sufficient size (between 0 and 1000 μm) to activate a broad range of mechanoreceptors. However, in order to stimulate more
than one skin site — either during the course of human psychophysical testing or animal experimentation — it is necessary to position a second vertical displacement stimulator over the second skin site. Our previous device (described in Tannan et al. 2007a) was designed to address this issue by allowing dual site stimulation with automated two-dimensional probe positioning. Although the device reported by Tannan and colleagues was successfully utilized in a number of studies (Tannan et al., 2005b, 2006, 2007b, 2008; Tommerdahl et al., 2007a, 2007b, 2008), it was cumbersome and not ideal for clinical and clinical research venues.
Figure 1.4: Percent Inaccuracy on Finger Agnosia with 100 μm Conditioning Stimuli
Digits D3 and D4 showed the highest percent inaccuracies of 60.0±10.0% and 55.0±14.6%, respectively. There was a statistically significant observation in accurately recognizing and identifying stimulation of D2 at 15.0±10.0% versus D3 at 30.0±20.0% (p<0.01) and slight discrimination difference between D2 and D4 (p<0.08) in the presence of the 100 μm conditioning stimuli. The other the digit combinations showed no statistical significance in discrimination capability.
The CM-4, described in this report, has the capacity to quickly and easily adjust to fit to most adult, and many juvenile, hand sizes and can deliver vibrotactile stimuli to the tips of four digits. The ability to simultaneously deliver vibrotactile stimuli to a number of digits allows for a great deal of protocol diversity.
In this report, we described a relatively simple four-site finger agnosia protocol to
demonstrate the potential utility of the device. The principle finding in the results of this study is that there is an increase in inaccuracies with increases in the amplitude of concurrent
conditioning stimulation delivered during the agnosia task, and the ability to perform the task accurately in the presence of that conditioning stimulation is diminished more in digits D3 and D4 than in digits D2 and D5. The decrease in accuracy with increasing amplitudes of
synchronized sinusoidal stimulation is consistent with prior reports of increasing inaccuracies in temporal order judgment (TOJ) in the presence of synchronized and periodic conditioning stimuli. In a study by Tommerdahl and colleagues (Tommerdahl et al., 2007), it was
demonstrated that TOJ results obtained from a number of pairs of stimulus sites — unilateral as well as bilateral — were comparable. However, in the presence of a 25 Hz conditioning sinusoidal stimulus which was delivered both before, concurrently and after the TOJ task, there was a significant increase in the TOJ measured when the two stimuli were located unilaterally on digits D2 and D3. In the presence of the same 25 Hz conditioning stimulus, the TOJ obtained when the two stimuli were delivered bilaterally was not impacted. This led to the speculation that the impact that the conditioning stimuli — which only had an impact if they were
sinusoidal, periodic and synchronous — had on TOJ measures was due to the synchronization of adjacent cortical ensembles in somatosensory cortex, and that the synchronization of these cortical ensembles could have been responsible for the degradation in temporal order
judgment. The conditioning stimuli in this study were also synchronized, periodic and simultaneous, and if the degradation in test performance was due to synchronization of
ensemble (i.e., D2 and D5), and the results reflect this prediction. Future studies will consider whether or not subjects with neurological disorders are not impacted by conditioning stimuli, as was found to be the case in subsequent TOJ studies (e.g., TOJ metrics of subjects with autism were not impacted significantly by conditioning stimuli; Tommerdahl et al., 2008).
The degree of inaccuracies in the different digits with increasing conditioning stimulation
is also consistent with motor studies of digit interdependencies. In studying the autonomy of finger movements, intended motion in one finger often results in simultaneous movement, or enslavement, of other digits. More specifically, D3 and D4 show the most enslavement, or interdependency, of adjacent digits while D2 is characterized by the greatest independence (Häger-Ross and Schieber, 2000). In observing motor-related cortical potentials (MRCPs), the autonomous nature of D2 was shown to be significantly high while D4 showed the most dependency on other digits (Slobounov et al., 2002). In Figure 1.4, D2 demonstrates the lowest inaccuracies in the presence of conditioning stimulation while D3 and D4 exhibit the most; thus, in both the motor and sensory based studies, D2 demonstrates the most independence.
The role of neural communication between adjacent and non-adjacent cortical regions
plays an important role in understanding the relationship between neurophysiological mechanisms and sensory percept. The development of new, more versatile devices and methodologies, such as presented in this report, could contribute to bridging decades of neuroscientific research with human perceptual clinical and clinical research studies. One long term goal of our research is to develop sensory based instrumentation and methodologies for the diagnosis and assessment of treatment efficacies for a broad range of neurological
disorders, and building this aforementioned bridge could provide new insights into
!!
!!
!!
CHAPTER 2: VIBROTACTILE AMPLITUDE DISCRIMINATION CAPACITY
PARALLELS MAGNITUDE CHANGES IN SOMATOSENSORY CORTEX AND
FOLLOWS WEBER’S LAW 2
!
Overview
In this study, we investigated the changes in perceptual metrics of amplitude
discrimination that were observed in 10 healthy human subjects with increasing intensities of stimulation. The ability to perceive differences in vibrotactile amplitude changed
systematically with increasing stimulus magnitude (i.e., followed Weber’s Law) in a near linear fashion (R2 = 0.9977), and the linear fit determined by the amplitude discrimination task predicted the subjects’ detection thresholds. Additionally, the perceptual metrics correlated well with observations from a previously reported study in which measures of SI cortical activity in nonhuman primates (squirrel monkeys) evoked by different amplitudes of vibrotactile stimulation were obtained (Simons et al. 2005). Stimuli were delivered
simultaneously to two different skin sites (D2 and D3), enabling a method for the relatively rapid acquisition of the data. Stability and robustness of the measure, its rapid acquisition, and its apparent relationship with responses previously observed in SI cortex, led to the conclusion that deviations from the baseline values observed in the obtained perceptual metric could provide a useful indicator of cerebral cortical health.
Introduction
One of the fundamental questions often addressed in neuroscience is how two sensory stimuli are differentiated. Detection and integration of the differences in physical attributes of our environment is, undoubtedly, just one way in which we coordinate the processes that
This chapter previous appeared in Experimental Brain Research. The original citation is as follows: 2
govern how we react and respond to external stimuli. Weber initiated a discussion on how sensory stimuli are integrated into central information processing in his 1834 study of perceived intensity. In his experiments, he measured the difference limen (DL) of blindfolded subjects by giving them two weights of equal magnitudes (standard weight) to hold in each hand. He then proceeded to add slightly heavier weights (test weight) to one hand. The subject was asked to compare the weights in both hands and determine which was larger. Weber found that it was more difficult for the subject to determine that there was a difference in the weights when the standard weight was larger; in other words, the size of the DL was proportional to the stimulus strength and increased linearly as the initial stimulus strength increased (Goldstein 2007). Based on Weber’s experiments, physicist Gustav Theodor Fechner developed the Weber-Fechner Law: where ΔS is the DL corresponding to the reference stimulus S, and K is a constant
called Weber’s Fraction. Research has shown that Weber’s Fraction is usually constant for a range of stimulus intensities and can be applied to most senses, including weight, brightness, and sound frequency (Hanna et al. 1986; Gescheider et al. 1990; Stillman et al. 1993; Gescheider et al. 1996b; Gescheider et al. 1997; Scholtyssek et al. 2008).
A number of intensity related studies have been conducted in our laboratory. Most recently, we made the observation that the magnitude of the evoked optical intrinsic signal (OIS) varies in a near linear fashion in SI cortex of squirrel monkeys with the amplitude of a 25 Hz vibrotactile stimulus (Simons et al. 2005). One of the more interesting facets of that study was that while the magnitude of the centrally activated SI cortical region increased significantly with increasing amplitude, the spatial extent of the responding cortical territory did not
spatial extent of the response in SI (Johnson 1974). Simons et al. with their subsequent stimulus duration dependent study, demonstrated and discussed how the two views are compatible (Simons et al. 2007). To summarize, brief stimuli (500 ms or less) evoke a much more spatially extensive response than longer duration stimuli, and longer duration stimuli (greater than 500 ms) more actively engage pericolumnar lateral interactions that lead to a more prominent inhibitory surround. Previous ideas about intensity perception, which were based on the increased recruitment of peripheral afferents, obviously did not incorporate the inhibitory surround and thus led to alternative ideas about the characterization of SI cortical response to increasing stimulus intensity. Nevertheless, the near linear relationship between the magnitudes of the evoked SI cortical response to supra-threshold vibrotactile stimulus
amplitudes led us to posit the question as to whether or not we would observe a parallel metric perceptually. In other words, would increasing the vibrotactile amplitude of two comparison stimuli lead to a proportional increase in the DL (i.e., would Weber’s Law be followed)?
Additional intensity related, but perceptually based, studies have also been conducted in our laboratory (Tannan et al. 2007b; Tannan et al. 2008; Zhang et al. 2008). The development of novel stimulus devices that can simultaneously deliver two well controlled vibrotactile stimuli (both in terms of amplitude and frequency) has made a number of studies much more
pragmatic (Tannan et al. 2007b; Tommerdahl et al. 2007a; Tommerdahl et al. 2007b; Tannan et al. 2008; Tommerdahl et al. 2008a; Tommerdahl et al. 2008b). For example, simultaneous delivery of two vibrotactile stimuli to different locations allows for direct comparison between the two stimuli, and problems originating from comparison of two stimuli at the same location, such as adaptive effects by the first stimulus delivered, are automatically eliminated. The decrease in overall protocol duration (to approximately 1.5 min per standard) has made it possible to complete the multiple amplitude discrimination runs necessary for a study, such as the one described in this report, in a single 10-20 min session. In this report, the two-site amplitude discrimination protocol was executed with a number of different standard
intensity. Additionally, this data was compared with previously reported changes in SI cortical activity obtained from squirrel monkey in order to ascertain the relationship of primary sensory cortex to perceptual capacity.
Methods
Ten subjects (22-31 years in age) were studied who were naïve both to the study design and issue under investigation. The subjects consisted of 7 males and 3 females, all right-hand dominant. The study was performed in accordance with the Declaration of Helsinki, all
subjects gave their written informed consent, and procedures were reviewed and approved in advance by an institutional review board.
A two-alternative forced-choice (2AFC) tracking protocol was used to evaluate the
amplitude discriminative capacity of each subject (see Figure 1.2) in a manner used in a number of previous studies that have examined dual-site simultaneous vibrotactile discriminative capacity (Tannan et al. 2005; Tannan et al. 2006; Tannan et al. 2007a; Tannan et al. 2007b; Tommerdahl et al. 2007a; Zhang et al. 2008). The subject was seated with the right arm resting comfortably on a dual-site portable vibrotactile stimulator (CM-1; for full description, see: (Tannan et al. 2007a)). Two probe tips (5 mm diameter) were positioned on the glabrous pads of digits 2 and 3 of the right hand. Digits 2 and 3 were chosen as test sites for both convenience of access (thus maximizing the test’s potential in clinical applications) and because of the wealth of neurophysiological information that exists for that somatotopic region of cortex in primates. Visual cueing was provided with a computer monitor during the experimental run. Specifically, an on-screen light panel was used to indicate to the subject when the stimulus was on and when the subject was to respond. The subject was not given performance feedback or knowledge of the results during the data acquisition until all sessions were completed. At the start of each run, the two probe tips were driven towards the skin until each tip registered a force of 0.1 g, as determined by a closed-loop algorithm in the CM-1 stimulator feedback system. The tips were then further indented into the skin by 500 μm to insure good contact
stimulator during delivery of the range of stimuli used in this study. All vibrotactile stimuli used in this study were delivered at the frequency of 25 Hz flutter.
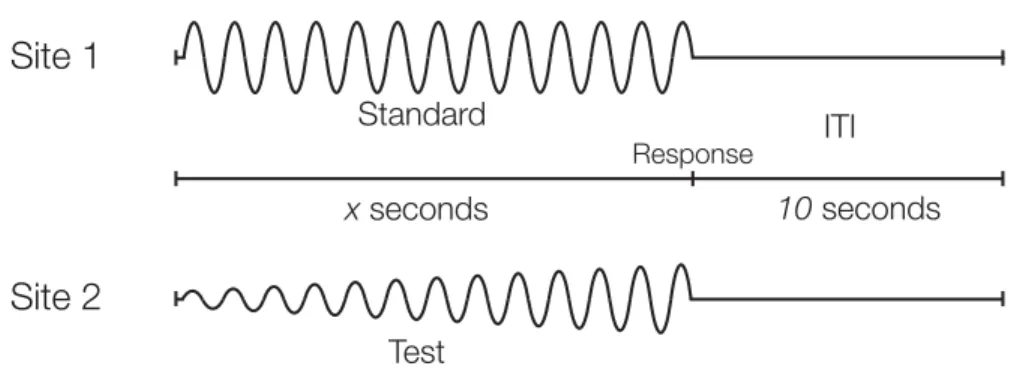
Figure 2.1: Schematic of the Protocol Used for Amplitude Discrimination
Two 25 Hz vibrotactile stimuli, the standard (S) and test (T), were delivered at the same time for 0.5 sec. A 5 sec delay (excluding subject response interval (RI)) was imposed before onset of the next trial. The subject was queried as to which stimulus felt more intense.
!
Amplitude discrimination was tracked for nine conditions of standard stimulus
amplitude, each condition tracked in a separate experimental run: 50, 100, 200, 300, 400, 500, 600, 700 and 800 μm. During an experimental run, a vibrotactile test stimulus was delivered
simultaneously with a vibrotactile standard stimulus (the standard amplitude remained
constant throughout the run). The loci of the test and standard stimuli were randomly selected on a trial-by-trial basis. Stimulus duration was 0.5 sec, followed by subject response (subject was queried to select the skin site that received the most intense stimulus) and a 5 sec delay before onset of the next trial. The test stimulus amplitude was always greater than that of the standard stimulus.
amplitudes of two-site skin flutter stimulation (Tannan et al. 2007a). The difference between the amplitudes of the test and standard stimuli delivered on each of these initial 10 trials was adjusted on the basis of the subject’s response in the preceding trial (the discrepancy in amplitude was decreased if the subject response in the preceding trial was correct; it was increased if the response was incorrect). After the initial 10 trials were completed, test stimulus amplitude was modified using a 2-up/1-down algorithm — in these trials two correct/one incorrect subject response(s) resulted in a decrement/increment, respectively, in the amplitude difference between the test and standard stimuli. The subjects’ DLs were calculated by
averaging the amplitude of the test stimulus in the last five trials of each run and comparing this to the standard used in each test. The step size for each condition was 5% of the standard amplitude. This value was chosen in order to maximize resolution of the method as well as to standardize the relative step size for each run. A series of training trials, each consisting of a pair of stimuli differing in amplitude by 100 μm (200 μm vs. 100 μm), were conducted prior to
the first run. These amplitudes were chosen to provide only minimal challenge to the subjects performing the discrimination task during training. The subject was provided with feedback only during training trials and was allowed to continue on to the first run after answering correctly 5 times in a row. Each subject participated in a single experimental session that consisted of nine separate runs of different standard amplitude conditions (randomized in order). A single session, including actual testing time and short breaks between each run, took 30-45 min. A modified 2AFC protocol was also used to evaluate the detection threshold of each subject. For this procedure, amplitude discrimination was performed for 60 trials using a 3-up/1-down algorithm, due to the lower signal-to-noise ratio at this low-amplitude testing level. In this condition, the standard amplitude was held constant at 0 μm, thereby testing the ability
of the subject to simply detect the presence of the 25 Hz stimulus. Results
vibrotactile stimuli and to directly compare subjects’ discriminative capacities under different conditions of standard amplitude (protocol previously described in (Tannan et al. 2007b; Tannan et al. 2008; Zhang et al. 2008); also see Methods). To summarize, a tracking protocol was employed in which two stimuli were delivered simultaneously in one trial. The subject was queried as to which stimulus was more intense, and the difference between the two subsequent stimuli of the next trial was increased or decreased based on subject response. The difference limen (DL) for each subject was determined by averaging the tracking values obtained from the last five trials of each experimental run.
Figure 2.2: Averaged Difference Limen Values at Various Standard Amplitudes
The plotted linear regression has a correlation coefficient of 0.99771, and the y-intercept (predicted detection threshold) is approximately 9.25 μm.Two 25 Hz vibrotactile stimuli, the standard (S) and test (T), were delivered at the same time for 0.5 sec. A 5 sec delay (excluding subject response interval (RI)) was imposed before onset of the next trial. The subject was queried as to which stimulus felt more intense.
!
compare the DL obtained with a 50 μm standard (14.8 ± 1.26 μm) to the DL obtained with an
800 μm standard (101.6 ± 1.72 μm)). A linear least-squares fit was applied to the data, and an
R2 value of ~0.998 was obtained for the linear regression, demonstrating a remarkably strong correlation between DL and standard amplitude and thereby verifying the application of Weber’s Law for this particular task. Extrapolation of the linear fit (shown in Figure 2.2) to the y-intercept yields the prediction that the detection threshold — or in other words, the ability to correctly discriminate between a vibrotactile test stimulus and a 0 μm “standard” stimulus —
should be ~9.25 μm. Under the condition of 0 μm standard stimulus amplitude, a modified
amplitude discrimination protocol was used (which required a much larger number of trials — see Methods) and detection thresholds were directly obtained and averaged across all subjects. Subjects were consistently able to detect stimuli at amplitudes of 9.21 ± 1.76 μm, and an
independent two subject t-test verifies that there is not a statistically significant difference between the actual average detection threshold and the predicted measure derived from the linear fit to the amplitude discrimination DLs obtained with this protocol (t = 0.029, D.F. = 15, p = 0.977).
Figure 2.3: Difference Limens Plotted as Percent Difference
In order to ascertain whether or not ΔS / S was constant (i.e., whether or not the
Weber-Fechner Law held true) DLs, averaged across all subjects, were re-plotted as a percent of the corresponding standard amplitude from which they were obtained (see Figure 2.3). The data suggest that DLs are proportionally higher at lower amplitudes (i.e., standard amplitude < 300
μm), then level off for higher standard amplitudes (≥ 300 μm) at a percent difference of
approximately 13%. Thus, the non-linearity of this data demonstrates a deviation from the Weber-Fechner law in the region tested below 300 μm, suggesting that the Weber-Fechner Law
holds true only for the amplitude discrimination tasks with the relatively higher standards.
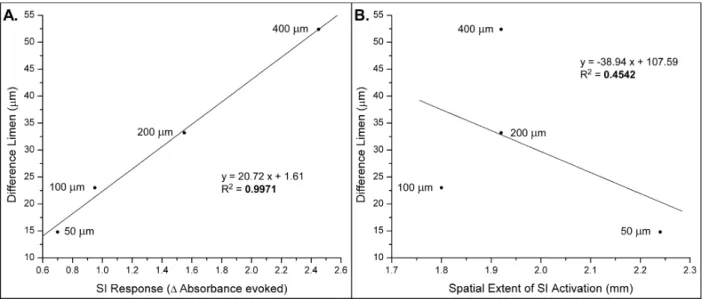
Figure 2.4: Correlating Data with Optical Imaging
Panel A. Correlation between the DLs, obtained from this study, and the maximal change in absorbance in SI, previously reported (Simons et al. 2005). As the standard amplitude increases, both DL and SI response increase in a linearly proportional manner (R2 = 0.9971).
Panel B. Correlation between the DLs and the spatial extent of SI activation. As the standard amplitude was increased, no correlation was observed (R2 = 0.4542).
!
In a previous study that investigated the SI response to different amplitudes of
vibrotactile stimulation (at the same frequency as this study) utilizing the technique of optical intrinsic signal (OIS) imaging in nonhuman primates, we found that an increase in the
amplitude was characterized by a near-linear function within the range of amplitudes studied (50-400 μm). Measurement of the spatial extent of the activated SI region, on the other hand,
showed that higher amplitudes of stimulation did not produce a more extensive region of SI activation. Instead, as the amplitude was increased, average peak absorbance within an ~2 mm diameter SI region increased with the amplitude of stimulation, and the region of surrounding cortex underwent a prominent decrease (frequently to levels well below background) in
absorbance. In order to directly compare the two principle findings of that study — the
relationship of absorbance evoked by different amplitudes of stimulation and the apparent lack of correspondence of the spatial extent with amplitude of stimulation — we directly compared the DLs obtained from the results of this report with those two entities. The results from those comparisons are shown in Figure 2.4 and demonstrate that there is a very strong correlation (R2 = 0.9971) between the DLs obtained at each standard amplitude and the neural activity evoked at each amplitude. On the other hand, a much weaker (not significant) correlation was observed between the spatial extent of the cortical response and the DLs obtained at the same amplitudes (R2 = 0.4542).
Discussion
In this study, a dual-site vibrotactile amplitude discrimination protocol was used to determine the difference limen (DL) for a number of standard amplitudes. The DLs were found to increase in a near-linear fashion with an increase in standard amplitude, thus adhering to Weber’s Law for the stimulus range employed in this study (50-800 μm). Extrapolation of the
linear least squares fit of the data (DL vs. standard amplitude) yielded a prediction — at the y intercept — of the detection threshold. An independent method of threshold observation demonstrated that the same group of subjects had a detection threshold very close to the one predicted (9.21 ± 1.76 μm detected vs. 9.25 μm predicted), and both values are consistent with
changes observed in the perceptual metrics obtained in this study with different standard amplitudes.
One of Ken Johnson’s principle contributions to the field of somatosensory neurophysiology was his emphasis on the description of linearity between subjective experience and the underlying neural activity on which it is based. In essence, he concluded that “all the available evidence points to linearity as the basic law of psychophysics” (Johnson et al. 2002). The results of this paper fully support his statement, as not only was there a linearity demonstrated in the perceptual metrics, but the perceptual metrics obtained in this study co-vary with the SI cortical response (from non-human primates) in a fashion that strongly suggests that the magnitude of the neural activity evoked in SI could be essential to the neural code of intensity discrimination. Although SI is considered primary sensory cortex, it has, nevertheless, been observed to reflect other aspects of perception exceedingly well. Chen and colleagues observed evoked SI activity between the somatotopic representations of two digit tips when the two digits were simultaneously stimulated — an apparent parallel to the perceptual illusory effects generated by the same dual site stimulus (Chen et al. 2003).
A number of other somatosensory studies suggest that the increase in stimulus intensity could be proportional to an increase in the evoked SI cortical activity. Most closely related to our SI cortical study — briefly summarized in the results section — was a study by Chen and colleagues who used the optical intrinsic signal (OIS) to demonstrate that a proportionally greater (larger magnitude) response is evoked in SI of squirrel monkeys as the amplitude (as measured by force) of a skin stimulus is increased (Chen et al. 2003). Several studies examined the global SI response using noninvasive imaging techniques in humans such as fMRI
coded not only by the average firing rates of individual SI neurons, but also by the total aggregate of responding neurons. These population based studies seemed to confirm prior predictions of the SI neuronal population response based on reconstructions from afferent recordings (Werner and Mountcastle 1965; Johnson 1974; Connor et al. 1990; Whitsel et al. 2000; Guclu and Bolanowski 2002) and single unit cortical recordings (Mountcastle et al. 1963; Simons 1978).
Could the neural code for intensity be as simple as the above-described relationship suggests? One aspect that has not been addressed in this study is the effect that stimulus duration could potentially have on the results. A longer stimulus duration would result in both improvements perceptually, such as those that occur with adapting stimulation (Goble and Hollins 1993; Goble and Hollins 1994; Gescheider et al. 1996b; Gescheider et al. 1999; Tannan et al. 2007b) as well as changes in the SI cortical response. One of the most notable changes in SI cortical response with increasing vibrotactile stimulus duration is the increased funneling that leads to the development of a surround (Llinas and Sugimori 1980; Tommerdahl et al. 2002; Chiu et al. 2005; Simons et al. 2005). The surround appears to spatially constrain the responding cortical region (Simons et al. 2007), and within the spatially constrained area of evoked cortical activity, spatially non-homogenous patterns of response develop which are amplitude dependent (Chiu et al. 2005; Tommerdahl et al. 2005a). Such stimulus dependent patterns have been observed in other cortical studies as well (Bruno et al. 2003) that strongly suggest that minicolumnar patterns of response play a role in cortical information processing (Tommerdahl et al. 1987; McCasland and Woolsey 1988; Tommerdahl et al. 1993; Favorov and Kelly 1996; Chiu et al. 2005; Tommerdahl et al. 2005a).
There could be potential clinical implications from this study. Since the results suggest a strong correlation with SI cortical activity and the capacity for amplitude discrimination at multiple amplitudes, we would predict that a systemic cortical alteration, in which cortical activity deviates from the norm, would change a subject’s capacity for amplitude
standard amplitude (such as plotted in Figure 2.2) could be impacted significantly in a neurologically compromised individual, and this function could be determined relatively rapidly by deriving it from 2 or 3 DLs obtained from larger amplitude (>300 μm) standards.
Based on the data plotted in Figure 2.3, it appears that subjects are much more accurate at higher standards, most likely due to the higher signal-to-noise ratio (with “noise” determined by the baseline values of neural activity that are correlated with sub-threshold perceptual values). If this is, in fact, the case, then the data presented in Figure 2.3 would present a fairly strong argument against obtaining and interpreting threshold and/or near-threshold measures, as accuracy clearly decreases with the magnitude of the stimuli. In other words, accurate threshold detection measures necessitate much longer protocols (in the case of this study, 3 times as long) than does deriving amplitude discrimination capacity at multiple supra-threshold standards. Additionally, the multiple DLs obtained from studies such as this one can be used to determine a functional relationship; threshold detection, on the other hand, yields only one measure, and it is difficult to derive a systemic function from a single point. Although
numerous studies have successfully shown differences in thresholds for different
exponential growth of brain imaging (fMRI, EEG, MEG) studies have yet to reveal significant differences that parallel those observed in studies which obtain perceptual metrics such as those in this report. Furthermore, it is highly unlikely that such brain imaging studies will be capable of detecting differences in the responses evoked by stimuli which vary in intensity by as little as 10-20%. Given the cost — both in time and in monetary expense — it may serve diagnosticians well to take a closer look at the perceptual measures that strongly reflect cortical activity and are sensitive to systemic cortical alterations.
Although some strong correlations were observed in this study, there are questions that observations of this study raise that remain to be resolved. One of the most prominent
questions stems from the observation that the weaker stimuli studied (50, 100, 200 μm) had
proportionally larger DLs than the stronger stimuli. At the stronger stimulus conditions, the DLs maintained a fairly constant value in proportion to the standard stimulus. While our current interpretation of this is that it could simply be a signal-to-noise issue, we cannot rule out other stimulus-dependent mechanisms. For example, the studies of Chen and colleagues (Chen et al. 2003) would suggest that stimuli delivered to adjacent digit tips, particularly when the stimuli are near equal in strength, would result in mutual inhibition of the cortical
responses evoked by the two stimuli. In this scenario, the DLs observed in the weaker standard stimulus range would be more significantly impacted. Decreases in the evoked SI cortical response have been observed in a number of stimulus conditions (Tommerdahl et al. 2005b; Tommerdahl et al. 2006), and the impact of such stimuli on perceptual metrics such as those reported in this study are currently being explored.
!!
!!
!
!
NOVEL STIMULUS PARADIGMS
Traditional tactile sensory testing has relied heavily on delivery of single-site stimuli to the skin and querying test subjects on various qualities of those stimuli. While these methods are effective in making measures that characterize the peripheral nervous system, they lack in quantitatively assessing centrally mediated disorders of the nervous system. Additionally, the models from which the developments of such peripherally based protocols originate are based more on historical precedence of prior techniques than on a characterization of the central nervous system. This section describes the development of not only novel methods for delivering multi-site tactile stimuli, but a novel approach for sensory testing based on models derived from measures of neural population response yielded from in-vivo and in-vitro animal experimentation.
In chapter 3, the impact of a constantly changing (ramping) stimulus is explored. The testing was performed not as a “method of limits” threshold test, which has been explored exhaustively in the literature, but instead as an amplitude matching task where one stimulus maintains constant stimulus and the other is ramped to meet it. The method was extensively examined; the parameters of testing included 3 amplitudes and .9 different rates of
modulation. The method was found to show drastic differences both between and within a small group of subjects diagnosed with autism (This is explored in great detail in chapter 6).
In chapter 4, a duration discrimination task is task is introduced to explore tactile temporal discrimination and its adherence to Weber’s law. Previous optical imaging studies in non-human primates demonstrated that increasing the duration of a vibrotactile stimulus resulted in a consistently longer and more well defined evoked SI cortical response. Additionally, and perhaps more interestingly, increasing the amplitude of a vibrotactile
of the evoked response was much longer duration for larger amplitude stimuli. This led to the hypothesis that the magnitude of a vibrotactile stimulus could influence the perception of its duration. Results confirm this, and also show that the opposite is true; Vibrotactile duration can influence the perception of amplitude. The data from animal studies lead us to believe that this phenomenon is mostly controlled by glia, and could also robust quantification of glia status in subjects with neuroinflammatory conditions.
In chapter 5, the effects of non-noxious thermal stimulation on tactile discriminative processing capacity were evaluated. It was determined that the subject‘s performances in the tests that involve both temporal and spatial summation of sensory information are significantly impacted by elevation of skin temperature, and these perceptual changes might reflect a shift in the balance of cortical excitation and inhibition caused by non-noxious thermal stimulation. This metric could provide a means for assessing central sensitization in patient populations that have dysfunctional mechanisms for mediating pain-touch interactions without the delivery of painful stimuli. Notably, this chapter includes a dynamic tracking of adaptation task, which uses 2 modulating stimuli to affectively measure amplitude discriminative capacity and the effects of adaptation in an extremely short and robust manner.
!!
!!
!!
CHAPTER 3: RATE DEPENDENCY OF VIBROTACTILE STIMULUS MODULATION 3
!
Introduction
Prolonged pre-exposure to sensory stimulation modifies discriminative capacity and alters the ability of both peripheral and CNS neurons to process sensory information. Primary sensory cortical mechanisms undergo transient, but significant alterations in response to even a brief exposure to adequate sensory stimulation. For example, both visual and somatosensory cortical pyramidal neurons undergo prominent use-dependent modifications of their receptive fields and response properties. Such modifications attain full development within a few tens of milliseconds of stimulus onset, and disappear within seconds after stimulus termination (visual cortical neurons: (Bredfeldt and Ringach, 2002; Celebrini et al., 1993; Das and Gilbert, 1995; DeAngelis et al., 1995; Dinse and Kruger, 1990; Pack and Born, 2001; Pettet and Gilbert, 1992; Ringach et al., 1997; Shevelev et al., 1998; Shevelev et al., 1992; Sugase et al., 1999); rat
somatosensory cortical neurons (Khatri et al., 2004; Khatri and Simons, 2007), for review of short-term primary somatosensory cortical neuron dynamics see (Kohn, 2007; Kohn and Whitsel, 2002)).
Previously, we reported on the capacity of 20 healthy adult subjects for detecting differences in the amplitude of two simultaneously delivered 25 Hz vibrotactile stimuli in both the absence and presence of prior exposure to different conditions of adapting stimulation (Tannan et al., 2007b) with the use of a novel portable dual skin site stimulator (Tannan et al., 2007a). Results obtained from that study demonstrated that increasing durations of adapting stimulation at one of the two skin sites, in the range of 0.2 to 2.0 s, led to a systematic and progressive decrease in each subject's ability to discriminate between the two different
This chapter previous appeared in Brain Research. The original citation is as follows: 3