THE EFFECT OF BICYCLE CRANK LENGTH ON MAXIMAL OXYGEN UPTAKE AND VENTILATORY THRESHOLD IN TRAINED CYCLISTS
Stephanie Aanstoos Sullivan
A thesis submitted to the faculty of the University of North Carolina at Chapel Hill in partial fulfillment of the requirements for the degree of Master of Arts in the Department of Exercise and Sport Science
(Exercise Physiology)
Chapel Hill 2019
ii © 2019
iii
ABSTRACT
Stephanie Aanstoos Sullivan: The Effect of Bicycle Crank Length on Maximal Oxygen Uptake and Ventilatory Threshold in Trained Cyclists
(Under the direction of Claudio L. Battaglini)
iv
ACKNOWLEDGMENTS
I would first like to thank my family for their support throughout my academic endeavors. While my path to this degree was not a direct one, their support has always been unwavering. I would especially like to thank my husband who has put up with the long hours, late nights and weekends I have spent working on this project. Thanks for always being there for me.
I would also like to thank each of my committee members (Dr. Edgar Shields, Jordan Lee, and ex officio members, David Williams, Dr. Brian Moscicki, and Dr. Bing Yu). This project would not have been possible without their support and wisdom. Additionally, I would like to thank Dr. Brian Jensen for clearing all of my participants, Chad Wagoner for both his help in the development of this project and for his help as a research assistant, and Cassie Jones for serving as a research assistant. Also, thanks to Gregory Nuckols, Amanda Robertson and Jessica McDermott for filling in whenever I needed an extra hand.
v
TABLE OF CONTENTS
LIST OF TABLES ... vii
LIST OF FIGURES ... viii
CHAPTER 1 ... 1
INTRODUCTION ... 1
Statement of Purpose ... 2
Research Question ... 3
Hypotheses ... 3
Limitations ... 3
Delimitations ... 4
Definitions of Terms ... 4
Assumptions ... 5
Significance ... 5
CHAPTER II ... 8
REVIEW OF LITERATURE ... 8
Leg Length ... 8
Submaximal Aerobic Efficiency ... 11
Maximal Anaerobic Power ... 14
vi
Conclusion ... 18
CHAPTER III ... 20
METHODS ... 20
Subjects ... 20
Instrumentation ... 20
General Procedures ... 21
Statistical Analyses ... 30
CHAPTER IV... 32
RESULTS ... 32
CHAPTER V ... 44
DISCUSSION ... 44
Maximal Oxygen Consumption ... 44
Ventilatory Threshold ... 46
Exploratory Analysis ... 48
Recommendations for Future Research ... 50
Conclusion ... 52
APPENDICES ... 53
vii
LIST OF TABLES
TABLE 1: Summary of Study Protocol ……… 23
TABLE 2: Cycle Ergometer Maximal CPET Protocol ………. 29
TABLE 3: Subject Characteristics ……… 32
TABLE 4: Cycling Characteristics and Vertical Leap Test Results ………. 33
TABLE 5a: CPET Results – Maximal Effort Parameters………. 34
TABLE 5b: CPET Results – Maximal Oxygen Consumption ………. 35
TABLE 5c: CPET Results – Ventilatory Threshold ………. 36
TABLE 6a: Light Submaximal Trial Results ...……… 37
TABLE 6b: Vigorous Submaximal Trial Results ………. 38
TABLE 7: Relative VO2max and VO2 at VT for each Crank Length vs. Exploratory Variables ………… 39
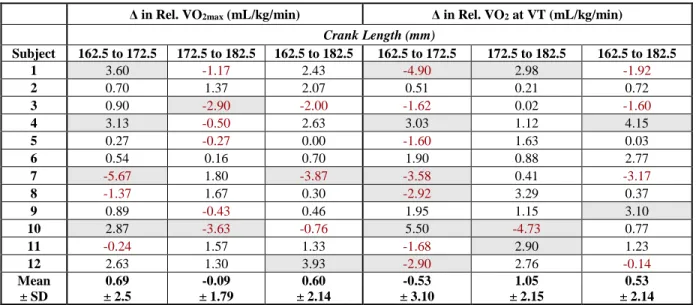
TABLE 8: Changes Between Crank Length in Relative VO2max and VO2 at VT ………....….…. 40
viii
LIST OF FIGURES
FIGURE 1: Bicycle Measurements ……….. 25
FIGURE 2: Change in Relative VO2max (162.5 to 172.5mm) vs. Height ………. 41
FIGURE 3: Change in Relative VO2max (162.5 to 172.5mm) vs. Weight ……… 41
FIGURE 4: Change in Relative VO2 at VT (162.5 to 182.5mm) vs. Preferred Cadence ……… 42
FIGURE 5: Subjects Grouped by “Change” and “No Change” in VO2max ……….. 45
FIGURE 6: Changes in Mean Absolute VO2max Values, Removing Tallest Subject ………... 46
1
CHAPTER 1
INTRODUCTION
The sport of cycling has evolved tremendously over the past century, branching into a multitude of different disciplines from cyclocross to triathlon. Not only do the categories of bicycles continue to multiply, but the design and components also continue to evolve, driven by the latest technology and engineering. For road cyclists, position on the bicycle is just as, if not more, important than the bicycle itself (Barry, Burton, Sheridan, Thompson, & Brown, 2015). Altering a cyclist’s position, or the “bicycle fit” can contribute tremendously to power production, aerodynamics, comfort, and ability to maintain a sustained effort (Gnehm, Reichenbach, Altpeter, Widmer, & Hoppeler, 1997; Kyle, 1994). Crank length, or the distance from the bottom bracket axle to the pedal axle, is one of the many important factors in bicycle fit that can potentially play a major role on performance, comfort, and injury risk. One small adjustment to the crank length impacts several aspects of the rider’s position including knee angle, hip angle, and shoulder angle – all of which may alter force, power production, and aerodynamics (Barratt, Korff, Elmer, & Martin, 2011; Korff, Romer, Mayhew, & Martin, 2007).
2
purported the potential benefits of a shorter crank length for duathletes and triathletes, where athletes use a more forward, aerodynamic position and must run after cycling (Briggs & Obermire, 2016; Deakon, 2012; Moscicki, Burrus, Matthews, & Paolone, 2016). However, to date, only one study has investigated the effects of crank length while in an aerodynamic position (Moscicki et al., 2016), and to our
knowledge, no studies have investigated the impacts of crank length on post-cycling running. While more studies are needed to compare energy costs during submaximal cycling studies and specifically in
disciplines like triathlon, the primary flaw thus far is the lack of understanding of the effects of crank length on maximal aerobic capacity.
Prior to further research on the impacts of crank length on submaximal cycling and in multisport events, it must be determined whether different crank lengths impact maximal oxygen uptake (VO2max) and ventilatory threshold (VT) while cycling. A standard submaximal protocol involves a set time cycling at a percentage of VO2max or VT. However, in the studies done thus far, the maximal cardiopulmonary exercise test (CPET) to determine VO2max and VT has only been done on one crank length. If crank length does impact VO2max and/or VT, a CPET would need to be done on each crank length tested in order to accurately compare the crank lengths using an exercise prescription based on a percentage of VO2max or VT. To the best of our knowledge, this is the first study to compare the effects of different crank lengths during a maximal CPET on VO2max and VT.
Statement of Purpose
3 Research Question
Does crank length impact VO2max and/or VT attained by trained cyclists and multisport athletes during a maximal CPET on a cycle ergometer?
Hypotheses
Null Hypothesis 1.1: In terms of mean VO2max values obtained during the maximal CPET, the differences among the three crank lengths are all zero in the target population.
Null Hypothesis 1.2: In terms of mean VT values obtained during the maximal CPET, the differences among the three crank lengths are all zero in the target population.
Limitations
• The current training phase of each subject was not controlled.
• While the cycle ergometer was adjusted for each subject to mimic the athlete’s position on their
own bike, there may have been dissimilarities that could have impacted their performance. • Even though all attempts were made to control the conditions between tests including the
athlete’s fatigue levels and diet, there was no way to tell for sure if they followed the guidelines and answered the pre-trial questionnaire honestly.
• Even though all subjects met the criteria for participation in the study, a range of training levels
and backgrounds were observed and could have had an impact on how crank length influenced the primary outcomes.
• Crank length for the study was set at 162.5, 172.5, and 182.5 mm. However, 50% of the subjects
4 Delimitations
• All participants were trained cyclists or multisport athletes specializing in road cycling. • Hydration status was monitored via urine specific gravity prior to the start of each trial and the
urine specific gravity had to be less than 1.020 prior to starting the trial.
• Start times were consistent within each subject to control for hormonal flux occurring throughout
the day (within 1 hour either earlier or later from the first test).
• All participants utilized a crank length between 170-175 mm on the bike they rode most often. • All participants were free of any heart, lung, kidney, liver, or orthopedic condition that would
prevent participation in any of the study activities (maximal, supra-maximal and submaximal cycling; vertical leap test).
• Female subjects performed all three experimental trials within the early follicular phase of their
menstrual cycle (days 3-8) (Lebrun, McKenzie, Prior, & Taunton, 1995) (Lebrun et al., 1995). • All males performed all three experimental trials within a three-week period.
Definitions of Terms
• Trained cyclist – Individuals who have been road cycling at a minimum average of 3 hours per
week for the past six months and more than one year of cycling experience.
• Multisport athlete – Individuals who compete in triathlons or duathlons involving road cycling as
well as running and/or swimming who have also fit the criteria for “trained cyclist.” • Crank length – the distance from the bottom bracket axel to the pedal axel.
• Maximal oxygen uptake (VO2max) – Indicative of maximal oxygen consumption, the maximal
amount of oxygen that an individual is able to consume, transport, and utilize within working muscle to produce (aerobic) energy.
• Ventilatory threshold (VT) – The point at which pulmonary ventilation increases (exponentially)
5
determined using the V-slope method (Casaburi, Whipp, Wasserman, Beaver, & Koyal, 1977; Wasserman, Whipp, Koyl, & Beaver, 1973).
• Maximal cycling cardiopulmonary exercise test protocol (maximal CPET) – An incremental
exercise test increasing intensity in stages, thus allowing the subject to reach one’s maximal capacity for aerobic exercise. This study used a cycle ergometer protocol within a laboratory setting. Please see Table 2 for the full protocol.
• Supra-maximal effort (supra-max) – A protocol used to verify that a true VO2max was reached. For
this study, subjects performed a supra-max at 105% of the wattage reached during the maximal CPET.
• Total leg length – Measured from the anterior superior iliac spine (ASIS) to the inferior border of
the medial malleolus.
• Upper leg length – Measured from the greater trochanter of the femur to the joint line of the knee
on the lateral side.
• Lower leg length – Measured from the joint line of the knee on the lateral side of the inferior
border of the lateral malleolus.
Assumptions
• It was assumed that all subjects answered all the study questionnaires honestly.
• It was assumed that all subjects in this experiment abstained from alcohol, drugs, or any other
ergogenic aid that could have affected the results of the study.
• It was assumed that all subjects gave the same effort level across all trials.
Significance
6
likely to be different depending on the style of riding and type of bicycle, yet only a few styles of riding have been utilized in the literature. To date, only one study has looked at the effects of different crank lengths in the aerodynamic position using a triathlon bike, though many people have claimed this is where a shorter crank length could have the greatest benefit. Several professional triathletes already use crank lengths much shorter than what is sold standard on the market, leading to many amateur triathletes to blindly following suit. Ongoing debates have been sparked over the issue, validating the need for further investigation. However, the greatest limitation in the literature on crank length thus far has been a lack of understanding on the effects of crank length on maximal oxygen uptake. To our knowledge, no study to date has specifically investigated whether crank length has an impact on VO2max and/or VT. This is crucial prior to future work in this area because when comparing the effect of crank length during submaximal cycling, it is important to ensure equal effort levels are being compared. Prior studies investigating the acute effects of crank length on submaximal exercise bouts have either set the work load at a standardized power (for example, all subjects completed 10 minutes at 150 W) without doing a maximal CPET, or have conducted only one CPET using a standard crank and then set the workload based on a percentage of VO2max or VT achieved (for example, all subjects completed 10 minutes at 75% of their VO2max or 95% of their VT). The first condition is potentially problematic because if the power is standardized for all subjects across crank lengths, the relative intensity is unknown. The second condition is potentially problematic because if the VO2max and/or VT do in fact differ for each crank length, the submaximal relative intensity will not be the same for each alternative crank length as the percentage from the CPET on the standard crank. Therefore, this study will address a key limitation to past studies on crank length and lay the groundwork for future investigations that are needed to address the nuances of each cycling discipline and the needs of cyclists with varying goals. The primary question answered will be whether or not it is necessary to conduct a CPET on each crank length compared in a study in order to set relative intensities for submaximal protocols.
7
submaximal cycling economy can be used to predict the optimal crank length, as determined by the maximal CPET. All of these factors could potentially impact which crank length is better for an
individual cyclist. Lower body lean mass, for example, is an indicator of leg strength. Similarly, VJH can be used to calculate peak explosive power (Ekstrand, Battaglini, McMurray, & Shields, 2013; D. L. Johnson & Bahamonde, 1996) and replicates the down part of the pedal stroke. Using the DEXA scan is a quick (about six minutes), noninvasive method to accurately (mean coefficient of variation between 1-3%) assess lower body lean mass with minimal risk (Cordero-MacIntyre et al., 2002; J. Johnson & Dawson-Hughes, 1991). The scan provides a wealth of information regarding body composition,
8
CHAPTER II
REVIEW OF LITERATURE
Crank length can impact a variety of factors that contribute to overall cycling performance. In order to address the primary areas of research on crank length, this literature review has been divided into four sections. Section one will address leg length and the correlation between leg length and optimal crank length. Section two will discuss the effects of crank length on submaximal aerobic efficiency, while section three will focus on maximal anaerobic power. Finally, section four will cover how crank length impacts pedaling mechanics, including cadence, pedal speed, and joint angles.
Leg Length
To date, using a leg length formula is the primary way to estimate optimal crank length for a cyclist without simply opting for what comes standard on the bicycle. Logically, it makes sense that a longer leg may warrant a longer crank for maximal leverage, and vice-versa. However, standard cranks sold on bicycles of all sizes range a mere 3% in length (170-175 mm), while cyclists’ leg lengths range by much more. Longer and shorter cranks can be special ordered, which is expensive but often deemed necessary by top competitors and professional athletes. Bicycle fitters around the world have developed a variety of different formulas to determine ideal crank length based on height, leg length, or inseam. However, in the literature, the functional relationships between leg length and crank length are not clear, and there are mixed results as to whether leg length can predict optimal crank length.
9
cadence of 60 rpm. Crank lengths tested ranged from 115 to 240 mm. Investigators found significant differences in HR and rate of perceived effort (RPE), but not VO2. Though VO2 was not significant, all three measures were lowest with the crank length equivalent to 20% of leg length. Therefore, they concluded 20% of leg length to be the most efficient crank length, and that the standard crank is too long for 60% of males and almost 100% of females.
Several years later, Carmichael, Loomis, and Hodgson (1982) performed a similar study comparing six different crank lengths (150, 160, 170, 180, 190, and 200 mm). Nine male cyclists
performed a six-minute effort at approximately 75% of VO2max with each crank length at a fixed cadence of 90 rpm. This protocol made the work rate relative to each cyclist’s abilities and the prescribed intensity more challenging than in the previous study. Additionally, the cadence of 90 rpm is considered optimal for competitive cyclists, as opposed to 60 rpm used in the previous study, and may be a more translational target (Hagberg, Mullin, Giese, & Spitznagel, 1981). Looking at the relationship between optimal crank length (based on lowest oxygen consumption) and leg length, the investigators compared total leg length, upper leg length, lower leg length, and the ratio of lower/upper leg length. While both upper leg length and the ratio of lower/upper leg length produced significant correlations, upper leg length accounted for the greatest amount of variance at 40%. While this is a moderate relationship (r = 0.65), 60% of the variance is still left unexplained.
10
More than a decade later, Morris and Londeree (1997) took a different approach and did not find that leg length could predict optimal crank length. They had six trained cyclists test three different crank lengths (165, 170, and 175 mm) by cycling for 105 minutes at approximately 65% of VO2max at 90 rpm. The selected gear was chosen based on a maximal CPET performed on the subject’s own bicycle, and then kept constant for all three trials. Prior to each trial, the subjects had a 2-week habituation period where they performed 225 km of training on the crank being tested next. Average oxygen uptake was used to categorize the crank lengths into high, medium and low efficiency categories. While the cyclists did have significant differences in the efficiency categories, there was not a significant relationship between the optimal crank length and total leg length, upper leg length or lower leg length. Several potential reasons for why the relationship was not significant include the small sample size, small range of crank lengths, small range in subject height (172.7-178.5 mm), and the standardization of cadence. With an increase in crank length at a constant cadence, the muscle shortening velocity increases due to the increased distance the foot must travel in the same amount of time. Therefore, optimal cadence will vary with crank length and could have been a confounding factor. This study highlights the fact that factors other than leg length including muscle fiber composition and preferred cadence may play a role in optimal crank length.
11
While the majority of the studies looking at the effects of leg length on optimal crank length have found a relationship exists, that relationship is not as clear or consistent as one might think, and some studies found the relationship to be insignificant. Leg length may be used to help predict optimal crank length, but there are clearly other factors playing a role.
Submaximal Aerobic Efficiency
As described in the studies above using leg length to predict optimal crank, some studies used maximal power to determine “optimal” crank length, while others looked at submaximal oxygen uptake (submaximal VO2), a marker of aerobic efficiency. Submaximal VO2 is one of the most relevant outcome measures to investigate in terms of endurance cycling events. Average submaximal VO2 gives an
indication of a cyclist’s ability to perform at a certain intensity over a longer duration and can therefore be a predictor of performance. The ability to perform the same workload at a lower average VO2 signifies improved efficiency or cycling economy. Since the 1950s, several researchers have looked at the effects of crank length on submaximal VO2 and tried to answer the question of whether altering crank length can improve cycling economy, regardless of leg length.
P.O. Åstrand (1953) was among the first to investigate the effects of adjusting crank length on any outcome measure. Using a treadmill-bicycle ergometer, one subject performed 7-9 trials using each of the crank lengths tested (160, 180, and 200 mm). At that time, 180 mm was considered the standard length. Each trial was performed at 20 km/hr at an incline of 2 degrees, and oxygen uptake was recorded. Results indicated no difference in submaximal VO2 between any of the three crank lengths. This study has severe limitations, such as using only one subject, and many factors including the time of each trial are unknown. However, Åstrand’s work highlighted that crank length is an important factor to be considered in optimizing bicycle fit and showed that in one individual, crank length could vary by +/- 20 mm with no impact on efficiency.
12
crotch height, they also sought to find which crank length corresponded with the lowest energy
expenditure. Using two different loads (60 W and 105 W), they tested the crank lengths for each subject as a proportion of crotch height (0.17, 0.20 and 0.23). Each experimental trial lasted 6 minutes, with average VO2 measured in the last two minutes. The subjects pedaled to a metronome, setting the cadence at 60 rpm. Improving upon Åstrand’s work, this study used ten different subjects, randomized the order of testing, and stated the set time period for each trial; however, they still found no differences in submaximal VO2 across the three crank lengths. The fact that they set the crank length based on a
proportion of leg length is beneficial for predicting optimal crank length based on leg length, but it makes it difficult to compare results to other studies using a set crank length. Additionally, the workloads used of 60 W and 105 W are very light for a competitive cyclist, and they did not conduct a maximal CPET, so the relative intensity for each subject is unknown.
13
Morris & Londeree (1997) had six trained cyclists compare only three cranks lengths with a small range (165, 170 and 175 mm) and a longer cycling duration (105 minutes). They chose a specific gear that would elicit approximately 65% of the VO2max achieved duringa maximal CPET and had the subjects maintain a fixed cadence of 90 rpm. Average velocity was calculated, and then average VO2 was divided by the velocity to determine the efficiency for each trial. Even with the small differences in crank length, they found a significant difference in efficiency across cranks lengths, but the optimal crank length varied by participant. They conclude that conducting a submaximal test is important to determine optimal crank length for an individual.
More recently, Ferrer-Roca et al. (2017) sought to determine if small changes in crank length (current length +/- 5 mm) had an effect on gross efficiency during submaximal cycling at three different workloads (150, 200, and 250 W) and a fixed cadence of 90 rpm. Twelve subjects performed three sets of three six minutes trials (one set on each crank length) in randomized order, and gross efficiency was defined as the ratio of work accomplished to energy expended in kcal · min-1. They found no significant differences in heart rate or gross efficiency. However, it is important to note the same limitations as previous studies where cadence is held constant and the relative intensity for each subject is unknown.
One last study presented at the 2016 ACSM Conference, Moscicki et al. (2016) took a different approach to the submaximal trials in the studies to date and sought to compare effects of crank length when in the aerodynamic position, as used on triathlon-specific and time trial bicycles. Ten male
triathletes performed 10-minute experimental trials on four crank lengths (145, 155, 165, and 175 mm) in randomized order. Instead of controlling power output, they adjusted the workload throughout the trial to maintain a VO2 at approximately 95% of VT. The primary outcome measures were average power output and cycling economy, or the power output in watts divided by VO2 in liters · min-1 during the last minute
of the trials. The results indicated a trend of increasing power output and cycling economy with
decreasing crank length, and there were significant differences between the 175 mm and 145 mm cranks.
While the study has several strengths including the relative intensity held at a race-simulated effort and
14
consider. First, the measures were only taken during the last minute of each experimental trial. While this
might be seen as where the measures have stabilized, it would be beneficial to know the averages
throughout the full 10-minute trial. Additionally, the maximal CPET performed to determine VT was
done only once using a 172.5 mm crank. If there are differences in VT when using different crank
lengths, the relative intensities set for the experimental trials would not be the same.
Maximal Anaerobic Power
Instead of using aerobic efficiencyas the primaryoutcome measure, other researchers have looked at maximal power instead. Some have speculated that with a smaller crank length, a cyclist may not be able to reach as high of a maximal power, or that it may be more difficult to maintain the same submaximal power. While the first studies used Wingate power tests to assess peak power, it was later found that the Wingate test does not accurately measure true maximum power. More recently, researchers have turned to shorter tests lasting only a few seconds. While this may give a more accurate
representation of peak power, the applicability to most cycling disciplines is questionable. Regardless, it is an interesting question to determine whether altering crank length can influence maximal aerobic power and what influence that may have on performance.
Inbar et al. (1983) were among the first to look at the effects of crank length on power output. They had 13 subjects perform Wingate tests on five different crank lengths (125, 150, 175, 200, and 225 mm) and measured mean power (30-s) and peak power (5-s). Using a parabola-fitting technique, they found the optimal crank length to be 164 mm for mean power and 166 m for peak power, approximately 10 mm shorter than the conventional crank length. However, of the crank lengths tested, the 175 mm was the best. This study was important to show that, while the same crank length may not be optimal for everyone, a crank shorter than the standard crank may be beneficial for the average individual in terms of anaerobic power.
15
regression analysis and quadratic trends, the determined optimal crank length to be 164 mm for peak power and 200 mm for mean power. 180 mm was the best of the crank lengths tested and significantly different from 110, 230, and 265 but not 145 mm. The main difference between the two studies was that Inbar et al. (1983) used a load of 7.5% of body weight for the Wingate test, while Too and Landwer (2000) used 8.5% of the body weight. While this may have played a role in the differing results, the selection of crank lengths may have as well. A standard crank (170 - 175 mm) was not tested, and there were uneven increments between the selected lengths.
J. C. Martin and Spirduso (2001) questioned the ability of the Wingate test to elicit maximal short-term cycling power, and therefore sought to determine the effects of crank length on maximal power using a 4-6 sec maximal power test instead. Trained cyclists (n = 16) performed maximal inertial load cycle ergometry using five different crank lengths (120, 145, 170, 195, and 220 mm). While they found that the 145 mm and 170 mm were significantly greater than 120 and 220, there was only a 4% variation across all crank lengths. They concluded that “standard laboratory equipment should not substantially compromise power for most adults.” They point out that the 170 mm would result in a loss of power of less than 0.5% for even the shortest and longest subjects in the study. While this might be the case, it does again show that opting for a slightly shorter crank length may be beneficial when in doubt between two options.
Macdermid and Edwards (2010) applied the principles of the literature on maximal power output to performance measures relevant to female cross-country mountain bike athletes. Instead of looking only at maximal power, they also investigated the effects of crank length on time to reach peak power.
16
underpowered to detect these changes, but it highlights the need to investigate whether crank length truly does impact VO2max and VT. This study may be the first and only study to date to have completed a maximal CPET on each crank length tested. However, the population of mountain bikers is far different from competitive road cyclists, the study was under powered to detect changes in VO2max and VT, these were not primary variables, and the changes in crank length may not have been great enough to elicit significant differences.
Pedaling Mechanics
In addition to variables such as power output and oxygen uptake, several studies have sought to investigate the biomechanical factors that may contributed to such differences when altering crank length. These variables include pedal rate, pedal speed, knee and hip angles, and joint torques. These factors may directly play a role in fatigue and possibly contribute to rates of injury.
In the study previously mentioned by J. C. Martin and Spirduso (2001), the researchers also looked at optimal pedal rate and pedal speed during the inertial load maximal power tests, and they found that optimal pedal rate decreases while pedal speed increases with increasing crank lengths. Tomas, Ross, and Martin (2010) then sought to determine whether pedaling rate or pedaling speed impact fatigue more by having seven subjects perform 30-second isokinetic fatiguing trials on a crank length of 120 mm and 220 mm. Pedal rate was optimized for each crank length (135 rpm for 120 mm and 109 rpm for 220 mm), and fatigue index was determined as (peak power – minimum power) / peak power. They concluded that fatigue increases with pedaling rate and not pedaling speed. Therefore, there was greater fatigue with the 120 mm crank and peak power was not impacted by pedal rate or pedal speed.
McDaniel, Durstine, Hand, & Martin (2002) also used crank length to separate pedal rate and pedal speed, asserting that pedal speed is a marker of the muscle shortening velocity while pedal rate reflects activation/relaxation rate. Nine subjects cycled for 15-min at four different pedal rates (40, 60, 80, and 100 rpm) with power increasing every 5-min (30, 60, and 90% of lactate threshold). This was
17
speeds. Using a stepwise multiple linear regression procedure, they found that 95% of variation in metabolic cost between crank lengths came from changes in power output, and 4% from pedal speed. They concluded that pedal rate does not play a major role in metabolic costs. This may indicate that with a shorter crank length, metabolic costs may be lower due to the lower pedal speed. The primary limitation of this study, similar to others, is that lactate threshold, which was used to set the cycling intensities, was determined only on one crank.
Barratt et al. (2011) looked at the effects of crank length on joint-specific power during maximal anaerobic power tests lasting 2-3 seconds. A total of 15 subjects performed the experimental trials on five cranks lengths (150, 165, 170, 175, and 190 mm). They found that the effect of crank length on relative joint-specific power production was dependent on the control of pedaling rate. Crank length did not affect relative joint-specific powers when pedaling rate was set to optimize maximum power, but it did
significantly affect relative power when pedaling rate was held constant at 120 rpm when comparing the shortest and longest cranks (150 and 190 mm). This calls into questions the ecological validity of the studies that have constrained cadence to the same value for all crank lengths tested.
Barratt, Martin, Elmer, and Korff (2016), using the same five crank lengths, also had the subjects perform two 30-second submaximal efforts at 240 W, one at a constant rate (90 rpm) and one at a
constant speed (1.6 m*s-1). Results showed that increases in pedal speed and crank length caused large increases knee and hip angular excursions and velocities. These studies together suggest there may be a tradeoff between metabolic and muscular stress, and that cyclists can select crank length on basis of other factors such as aerodynamics or injury prevention without compromising power.
18
of motion of the hip and knee joints. While these biomechanical factors did not alter the metabolic costs, they could have long-term adverse effects, increasing the change of over-use injuries.
Conclusion
While there have been a number of studies looking into the various effects of crank length, there are many inconclusive results and many areas yet to be investigated. This is especially true in sports like triathlon where the athletes are in a different position on the bicycle, aerodynamics become increasingly important, and the impact on post-cycling running is also called into question. To determine effects of crank length on performance in competitive road cyclists and other sports involving endurance road cycling, there are many limitations in the literature that need to be addressed. First, and most importantly, it is unknown if crank length affects VO2max and VT. While one study did conduct multiple maximal CPETs, there were only seven subjects, crank length only varied by 5 mm from the largest to smallest, and VO2max and VT were not primary outcomes. Additionally, even though not significant, there did appear to be a small difference in VT. Understanding if there are differences in VO2max and VT between crank lengths will aid in the interpretation of the previous literature and design of future studies.
Second, it has been shown that in general, optimal crank length varies by individual, and leg length is not the only impacting factor. Other factors may include, lower body strength, lower body power, preferred cycling cadence and/or submaximal cycling economy. Additional research is needed to determine how much those other factors play a role and if there is a combination of factors that could more accurately predict optimal crank length. If so, a model could be developed to be used by bicycle shops to optimize bicycle fit. If determining the best crank length for an individual was an easier process, perhaps cranks would become a more easily customizable option for individuals when purchasing a new bicycle.
19
their optimal cadence or even their preferred cadence, it is unknown if the results apply to cycling in their normal environment, reducing the ecological validity.
20
CHAPTER III
METHODS
Subjects
Twelve trained cyclists and multisport athletes, ages 18-35, were recruited for this study. Subjects had been actively training for the past year for either road cycling or multisport events involving road cycling and had averaged at least 3 hours/week of cycling over the past six months. Subjects were all healthy (classified as low risk individuals for participation in maximal exercise testing based on the guidelines set forth by the American College of Sports Medicine – ACSM) and free of any orthopedic injury that precluded successful completion of the study. Subjects underwent an electrocardiogram (ECG) at rest, completed a medical history questionnaire, and completed a PAR-Q (physical activity readiness questionnaire). The results of this health screening process were reviewed by a cardiologist member of the research who will determined if the subject was eligible to participate in this study.
Instrumentation
21
stethoscope (3M, St. Paul, MN, USA) were used to manually assess resting blood pressure by
auscultation at rest and at the end of each testing trial. Height was measured with a stadiometer (Detecto, Webb City, MO, USA), and a balance beam scale (Detecto, Webb City, MO, USA) was used to measure the subject’s weight. Lower body lean mass was assessed using a Discovery Dual Energy X-ray
Absorption (DEXA) scanner (Hologic, Inc., Bedford, MA). Hydration status was verified using
refractometer (TS Meter, American Optical Corp., Keene, NH, USA) prior to testing. Standing VJH was recorded using a Vertec measuring device (Sports Imports, Columbus, OH, USA).
The three trials were performed on a cycle ergometer (Velotron Pro ergometer with Dynafit Bike Frame, Spearfish, SD, USA) and 2010 Velotron Coaching Software was used to control the power and record power, cadence and heart rate. M7 PowerCranks (Walnut Creek, CA, USA) were installed on the ergometer to adjust crank length to 162.5, 172.5, and 182.5 mm. Knee, hip and shoulder angles were measured using a using a Lafayette extendable goniometer. Leg length and bicycle measurements were made using anthropometric tape. Saddle tilt was measured using universal digital inclinometer
(Baseline® Digital Inclinometer, 12-1057). Respiratory gas and oxygen consumption were assessed with a Parvo Medics TrueMax® 2300 Metabolic system (Parvo Medics, Salt Lake City, UT, USA). A Lactate Plus lactate analyzer (Sports Resource Group, Hawthorne, NY, USA) was used to determine blood lactate values while the Borg 6-20 scale (Borg, 1970) was used to quantify rating of perceived exertion
throughout each of the trials.
General Procedures
This study consisted of four total visits to the Exercise Oncology Research Lab (EORL), located in
Fetzer Gym on the campus of the University of North Carolina at Chapel Hill. After expressing verbal interest
in the study, the subject was contacted by email or phone to participate in a health screening for participation
(Visit 1). Subjects were asked to bring their own bicycle to the first visit. After subjects signed an informed
consent approved by the University of North Carolina Institutional Review Board (IRB), they completed the
22
experimental trials. Each visit occurred on a separate day and the three trials occurred at the same time of day
(within 1 hour earlier or later than the previous trial), at least 48 hours apart, and within a three-week period).
Subjects were blinded as to which of the three crank lengths they were testing for each trial. Females
completed all visits within the early follicular phase of their menstrual cycle to control for hormonal variations
that could impact aerobic capacity (Lebrun et al., 1995). Visits 2-4 took place within days 3-8 of their
23
Table 1: Summary of Study Protocol
Recruitment Visit 1 Visits 2-4
a) Contacted local triathlon and cycling clubs to recruit athletes in the area.
b) Approached potential subjects to introduce the study.
c) Provided detailed information about the study, and if interested, scheduled Visit 1.
a) Subjects reported to the EORL for all screening processes to ensure they qualified and were healthy enough to participate in the study. b) Subjects completed the informed consent form, PAR-Q, and a general medical history questionnaire. c) Subjects underwent
measurements and health screenings, including height and weight, leg length measures, DEXA, 12-lead ECG, resting HR and BP. They were asked about training history. d) The ergometer was set-up
to match the subject’s own bike.
e) The subject performed a familiarization trial on the ergometer, matching the maximal CPET protocol but ending when HR reached 75% of predicted max.
f) VJH was assessed using the Vertec.
g) Visits 2-4 were scheduled.
a) After physician clearance prior to visit 2, subjects reported to the EORL where they completed a questionnaire regarding fatigue, sleep, and diet. They also submitted a urine sample to ensure accurate hydration status prior to beginning the testing session.
b) The ergometer was set up in advance with either the 162.5, 172.5 or 182.5 mm crank (randomized counter-balanced order). Bike fit was verified using goniometer to measure knee, hip and shoulder angles.
c) Subjects performed a maximal CPET protocol on the ergometer (see protocol in table 2).
d) Subjects remained on the
ergometer, and blood lactate was taken 3 min after completion of the CPET.
e) At 5 min, subjects began the supra-max effort. The wattage was slowly increased over the first minute to 105% of maximal power from the CPET, and then subjects cycled for as long as they can.
f) Subjects rested for 30 min, then performed a 10-min light
submaximal effort at 70% of VT. g) Subjects rested for 20 min, then
24 Visit 1 (Screening, Initial Measures, and Familiarization)
Upon arrival to the lab for the first visit, subjects were provided with the informed consent and assigned a coded identification number. Then subjects completed the PAR-Q, a general medical history questionnaire, and asked about their training history. Seated resting blood pressure was assessed and then height and weight. Next, the subjects’ body composition was assessed with a full-body DEXA scan where lower body lean mass was analyzed segmentally (each leg) using the Hologic Discovery software. After the DEXA scan and having laid supine for approximate 10 minutes, a 12-lead resting electrocardiogram (ECG) was performed. Resting heart rate was recorded from the ECG, and the results of all the initial screening assessments were reviewed by a physician member of the research team prior to the first maximal CPET. The subjects had additional measurements taken to determine total leg length, upper leg length and lower leg length, as follows:
• Total leg length: Measured from the anterior superior iliac spine (ASIS) to the inferior
border of the medial malleolus.
• Upper leg length: Measured from the greater trochanter of the femur to the joint line of
the knee on the lateral side.
• Lower leg length: Measured from the joint line of the knee on the lateral side of the
inferior border of the lateral malleolus. These measures are consistent with Morris & Londeree (1997).
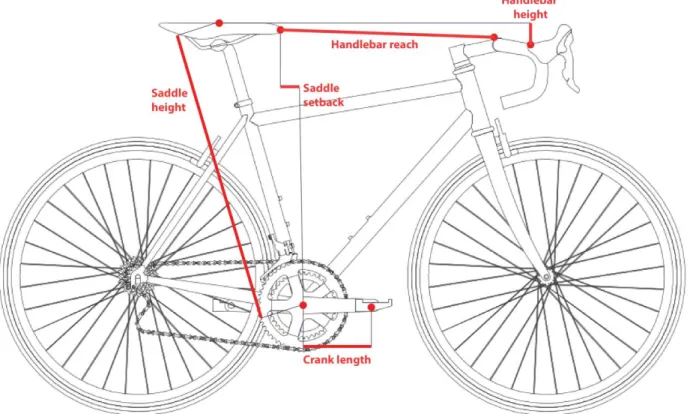
Next, the cycle ergometer was adjusted to reflect the subject’s current bicycle. The bicycle was measured to determine saddle height and setback, handlebar height, handlebar reach, and crank length using anthropometric tape, as shown in Figure 1. Saddle tilt was also matched using a digital
25
Figure 1. Bicycle Measurements: Saddle height, saddle setback, handlebar height, handlebar reach, and crank length.
26
subject were sent home with guidelines to follow for the remaining visits. Subjects were asked to replicate and record exercise for 24 hours prior, and diet 12 hours prior to each trial.
Visits 2-4 (CPET, Supra-max and Submax)
Visits 2-4 consisted of three identical trials, with the exception of crank length, which was
adjusted to either 162.5, 172.5, or 182.5 mm in randomized, counter-balanced order. Saddle height, saddle setback, and handlebar height were also adjusted for each crank length to maintain the knee, hip and shoulder angles at dead center bottom of the pedal stroke.
Each trial began with subjects completing a pre-trial questionnaire to ensure they followed the pre-assessment guidelines for testing. If any guidelines were not followed or perceived fatigue and/or muscle soreness was above a 2, the trial was rescheduled. Weight, blood pressure and hydration status were assessed, and then bicycle fit was checked. If the hydration status was not adequate (urine specific gravity of < 1.020), the trial was rescheduled. Subjects then performed a warm-up involving five minutes between 100 - 150 W. Heart rate was recorded at the end to ensure a similar warm-up effect was achieved between trials. Subjects were allowed to stretch on or off the bike after the warm-up. The exact warm-up protocol including wattage and stretches was recorded and replicated identically on subsequent trials. Subjects were then fitted with the mask and rested for three minutes prior to the trial, allowing the metabolic cart to stabilize.
The maximal CPET protocol shown in Table 2 consisted of one-minute stages with an increase of 25W every minute. Oxygen uptake (VO2), carbon dioxide expired (VCO2), ventilation (VE), and the respiratory exchange ratio (RER) were measured every 10 seconds throughout the testing session. Rating of perceived exertion (RPE) was assessed at the end of each stage and at the conclusion of the testing protocol, and heart rate was measured continuously throughout the test. Criteria for test termination included:
27
3. The researcher stops the test due to an overt medical concern;
4. Oxygen consumption does not increase more than 150 ml/min, despite an increase in workload. This indicates the subject has reached their physiological VO2max and there is no reason to continue the test; or
5. The subject can no longer maintain a cadence of 60 rpm or greater.
Following the CPET, the subjects remained on the cycle ergometer with the mask off. After three minutes, a drop of blood was collected using a standardized finger prick technique and analyzed for blood lactate concentration with a lactate plus analyzer. At five minutes, the mask was put back on and the supra-max effort began. Over the first minute, the power was brought up to 105% of the maximum power achieved during the maximal CPET. Subjects were instructed to hold the effort as long as possible, and the same termination criteria was used. During both the maximal CPET and supra-max, subjects were allowed to alternate their hands between the hoods, tops or drops of the handlebars, but they had to remain seated throughout the test.
Subjects had a total of 30 minutes between the supra-max and the first submaximal trial. After the completion of the supra-max test, subjects pedaled at a very low intensity (40 W) for approximately three minutes with the mask off to recover. Then, subjects were helped off the cycle ergometer and allowed to lay supine or seated during the rest period and drink water as desired. Gatorade chews were provided if the subject was feeling light-headed or hungry. During this time, the researchers calculated VT from the results of the maximal CPET and determined the workloads for the light and vigorous submaximal efforts. The metabolic cart was turned off, flushed and recalibrated.
At 27 minutes, the subjects got back on the ergometer and remained resting with the mask on in order to allow the metabolic cart to stabilize for three minutes. The light submaximal trial took place first, with the goal of keeping the VO2 values at 70% of VT. Subjects performed a three-minute warm-up, increasing the power every 30 seconds to reach the goal VO2. Following the warm-up, power was
28
procedures were followed for the vigorous submaximal effort but VO2 kept at 95% of VT. For the submaximal efforts, subjects remained seated throughout and hand position was standardized to the top part of the handlebars (either tops or hoods) to maintain similar hip and shoulder angles.
VO2max and VT Determination
For the determination of a maximal effort during the maximal CPET (VO2max), three of five criteria below must have been met:
1. A blood lactate greater than or equal to 8.0 mmol;
2. A lack of increase in oxygen uptake (no more than 150 ml/min) with increasing workload; 3. A heart rate maximum within 10 bpm of age-predicted maximum heart rate (220-age); 4. A respiratory exchange ratio greater than or equal to 1.10; and
5. An RPE greater than or equal to 17.
If three of the five criteria were not met, the test was considered a VO2peak test, instead of a VO2max test (American College of Sports Medicine, 2014).
VO2max was analyzed using 10-second averaging and taking the average of the three highest values in the final minute of the CPET. The same method was used to determine VO2max from the supra-max. ‘True’ VO2max was considered verified when the VO2max values from the maximal CPET and the supra-max trial are within ± 3 % (Nolan, Beaven, & Dalleck, 2014). If the supra-max VO2max was higher, it was used as the ‘true’ VO2max.
VT was determined using the V-slope method (Casaburi et al., 1977; Wasserman et al., 1973) to determine the point at which pulmonary ventilation increased (exponentially) relative to exercise
29
Table 2: Cycle Ergometer Maximal CPET Protocol
Stage Time (min) Workload (W)
1 0-3 20
2 3-4 45
3 4-5 70
4 5-6 95
5 6-7 120
6 7-8 145
7 8-9 170
8 9-10 195
9 10-11 220
10 11-12 245
11 12-13 270
12 13-14 295
13 14-15 320
14 15-16 345
15 16-17 370
16 17-18 395
17 18-19 420
18 19-20 445
19 20-21 470
20 21-22 495
30 Statistical Analyses
Primary Aim: Characterize and compare the three crank lengths in terms of VO2max and VT during maximal CPET.
Null Hypothesis 1.1: In terms of mean VO2max values obtained during the maximal CPET, the differences among the three crank lengths are all zero in the target population.
Null Hypothesis 1.2: In terms of mean VT values obtained during the maximal CPET, the differences among the three crank lengths are all zero in the target population.
Based on the literature in submaximal oxygen uptake and maximal power, it was reasonable to expect mean VO2max and VT to vary with crank length and to see a significant difference in both primary variables between the largest and smallest cranks, however, it was not known which crank would produce the highest or lower levels of maximum oxygen uptake. Both hypotheses were analyzed using individual repeated measures analysis of variance (ANOVAs) to compare VO2max and VT across the three crank lengths. If and only if the omnibus repeated measures ANOVA F-test was significant at level α = 0.05, pairwise comparisons using t-tests of size α = 0.05 were used. All hypothesis tests that were observed to be not statistically significant were reported as being inconclusive. The focus of the analyses was on the point- and interval- estimates to describe the differences among the crank lengths.
31
32
CHAPTER IV
RESULTS
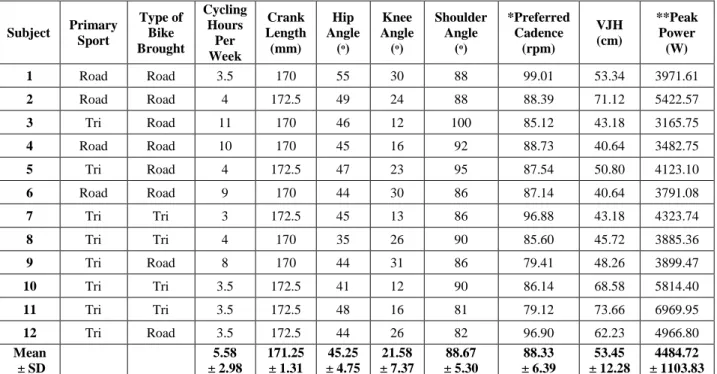
The primary purpose of this study was to examine the effects of crank length on VO2max and VT. Twelve trained cyclists and multisport athletes completed a maximal CPET, a supra max effort, and two 10-minute submaximal efforts. Individual characteristics as well as the means and standard deviations are presented below in Table 3. Cycling characteristics of each subject as well as the results of the vertical leap test are presented in Table 4.
Table 3: Subject Characteristics
Subject Gender Age (years) Height (cm) Weight (kg) BMI (kg/m2)
Body Fat (%) *Lower Body Lean Mass (kg) Total Leg Length (cm) Upper Leg Length (cm) Lower Leg Length (cm)
1 M 26 171.0 61.2 20.9 19.1 15.2 93.5 41.0 41.5
2 M 22 176.5 63.5 20.4 14.2 17.8 92.0 44.5 41.5
3 M 27 170.7 61.0 20.9 17.0 14.8 93.0 44.0 41.5
4 M 28 172.2 69.9 23.6 13.1 18.3 88.5 44.0 41.7
5 M 22 175.0 68.0 22.2 12.6 20.2 99.2 46.5 48.0
6 F 25 162.0 72.4 27.6 34.5 15.9 91.0 38.5 40.0
7 M 30 192.5 85.6 23.1 18.1 21.2 101.5 47.0 47.0
8 M 20 172.0 69.9 23.6 27.1 16.2 96.5 49.0 42.0
9 M 24 175.0 67.6 22.1 13.5 18.7 93.2 42.0 44.0
10 M 33 172.0 72.1 24.4 10.6 21.8 99.0 47.0 45.0
11 M 20 189.0 88.9 24.9 17.4 21.8 102.7 43.2 46.7
12 M 21 178.5 68.0 21.3 20.0 16.5 94.7 41.7 45.0
Mean ± SD 24.83 ± 4.13 175.54 ± 8.21 70.68 ± 8.63 22.92 ± 2.07 18.10 ± 6.77 18.21 ± 2.55 95.42 ± 4.40 44.04 ± 2.99 43.67 ± 2.65
33
Table 4: Cycling Characteristics and Vertical Leap Test Results
Subject Primary
Sport Type of Bike Brought Cycling Hours Per Week Crank Length (mm) Hip Angle (ᵒ) Knee Angle (ᵒ) Shoulder Angle (ᵒ) *Preferred Cadence (rpm) VJH (cm) **Peak Power (W)
1 Road Road 3.5 170 55 30 88 99.01 53.34 3971.61
2 Road Road 4 172.5 49 24 88 88.39 71.12 5422.57
3 Tri Road 11 170 46 12 100 85.12 43.18 3165.75
4 Road Road 10 170 45 16 92 88.73 40.64 3482.75
5 Tri Road 4 172.5 47 23 95 87.54 50.80 4123.10
6 Road Road 9 170 44 30 86 87.14 40.64 3791.08
7 Tri Tri 3 172.5 45 13 86 96.88 43.18 4323.74
8 Tri Tri 4 170 35 26 90 85.60 45.72 3885.36
9 Tri Road 8 170 44 31 86 79.41 48.26 3899.47
10 Tri Tri 3.5 172.5 41 12 90 86.14 68.58 5814.40
11 Tri Tri 3.5 172.5 48 16 81 79.12 73.66 6969.95
12 Tri Road 3.5 172.5 44 26 82 96.90 62.23 4966.80
Mean ± SD 5.58 ± 2.98 171.25 ± 1.31 45.25 ± 4.75 21.58 ± 7.37 88.67 ± 5.30 88.33 ± 6.39 53.45 ± 12.28 4484.72 ± 1103.83
As described on page 28, subjects were required to meet three of the five criteria established a priori in order for results of the CPET to be considered ‘true’ VO2max. The supra-max test was used to verify the max, and if the peak from the supra-max was within +/- 3% of the peak from the CPET, the highest value was used as the ‘true’ VO2max. In this case, everyone except for subject 6 met at least three of the five criteria for each of their max tests, but subject 6’s supra-max results did verify the CPET results. Therefore, all subjects were considered to have achieved their ‘true’ VO2max. The maximal CPET parameters as well as total time and peak power are shown below in Table 5a.
Table 5a: CPET Results – Maximal Effort Parameters
Total CPET Time
(min) Peak Power (W) Final RPE Peak HR (bpm) Lactate (mmol/L) Peak RER
Crank Length (mm)
Subject 162.5 172.5 182.5 162.5 172.5 182.5 162.5 172.5 182.5 162.5 172.5 182.5 162.5 172.5 182.5 162.5 172.5 182.5
1 14.43 14.43 14.28 320 320 320 19 19 19 197 200 194 11.40 14.00 9.90 1.20 1.19 1.249
2 14.10 13.65 13.65 295 295 295 19 18 17 185 188 184 16.50 12.90 12.00 1.32 1.25 1.25
3 17.23 17.18 16.68 395 395 370 19 19 19 183 193 185 10.40 10.50 11.90 1.24 1.18 1.17
4 17.00 16.85 16.88 370 370 370 20 20 20 190 188 189 14.30 12.30 12.50 1.24 1.17 1.22
5 17.48 17.27 17.57 395 395 395 19 20 19 193 192 192 11.10 13.10 11.70 1.15 1.17 1.16
6 14.15 14.13 14.15 320 320 320 19 19 19 174 171 171 6.40 8.20 7.50 1.07 1.05 1.07
7 18.03 17.75 18.02 395 395 395 18 19 19 179 182 179 9.70 11.10 11.20 1.11 1.21 1.08
8 13.90 14.18 13.83 295 320 295 20 20 20 176 182 182 9.90 13.50 - 1.12 1.19 1.15
9 18.27 19.15 19.25 420 445 445 20 20 20 171 176 179 12.40 - 9.10 1.10 1.11 1.11
10 16.20 16.28 16.22 370 370 370 19 19 20 188 194 190 8.90 9.30 9.20 1.17 1.18 1.21
11 17.72 18.20 18.27 395 420 420 20 20 20 190 190 190 15.30 14.60 14.90 1.12 1.19 1.15
12 17.10 17.12 17.13 395 395 395 19 20 20 190 190 188 9.10 9.10 9.70 1.10 1.12 1.25
Null Hypothesis 1.1 stated, “in terms of mean VO2max values obtained during the maximal CPET, the differences among the three crank
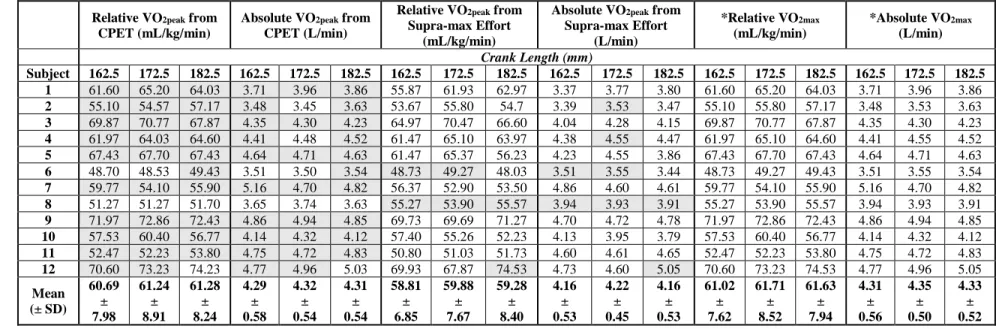
lengths are all zero in the target population.” The mean absolute and relative VO2max values (highest values of the CPET and supra-max) were used in the analysis. Results of the one-way repeated measures ANOVAs showed no significant differences between relative VO2max values (p = 0.498) or absolute VO2max values (p = 0.656) on the three crank lengths. Peak values from the CPET and supra-max as well as the true VO2max values are presented in Table 5b.
Table 5b: CPET Results – Maximal Oxygen Consumption
Relative VO2peak from CPET (mL/kg/min)
Absolute VO2peak from CPET (L/min)
Relative VO2peak from Supra-max Effort
(mL/kg/min)
Absolute VO2peak from Supra-max Effort (L/min) *Relative VO2max (mL/kg/min) *Absolute VO2max (L/min)
Crank Length (mm)
Subject 162.5 172.5 182.5 162.5 172.5 182.5 162.5 172.5 182.5 162.5 172.5 182.5 162.5 172.5 182.5 162.5 172.5 182.5
1 61.60 65.20 64.03 3.71 3.96 3.86 55.87 61.93 62.97 3.37 3.77 3.80 61.60 65.20 64.03 3.71 3.96 3.86
2 55.10 54.57 57.17 3.48 3.45 3.63 53.67 55.80 54.7 3.39 3.53 3.47 55.10 55.80 57.17 3.48 3.53 3.63
3 69.87 70.77 67.87 4.35 4.30 4.23 64.97 70.47 66.60 4.04 4.28 4.15 69.87 70.77 67.87 4.35 4.30 4.23
4 61.97 64.03 64.60 4.41 4.48 4.52 61.47 65.10 63.97 4.38 4.55 4.47 61.97 65.10 64.60 4.41 4.55 4.52
5 67.43 67.70 67.43 4.64 4.71 4.63 61.47 65.37 56.23 4.23 4.55 3.86 67.43 67.70 67.43 4.64 4.71 4.63
6 48.70 48.53 49.43 3.51 3.50 3.54 48.73 49.27 48.03 3.51 3.55 3.44 48.73 49.27 49.43 3.51 3.55 3.54
7 59.77 54.10 55.90 5.16 4.70 4.82 56.37 52.90 53.50 4.86 4.60 4.61 59.77 54.10 55.90 5.16 4.70 4.82
8 51.27 51.27 51.70 3.65 3.74 3.63 55.27 53.90 55.57 3.94 3.93 3.91 55.27 53.90 55.57 3.94 3.93 3.91
9 71.97 72.86 72.43 4.86 4.94 4.85 69.73 69.69 71.27 4.70 4.72 4.78 71.97 72.86 72.43 4.86 4.94 4.85
10 57.53 60.40 56.77 4.14 4.32 4.12 57.40 55.26 52.23 4.13 3.95 3.79 57.53 60.40 56.77 4.14 4.32 4.12
11 52.47 52.23 53.80 4.75 4.72 4.83 50.80 51.03 51.73 4.60 4.61 4.65 52.47 52.23 53.80 4.75 4.72 4.83
12 70.60 73.23 74.23 4.77 4.96 5.03 69.93 67.87 74.53 4.73 4.60 5.05 70.60 73.23 74.53 4.77 4.96 5.05
Mean (± SD) 60.69 ± 7.98 61.24 ± 8.91 61.28 ± 8.24 4.29 ± 0.58 4.32 ± 0.54 4.31 ± 0.54 58.81 ± 6.85 59.88 ± 7.67 59.28 ± 8.40 4.16 ± 0.53 4.22 ± 0.45 4.16 ± 0.53 61.02 ± 7.62 61.71 ± 8.52 61.63 ± 7.94 4.31 ± 0.56 4.35 ± 0.50 4.33 ± 0.52
*The highest value between the CPET and supra-max was used as the ‘true’ VO2max. Shaded numbers represent the value used as VO2max.
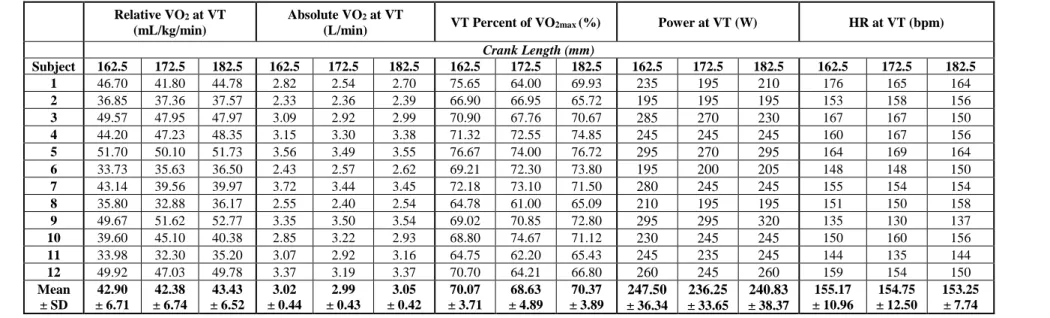
Null Hypothesis 1.2 stated, “in terms of mean VT values obtained during the maximal CPET, the differences among the three crank lengths are all zero in the target population.” The mean absolute and relative VO2 at VT values were used in the analysis. Results of the one-way repeated measures ANOVAs showed no significant difference between relative VO2 at VT values (p = 0.365) or absolute VO2 at VT values (p = 0.420). VT parameters are shown below in Table 5b.
Table 5c: CPET Results – Ventilatory Threshold
Relative VO2 at VT (mL/kg/min)
Absolute VO2 at VT
(L/min) VT Percent of VO2max (%) Power at VT (W) HR at VT (bpm)
Crank Length (mm)
Subject 162.5 172.5 182.5 162.5 172.5 182.5 162.5 172.5 182.5 162.5 172.5 182.5 162.5 172.5 182.5
1 46.70 41.80 44.78 2.82 2.54 2.70 75.65 64.00 69.93 235 195 210 176 165 164
2 36.85 37.36 37.57 2.33 2.36 2.39 66.90 66.95 65.72 195 195 195 153 158 156
3 49.57 47.95 47.97 3.09 2.92 2.99 70.90 67.76 70.67 285 270 230 167 167 150
4 44.20 47.23 48.35 3.15 3.30 3.38 71.32 72.55 74.85 245 245 245 160 167 156
5 51.70 50.10 51.73 3.56 3.49 3.55 76.67 74.00 76.72 295 270 295 164 169 164
6 33.73 35.63 36.50 2.43 2.57 2.62 69.21 72.30 73.80 195 200 205 148 148 150
7 43.14 39.56 39.97 3.72 3.44 3.45 72.18 73.10 71.50 280 245 245 155 154 154
8 35.80 32.88 36.17 2.55 2.40 2.54 64.78 61.00 65.09 210 195 195 151 150 158
9 49.67 51.62 52.77 3.35 3.50 3.54 69.02 70.85 72.80 295 295 320 135 130 137
10 39.60 45.10 40.38 2.85 3.22 2.93 68.80 74.67 71.12 230 245 245 150 160 156
11 33.98 32.30 35.20 3.07 2.92 3.16 64.75 62.20 65.43 245 235 245 144 135 144
12 49.92 47.03 49.78 3.37 3.19 3.37 70.70 64.21 66.80 260 245 260 159 154 150
Exploratory Analysis:
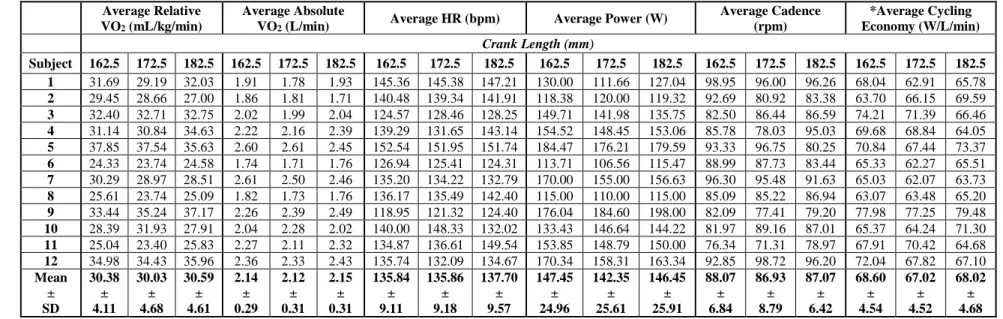
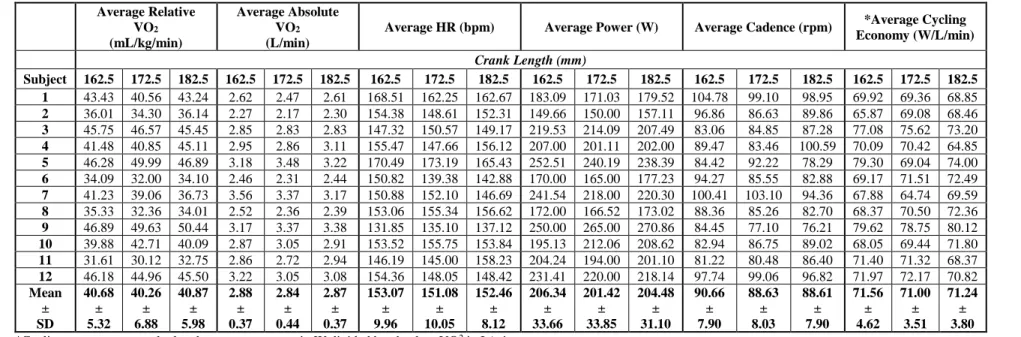
As part of the exploratory analysis, two submaximal trials were completed. The first trial was considered light intensity and included a 3-min warm-up and 3-min of steady state at 70% of VT. The second trial was considered vigorous intensity and included a 3-3-min warm-up and 10-min of stead state at 95% of VT. Results of the submaximal trials are presented below in Table 6a and 6b. All averages were computed from the 10-min of steady state. No significant differences were found between crank length for average VO2, power, cadence, or cycling economy.
Table 6a: Light Submaximal Trial Results
Average Relative VO2 (mL/kg/min)
Average Absolute
VO2 (L/min) Average HR (bpm) Average Power (W)
Average Cadence (rpm)
*Average Cycling Economy (W/L/min)
Crank Length (mm)
Subject 162.5 172.5 182.5 162.5 172.5 182.5 162.5 172.5 182.5 162.5 172.5 182.5 162.5 172.5 182.5 162.5 172.5 182.5
1 31.69 29.19 32.03 1.91 1.78 1.93 145.36 145.38 147.21 130.00 111.66 127.04 98.95 96.00 96.26 68.04 62.91 65.78
2 29.45 28.66 27.00 1.86 1.81 1.71 140.48 139.34 141.91 118.38 120.00 119.32 92.69 80.92 83.38 63.70 66.15 69.59
3 32.40 32.71 32.75 2.02 1.99 2.04 124.57 128.46 128.25 149.71 141.98 135.75 82.50 86.44 86.59 74.21 71.39 66.46
4 31.14 30.84 34.63 2.22 2.16 2.39 139.29 131.65 143.14 154.52 148.45 153.06 85.78 78.03 95.03 69.68 68.84 64.05
5 37.85 37.54 35.63 2.60 2.61 2.45 152.54 151.95 151.74 184.47 176.21 179.59 93.33 96.75 80.25 70.84 67.44 73.37
6 24.33 23.74 24.58 1.74 1.71 1.76 126.94 125.41 124.31 113.71 106.56 115.47 88.99 87.73 83.44 65.33 62.27 65.51
7 30.29 28.97 28.51 2.61 2.50 2.46 135.20 134.22 132.79 170.00 155.00 156.63 96.30 95.48 91.63 65.03 62.07 63.73
8 25.61 23.74 25.09 1.82 1.73 1.76 136.17 135.49 142.40 115.00 110.00 115.00 85.09 85.22 86.94 63.07 63.48 65.20
9 33.44 35.24 37.17 2.26 2.39 2.49 118.95 121.32 124.40 176.04 184.60 198.00 82.09 77.41 79.20 77.98 77.25 79.48
10 28.39 31.93 27.91 2.04 2.28 2.02 140.00 148.33 132.02 133.43 146.64 144.22 81.97 89.16 87.01 65.37 64.24 71.30
11 25.04 23.40 25.83 2.27 2.11 2.32 134.87 136.61 149.54 153.85 148.79 150.00 76.34 71.31 78.97 67.91 70.42 64.68
12 34.98 34.43 35.96 2.36 2.33 2.43 135.74 132.09 134.67 170.34 158.31 163.34 92.85 98.72 96.20 72.04 67.82 67.10
Mean ± SD 30.38 ± 4.11 30.03 ± 4.68 30.59 ± 4.61 2.14 ± 0.29 2.12 ± 0.31 2.15 ± 0.31 135.84 ± 9.11 135.86 ± 9.18 137.70 ± 9.57 147.45 ± 24.96 142.35 ± 25.61 146.45 ± 25.91 88.07 ± 6.84 86.93 ± 8.79 87.07 ± 6.42 68.60 ± 4.54 67.02 ± 4.52 68.02 ± 4.68
*Cycling economy was calculated as average power in W divided by absolute VO2 in L/min.
Table 6b: Vigorous Submaximal Trial Results Average Relative VO2 (mL/kg/min) Average Absolute VO2 (L/min)
Average HR (bpm) Average Power (W) Average Cadence (rpm) *Average Cycling
Economy (W/L/min)
Crank Length (mm)
Subject 162.5 172.5 182.5 162.5 172.5 182.5 162.5 172.5 182.5 162.5 172.5 182.5 162.5 172.5 182.5 162.5 172.5 182.5
1 43.43 40.56 43.24 2.62 2.47 2.61 168.51 162.25 162.67 183.09 171.03 179.52 104.78 99.10 98.95 69.92 69.36 68.85
2 36.01 34.30 36.14 2.27 2.17 2.30 154.38 148.61 152.31 149.66 150.00 157.11 96.86 86.63 89.86 65.87 69.08 68.46
3 45.75 46.57 45.45 2.85 2.83 2.83 147.32 150.57 149.17 219.53 214.09 207.49 83.06 84.85 87.28 77.08 75.62 73.20
4 41.48 40.85 45.11 2.95 2.86 3.11 155.47 147.66 156.12 207.00 201.11 202.00 89.47 83.46 100.59 70.09 70.42 64.85
5 46.28 49.99 46.89 3.18 3.48 3.22 170.49 173.19 165.43 252.51 240.19 238.39 84.42 92.22 78.29 79.30 69.04 74.00
6 34.09 32.00 34.10 2.46 2.31 2.44 150.82 139.38 142.88 170.00 165.00 177.23 94.27 85.55 82.88 69.17 71.51 72.49
7 41.23 39.06 36.73 3.56 3.37 3.17 150.88 152.10 146.69 241.54 218.00 220.30 100.41 103.10 94.36 67.88 64.74 69.59
8 35.33 32.36 34.01 2.52 2.36 2.39 153.06 155.34 156.62 172.00 166.52 173.02 88.36 85.26 82.70 68.37 70.50 72.36
9 46.89 49.63 50.44 3.17 3.37 3.38 131.85 135.10 137.12 250.00 265.00 270.86 84.45 77.10 76.21 79.62 78.75 80.12
10 39.88 42.71 40.09 2.87 3.05 2.91 153.52 155.75 153.84 195.13 212.06 208.62 82.94 86.75 89.02 68.05 69.44 71.80
11 31.61 30.12 32.75 2.86 2.72 2.94 146.19 145.00 158.23 204.24 194.00 201.10 81.22 80.48 86.40 71.40 71.32 68.37
12 46.18 44.96 45.50 3.22 3.05 3.08 154.36 148.05 148.42 231.41 220.00 218.14 97.74 99.06 96.82 71.97 72.17 70.82
Mean ± SD 40.68 ± 5.32 40.26 ± 6.88 40.87 ± 5.98 2.88 ± 0.37 2.84 ± 0.44 2.87 ± 0.37 153.07 ± 9.96 151.08 ± 10.05 152.46 ± 8.12 206.34 ± 33.66 201.42 ± 33.85 204.48 ± 31.10 90.66 ± 7.90 88.63 ± 8.03 88.61 ± 7.90 71.56 ± 4.62 71.00 ± 3.51 71.24 ± 3.80
*Cycling economy was calculated as average power in W divided by absolute VO2 in L/min.