AMBIENT AIR POLLUTION, ALLERGIC SENSITIZATION, RESPIRATORY OUTCOMES AND SYMPTOMS: FINDINGS FROM THE 2005-2006 NATIONAL
HEALTH AND NUTRITION EXAMINATION SURVEY
Charles H. Weir, MPH, MS EnvE
A dissertation submitted to the faculty of the University of North Carolina at Chapel Hill in partial fulfillment of the requirements for the degree of Doctor of Philosophy in the
Department of Environmental Sciences and Engineering.
Chapel Hill 2013
Approved by:
William Vizuete, PhD Karin B. Yeatts, PhD Louise M. Ball, PhD
Jacqueline MacDonald Gibson, PhD Darryl C. Zeldin, MD
Abstract
CHARLES H. WEIR: Ambient Air Pollution, Allergic Sensitization, Respiratory Outcomes, and Symptoms: Findings from the 2005-2006 National Health and Nutrition
Examination Survey
(Under the direction of William Vizuete, PhD)
Respiratory allergic diseases and symptoms are extremely prevalent in the
industrialized world. Allergic sensitization is characterized by elevated levels of IgE and is a risk factor for the development of asthma and allergic disease. Air pollution has been investigated as a possible risk factor for both allergic sensitization and respiratory allergic disease. Despite extensive investigation, the relationship between ambient air pollution, allergic sensitization, and respiratory allergic diseases remains unclear. To better
understand the relationship between ambient air pollution, allergic sensitization, and respiratory allergic diseases, we linked monitored annual average concentrations of nitrogen dioxide (NO2), particulate matter ≤ 10 µm (PM10), particulate matter ≤ 2.5
(PM2.5), and summer concentrations of ozone (O3) from the US Environmental Protection
and per 5 µg/m3 for PM2.5. Results: Using CMAQ data, increased levels of NO2 were
associated with positive IgE to any (aOR 1.15, 95% CI 1.04, 1.27), inhalant (aOR 1.17, 95% CI 1.02, 1.33), and outdoor (aOR 1.16, 95% CI 1.03, 1.31), allergens. Increased levels of PM2.5 were associated with indoor allergen-specific IgE (aOR 1.24, 95% CI
1.13, 1.36). We found positive associations between current allergies and increased O3
Acknowledgements
So many people have helped me complete my doctorate. First, I would like to thank my wife, Cherita, and daughter, Christiane, for their understanding during the many hours that I was not available to them. I also thank my parents, Charles and Johnnie Weir, for instilling me with a desire to learn.
Within the School of Public Health, everyone with whom I interfaced was helpful. I would like to thank my research advisor, Dr. William Vizuete, for his guidance, support, and flexibility to allow me to pursue a multidisciplinary project with an emphasis outside of his area of expertise. I also thank Dr. William Vizuete for introducing me to my committee co-chair, Dr. Karin Yeatts. Dr. Yeatts provided invaluable guidance in epidemiology and encouragement throughout the project. My other committee members were also extremely helpful. Dr. Louise Ball provided valuable advice in selecting my program of study and understanding my linkage to the world of CERCLA, Superfund and environmental health. Dr. Haitao Chu provided guidance early in the project on
statistical methods. I also benefited from the fresh look at my work from Dr. Jacqueline MacDonald Gibson who was the last addition to my committee.
In addition, I thank Dr. Jeremy Sarnat from the Department of Environmental Health Sciences at the Rollins School of Public Health at Emory University. Dr. Sarnat provided invaluable insight into exposure assessment.
I also thank my coauthors that were not committee members (Richard D. Cohn, Renee Jaramillo and Paivi Salo) for their support, expertise and contributions to the project. I owe a great deal of thanks to Michele Sever for her advice, support and reviews, also.
I could not have started the project without the help of the CDC family. First, my two years on campus at UNC was funded by the National Center for Environmental
Health/Agency for Toxic Substances and Disease Registry. Dr. Tom Sinks, Sharon Campolucci, G. David Williamson, Alden Henderson, Vikas Kapil, and Steve Dearwent were all extremely supportive. My research was conducted at the National Center for Health Statistics Research Data Center (RDC). All of the staff (Stephanie Robinson, Alexandra Ehrlich, Ajay Yesupriya and Carolyn Neal) at the Atlanta RDC were
extremely professional and helpful. Nataliya Kravets was invaluable with her experience in data linkage of air pollution data to NCHS data sets. Jennifer Parker was extremely helpful and shared her experience and insight gained from her experience analyzing NCHS linked data sets.
Table of Contents
List of Tables ...x
List of Figures ... xii
List of Abbreviations ... xiii
Chapter 1. Background and Significance...1
Air Pollution ... 2
Community Multiscale Air Quality (CMAQ) Model ... 5
Possible Biologic Mechanisms ... 7
Evidence of allergic sensitization as a risk factor for asthma and other respiratory allergic diseases ... 7
Evidence of air pollution as risk factor in allergic sensitization ... 9
Evidence for air pollution associated with respiratory outcomes ... 17
Specific Aims ... 18
Figures ... 19
Chapter 2. Air Pollution and Allergic Sensitization: Results from the 2005-2006 NHANES – Specific Aim 1 ...21
Background ... 21
Methods ... 23
Population and Study Sample ... 23
Air Pollution Exposure Assignment ... 23
Allergic Sensitization ... 25
Statistical Analyses ... 27
Results ... 28
Discussion ... 30
Tables ... 37
Chapter 3. Air Pollution, Asthma and Allergies in the 2005-2006 National Health and Examination Survey – ...43
Specific Aim 2 ...43
Background ... 43
Methods ... 44
Study Design, Population, and Study Sample ... 44
Air Pollution Exposure Assignment ... 45
Variable Definitions ... 47
Statistical Analyses ... 47
Results ... 49
Discussion ... 51
Tables ... 57
Chapter 4. Discussion ...63
Findings ... 63
Strengths ... 66
Limitations ... 67
Public Health Relevance ... 68
Conclusions ... 68
Future Research ... 69
Appendix A. Supplemental Tables ...70
List of Tables
Table 1. Characteristics of the total sample and subsamples with
pollutant data ...37 Table 2. Weighted prevalence of sensitization for participants with and
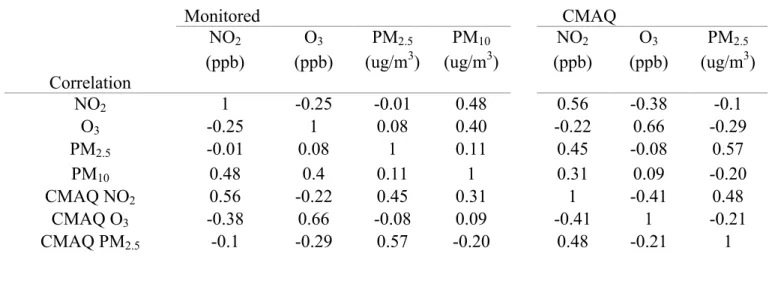
without air pollution data...38 Table 3. Monitored and CMAQ Pollutant Concentrations ...39 Table 4. Pearson Correlations of Monitored and CMAQ Pollutant
Concentrations ...40 Table 5. Adjusted odds ratios and 95% Cls between air pollution
concentrations and allergen-specific IgE for ages ≥ 6 ...41 Table 6. Characteristics of the total sample and subsamples with
pollutant data ...57 Table 7. Weighted prevalence of allergic outcomes for participants
with or without air pollution data ...58 Table 8. Monitored and CMAQ Pollutant Concentrations ...59 Table 9. Pearson Correlations of Monitored and CMAQ Pollutant
Concentrations ...60 Table 10. Associations (ORs, 95% CIs) between air pollution
concentrations and allergic outcomes for adults and children ...61 Table 11. Adjusted Odds Ratios and 95% CIs for CMAQ Pollutants and
Allergic Outcomes Stratified by Sensitization Status ...62 Table A1. Associations between air pollution concentrations and
allergen-specific IgE for ages ≥ 6 ...71 Table A2. Associations between air pollution concentrations and allergic
outcomes for ages ≥ 6 ...72 Table A3. Adjusted Odds Ratios and 95% CIs Stratified by Cotinine –
Monitored Data ...73 Table A4. Adjusted Odds Ratios and 95% CIs Stratified by Age –
Table A5. Adjusted Odds Ratios and 95% CIs Stratified by Gender –
Monitored Data ...75 Table A6. Adjusted Odds Ratios and 95% CIs Stratified by Ethnicity –
Monitored Data ...76 Table A7. Adjusted Odds Ratios and 95% CIs Stratified by Cotinine –
CMAQ Data...77 Table A8. Adjusted Odds Ratios and 95% CIs Stratified by Age –
CMAQ Data...78 Table A9. Adjusted Odds Ratios and 95% CIs Stratified by Gender –
CMAQ Data...79 Table A10. Adjusted Odds Ratios and 95% CIs Stratified by Ethnicity –
CMAQ Data...80 Table A11. Adjusted Odds Ratios and 95% CIs of Monitored Air
Pollution and Allergic Outcomes Stratified by Age ...82 Table A12. Adjusted Odds Ratios and 95% CIs of Monitored Air
Pollution and Allergic Outcomes Stratified by Gender ...83 Table A13. Adjusted Odds Ratios and 95% CIs of CMAQ Air Pollution
Concentrations and Allergic Outcomes Stratified by Gender ...84 Table A14. Adjusted Odds Ratios and 95% CIs of CMAQ Air Pollution
and Allergic Outcomes Stratified by Ethnicity ...85 Table A15. Adjusted and unadjusted associations (ORs, 95% CIs)
between CMAQ air pollution concentrations and
allergen-specific IgE for ages ≥ 6-17 and ages 18 and older ...86 Table A16. Adjusted and unadjusted associations (ORs, 95% CIs)
between CMAQair pollution concentrations and allergic
outcomes for ages ≥ 6-17 and ages 18 and older ...87 Table A17. Summary of epidemiologic studies reviewed in Chapter 1. ...88 Table D1. Variables used in the investigation of air pollution, allergic
List of Figures
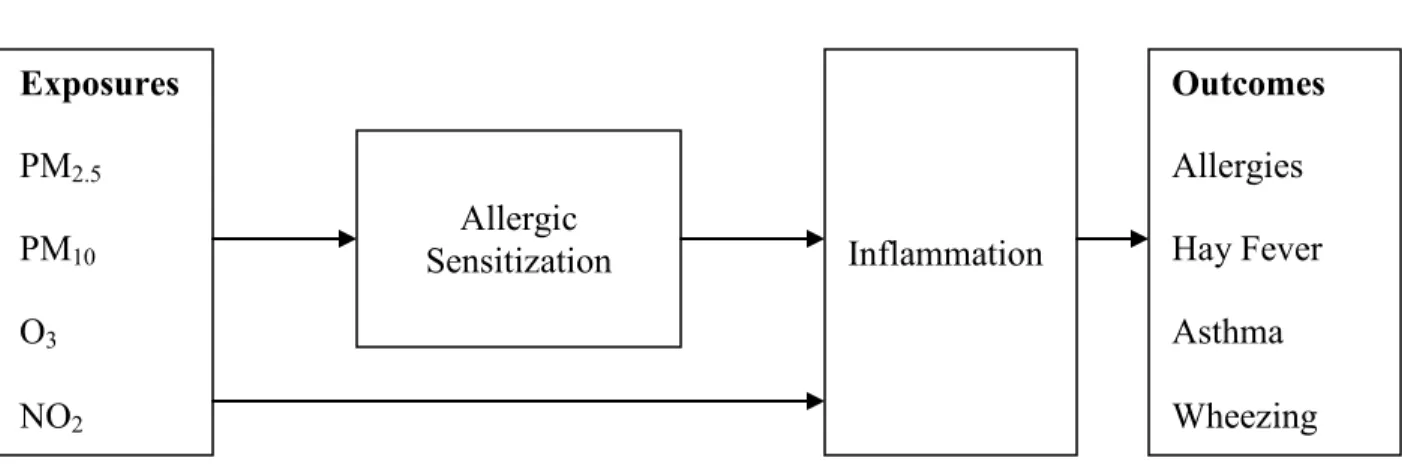
Figure 1. Conceptual model for the relationship between particulate matter (PM), ozone (O3), nitrogen dioxide (NO2) and allergic
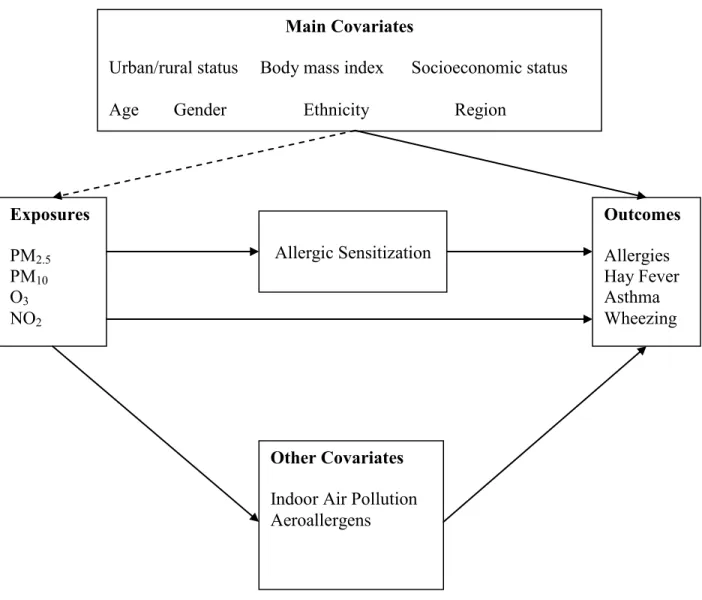
outcomes ...19 Figure 2. Conceptual model of the relationship between air pollution,
List of Abbreviations
aOR adjusted prevalence odds ratio AQS Air Quality System
CI confidence interval
CMAQ Community Multiscale Air Quality IgE Immunogloblin E
MEC mobile exam center NO2 Nitrogen Dioxide
NHANES National Health and Nutrition Examination Survey PM2.5 Particulate Matter with aerodynamic diameter ≤ 2.5 µm
PM10 Particulate Matter with aerodynamic diameter ≤ 10 µm
Chapter 1. Background and Significance
Asthma and allergic diseases are extremely prevalent in the industrialized world and represent a challenge for the public health and medical community (Kim et al. 2011; Marshall 2004; Parker et al. 2009; Salo et al. 2011; Takizawa 2011). Allergic diseases result in more physician visits than any other disease except cardiovascular disease and are among the top fifteen physician-diagnosed illnesses (Marshall 2004).
Asthma is a chronic inflammatory disease of the conducting airways characterized by airway constriction, hyper-responsiveness, coughing, wheezing, chest tightness, and shortness of breath (Chung 2002). Between 1980 and 1996 the prevalence of self-reported asthma increased 73.9% in the US (Moorman et al. 2007). Air pollution has also increased during this period in most industrialized nations (Riedl 2008). The current asthma prevalence for 2001-2003 was higher in children (8.5%) than adults (6.7%). Blacks had the highest prevalence of any race (9.2%), compared with whites (6.9%) with the lowest prevalence. The prevalence among those below the federal poverty level was 10.3% compared to 6.4% - 7.9% for those above the poverty line (Moorman et al. 2007).
2007). Allergic rhinitis results in an estimated $3.4 billion dollars in annual medical costs in the US. In addition, approximately 20 million school days are lost and 3.5 million workdays are lost. Lost wages are estimated at $154 million dollars as a result of seasonal allergies (Marshall 2004). The increase in the prevalence of allergic diseases has not been completely explained by either environmental or genetic factors (Kim et al. 2012; Takizawa 2011). Outdoor air pollution has been extensively investigated as a possible risk factor that may help explain the increase in incidence and prevalence of allergic diseases. Generally, ambient air pollution levels of the six criteria pollutants in the US have decreased over the same period where the prevalence of asthma and other allergic diseases have increased (EPA 2001). Despite this progress, over 150 million people in the US live in counties where at least one criteria pollutant exceeds the National Ambient Air Quality Standard (EPA 2008). Ozone and PM2.5 were the most problematic. In
2007, almost 145 million people in the US lived in counties where the ozone standard was exceeded and almost 74 million people lived in counties where the PM2.5 standard was exceeded
(EPA 2008). Air Pollution
concentrations of precursors in the atmosphere, and the rates of chemical reactions of the precursors (EPA 2006).
In urban areas, the largest emissions sources of VOCs and oxides of nitrogen are combustion sources. Of combustion sources, motor vehicles represent the largest source of VOCs and oxides of nitrogen. For oxides of nitrogen electricity generating units and non road mobile sources also represent significant emissions sources. In the US, outdoor levels of ozone are regulated by the EPA through the National Ambient Air Quality Standards. Ozone levels in the US are highest in the summer months. Ozone levels vary geographically with the highest peak values occurring in California, Texas, and some counties in the East. Highest mean daily values also occur in California, states in the Southwest, and some counties in the East. (EPA 2008).
A key feature of ozone chemistry is nonlinearity in ozone formation. This nonlinearity is caused by competition between VOCs and NOx for the OH radical. When the ratio of VOCs to NOx is high, OH will react primarily with VOCs. At a low VOC/NOx ratio, NOx can
predominate. Considering a hypothetical urban mix of VOCs when the instantaneous VOC-to-NOx ratio is less than about 5.5:1, OH reacts predominantly with NO2, removing radicals and
retarding ozone formation. Under these conditions, a decrease in NOx concentration favors O3
formation. At a sufficiently low concentration of NOx or a sufficiently high VOC –to-NO2 ratio,
a further decrease in NOx favors peroxy-peroxy reactions which retard O3 formation by
simulate this nonlinearity will likely provide better estimates. Air quality models are designed to simulate the nonlinear physics and chemistry of the atmosphere and may provide better estimates than linear interpolation at unmeasured points (Bell 2006).
Because of its low solubility, ozone can travel deep into the lung and can damage tissue in alveolar regions of the lung due to its reactivity and oxidant properties (Costa 2001). Ozone may oxidize unsaturated and polyunsaturated lipids, thiol groups of proteins and DNA creating reactive oxygen species such as superoxide, hydrogen peroxide and the hydroxyl radical (Yang and Omaye 2008). These resulting free radicals may contribute to a state of oxidative stress when the body’s antioxidant defense mechanisms are overcome by an excess of free radicals (Kelly 2003).
Nitrogen dioxide is a strong, relatively insoluble oxidant but not as strong as ozone. Because of its oxidant properties, NO2 may also contribute to the oxidative stress in the lung
(Kelly 2003). Nitrogen dioxide is emitted from combustion sources but is mostly formed in the atmosphere from the oxidation of NO to NO2. Nitrogen dioxide is one of many precursors in
ozone formation. Traffic is typically the largest source of oxides of nitrogen in urban areas while electricity generating units are significant sources in some rural areas. Nitrogen dioxide displays seasonal and diurnal variability. In contrast to ozone, higher concentrations are observed during the winter months in the US with lower concentrations in the summer months (EPA 2008). Particulate air pollution varies in size, chemical composition and shape (EPA 2004). For regulatory purposes, the EPA has categorized particulate air pollution into several categories for monitoring. PM10 refers to particles collected by sampler with an upper 50% cut point of 10 um
cut point of 2.5 um. Particle size is a large factor in determining where the particle will deposit in the respiratory tract. Smaller particles travel further along the respiratory tract. Diesel exhaust particles have been used as a model particulate for much of the recent research on particulates (Riedl 2008; Riedl and Diaz-Sanchez 2005).
Particulate air pollution is a mixture of metals and organic compounds. Both soluble metals and polyaromatic hydrocarbon components of particulate matter have been suggested as responsible for the toxicity of particulates. In the western United States, the mass component of particulates is comprised primarily of nitrogen compounds while the mass component of particulates in the eastern US is comprised primarily of sulfates. In addition to particulate pollution being emitted, secondary aerosols also form in the atmosphere from free, adsorbed or dissolved gases. The chemical and physical processes that form secondary aerosols are
nonlinear. Similar to estimating ozone concentrations, this nonlinearity in the atmospheric processes of formation must be kept in mind when selecting methods to estimate concentrations at unmeasured locations (EPA 2004).
Community Multiscale Air Quality (CMAQ) Model
CMAQ generates pollutant estimates by simulating the chemistry and physics of the atmosphere using air pollution emissions and meteorological data as inputs. CMAQ can predict concentrations for ozone, NO2 and particulates. CMAQ is often used by state air pollution
control agencies to assess how proposed air quality management changes might impact air pollution concentrations (EPAa 2011; EPAb 2011).
performance varies by season, pollutant, grid resolution and averaging time. EPA’s traditional operational model evaluation approach has commonly reported measures of model bias and error to determine model performance. Mean or median bias is the average of the difference between the modeled and monitored concentrations. Mean or median error is the absolute value of this difference.
The Environmental Protection Agency (EPA) has also reported bias and error measures normalized by the monitored concentration. A recent performance evaluation of CMAQ v4.7 by Foley et al. (2010) using 36 km grid resolution reported that CMAQ overpredicts maximum eight hour ozone concentrations in summer and winter with normalized median bias of 6.9% and normalized median error of 14.5%. In contrast, CMAQ overestimates PM2.5 in summer and
underestimate PM2.5 in winter. Foley et al. (2010) reported a normalized median bias of -28.4
percent and normalized median error of 37.0 percent for urban monitoring sites. In contrast, at rural monitoring locations, Foley et al. reported a normalized median bias of -6.4 percent and normalized median error of 29.1 percent.
Less performance evaluation information is available for NO2. A recent performance
Possible Biologic Mechanisms
Asthma and respiratory allergic disease are not completely understood. Both particulate air pollutants and gaseous air pollutants have been hypothesized to play a role in allergic disease. Current research suggests that air pollution contributes to the prevalence of asthma and other respiratory allergic diseases through an immunoglobulin (Ig) E mediated pathway and by contributing to oxidative stress through the generation of reactive oxygen and reactive nitrogen species (Li et al. 2003). A growing body of literature has suggested that oxidative stress and nitrative stress are critical factors in the development of airway inflammation (Bolwer 2002; Sugiura and Ichinose 2008). Ozone, nitrogen dioxide and PM2.5, because of their physical and
chemical characteristics, have the potential to produce reactive oxygen species (ROS) and
reactive nitrogen species (RNS) respectively upon reacting with airway tissue. An excess of ROS or RNS can cause an imbalance between oxidants and antioxidants resulting in oxidative stress. A review by Ckless et al. (2011) indicated that environmentally generated as well as
endogenously generated ROS/RNS interact with epithelium dendritic cells, and CD4+ T cells to promote allergic sensitization. The conceptual diagram presented in Figure 3 illustrates plausible mechanistic pathways among air pollution, allergic sensitization, asthma and potential
confounders based on review of the existing literature.
Evidence of allergic sensitization as a risk factor for asthma and other respiratory allergic diseases
childhood and adult asthma (Pearce et al.1999; Becker and Chan-Yeung 2008). According to Johansson and Lundahl (2001) atopy is present in approximately 60 % of asthmatic adults and 80% of asthmatic children. Atopy is a much stronger factor in childhood asthma than adult asthma (Johansson and Lundahl 2001). The relationship between atopy and asthma has been investigated in two large cross-sectional studies. Arbes et al. (2007) investigated the relationship between atopy and asthma in the US using data from NHANES III among ages 6 to 59.
NHANES III is a national population based cross-sectional survey conducted from 1988 – 1994. A subset of NHANES III participants (12,106) were selected for allergy skin testing. In
NHANES III, atopy was determined from skin puncture prick tests (Arbes et al. 2007). The results of the Arbes et al. (2007) investigation indicated that 56.3% of the US asthma cases were attributable to atopy. Arbes et al. also noted that this percentage was greater among males than females, higher among persons in the highest education category than in lower education categories and higher in metropolitan areas than other areas. The percentage of asthma cases attributable to atopy was also highest in the Northeast compared to other census regions (Arbes et al. 2007). They noted that there are likely co-factors that strengthen or weaken the effect of atopy on asthma specifically mentioning allergen exposure. Another possible explanation could be ambient air pollution exposure given its higher levels in metropolitan areas. Ambient air pollution exposure was not a component of the Arbes et al. (2007) study.
ranged from 4% to 61 % among centers (Sunyer et al. 2004). Sunyer et al. (2004) noted that the variation is likely explained by variations in factors related to the expression of asthma and the prevalence of allergic sensitization. Similar to the Arbes et al. (2007) study, ambient air pollution may be a factor that could possibly explain the variation in the fraction of asthma attributable to atopy. This question was investigated as a follow up to ECRHS as part of ECRHS II for PM 2.5
but did not indicate an association. The investigation will be presented in more detail in the next section.
Several studies have investigated the geographical variation in the prevalence of allergic sensitization only. Bousquet et al. (2007) investigated the geographical variation in the
prevalence of positive skin tests in the European Community Respiratory Health Survey I. The researchers studied adults aged 20 – 44 at 35 centers in fifteen developed countries throughout Europe, the USA, Australia, New Zealand and Iceland. The researchers administered skin prick tests for nine common aeroallergens: Dematophagoides pteronyssinus, timothy grass, cat, Cladosporium herbarium, Alternaria, birch, Olea europea, common ragweed and Parietaria judaica. The results indicated geographical variation in the prevalence of sensitization to each of the 9 allergens tested and in the prevalence of sensitization to any allergen. The prevalence of positive skin tests ranged from 17.1% to 54.8% with a median of 36.8%. The researchers also concluded that the results were consistent with those obtained using serum IgE.
Evidence of air pollution as risk factor in allergic sensitization
mite allergen to non-sensitized monkeys. The researchers exposed the 24 infant rhesus monkeys to eleven episodes of filtered air, house dust mite aerosol, ozone and ozone with house dust mite. Twelve of the monkeys were sensitized to house dust mite allergen and twelve were not. The IgE response from exposure to ozone with house dust mite was significantly higher than ozone alone or filtered air alone. Neither ozone exposure alone nor house dust mite exposure alone in sensitized monkeys was significantly different than filtered air (Schelegle et al. 2003). Osebold et al. (1988) found an ozone enhancement effect in a study of mice. The researchers exposed mice to ozone concentrations of 0.24, 0.16, 0.13, and 0.10 ppm for four days. After this
continuous exposure, the researchers exposed the mice to an aerosolized solution of ovalbumin. This cycle was repeated after the mice were held for several days in ambient air. A control group of mice were held in ambient for the entire experiment. Mice that had been exposed to ozone only without albumin did not develop anaphylaxis. In comparison, the group of mice that received ozone and ovalbumin became anaphylactically sensitized (Osebold et al. 1988)
Gilmour et al. (1996) investigated the effects of acute NO2 exposure on immune
responses and lung inflammatory cells in sensitized rats exposed to house dust mite allergen. The aim of the research was to determine whether exposure to NO2 modulates immune responses to
house dust mite and influences immune mediated lung disease (Gilmour et al. 1996). The researchers exposed Brown Norway rats to 5 ppm NO2 for 3 hours after immunization with
Dermatophagoides farinae and Dermatophagoides pteronyssinus. The experiment resulted in
Bevelander et al. (2007) provided additional support for adjuvant properties of NO2. In
the Bevelander et al. experiment, the researchers exposed mice to NO2 followed by inhalation of
innocuous ovalbumin (OVA). The researchers noted induced allergic sensitization to inhaled ovalbumin after one hour of exposure to 10 ppm NO2. The mice developed OVA specific IgE,
IgG1, Th2 cytokine responses and eosinophilic inflammation and mucous cell metaplasia in the lungs (Bevelander et al. 2007).
A number of animal studies also provide support for diesel exhaust as an adjuvant. A mice study by Takafuji et al. (1987) evaluated intranasal inoculation of diesel exhaust particles (DEPs) that indicated enhanced IgE production. Enhanced IgE and IgG1 production against dust mite allergen was demonstrated in a mice study by Suzuki et al. (1996).
Although evidence from animal studies is strong, the weight of evidence from animal studies is far less than epidemiologic studies when determining the relationship between exposure and potential adverse health effects because of the physiological differences between humans and animals. Evidence from animal studies provides a plausible basis for conducting epidemiologic studies to clarify exposure disease relationships.
Epidemiologic investigations of ambient air pollution and allergic sensitization have often reached conflicting results. This is in contrast to animal studies where a growing number of studies of diesel exhaust indicate an association. Most epidemiologic evidence suggests that ambient air pollution is not independently associated with allergic sensitization. There is also considerable variation in the assessment of exposure and in the assessment of allergic
Most epidemiologic investigations of the relationship between air pollution and allergic sensitization have used cross-sectional designs. A cross-sectional study by Charpin et al. (1999) investigated the relationship between NO2, SO2, ozone and atopy in January and February 1993.
The investigators studied 2604 school children ages ten and eleven in seven French communities near the Mediterranean Sea. Atopy was measured by skin prick tests. Air pollution
concentrations were measured over the two month period using one monitor for each of the seven communities. The researchers used the average concentration over this period. The
investigators reported that an association was not found between any of the air pollutants and the prevalence of atopy, but did not report point estimates or confidence intervals (Charpin et. al. 1999).
A much larger cross-sectional study by Bedada et al. (2007) investigated the relationship between particulate matter and allergic sensitization in 21 metropolitan areas throughout Europe. The investigation of 6364 adults ages 20-44 evaluated the relationship between fine particulate mass, PM2.5 and allergic sensitization as measured by serum IgE. The researchers defined
allergic sensitization as a specific IgE level of 0.70 kU/l or greater. The Bedada et al. (2007) study used an approach similar to the Charpin et al. (1999) study to estimate regional background air pollution concentrations. For each of the 21 centers, the researchers identified one monitor to represent regional background concentrations for the study subjects for each center. Bedada et al. (2007) did not find an association between PM2.5 and allergic sensitization (aOR 1.02, CI [0.95,
In contrast to the Bedada et al. (2007) and Charpin et al. (1999) studies, which evaluated regional background air pollution, Wyler et al. (2000) investigated air pollution from motor vehicle traffic. In a cross sectional study, Wyler et al. (2000) used the average number of cars and trucks passing a given address as the exposure metric to investigate air pollution and allergic sensitization. The researchers investigated 820 adults ages 18 – 60 in the Swiss Study on Air Pollution and Lung Diseases in Adults (Wyler et al. 2000). This study was conducted in Basel-Stadt, a city of about 200,000 in the northwestern part of Switzerland (Wyler et al. 2000). Sensitization was determined by skin prick tests to eight aeroallergens: timothy grass, pellitory-of-the wall, birch pollen, house dust mite, cat and dog epithelia) and molds Alternaria tenuis and Cladosporium herbarum (Wyler et al. 2000). This cross-sectional analysis did not indicate an association between motor vehicle traffic and sensitization to indoor allergens but did indicate an association with an increase in sensitization to pollen. Using the lowest quartile of four
categories of exposure as the referent, the adjusted odds ratios for the three categories of increasing exposure respectively were aOR 1.99, 95% CI (0.91-4.38), aOR 2.47 95% CI (1.06-5.73) and aOR 2.83 95% CI 1.26-6.31). The researchers adjusted for educational level, smoking behavior, number of siblings, age, sex and family history of atopy. In a study similar to Wyler et al. (2000), Janssen et al. (2003) investigated the relationship between air pollution and allergic sensitization in children. Janssen et al. investigated the relationship between air pollution from heavy traffic and allergic sensitization, bronchial hyper-responsiveness and respiratory
measurement of PM 2.5, soot, NO2 and benzene at the 24 participating schools from April 1997 –
July 1998. Sensitization was measured by skin prick tests and serum IgE. Janssen et al. identified an association between NO2 and allergic sensitization by skin prick test reactivity
(aOR 1.70, 95% CI 1.03-2.81, n=1141). Associations were not found with any pollutant with current wheeze, ever having asthma or hay fever.
In another study of the relationship between air pollution and allergic sensitization in children, Penard-Morand et al. (2005) used a much larger sample size than Janssen et al. (2003) Penard-Morand et al. (2005) investigated the relationship between long-term exposure to SO2,
PM10, and O3 and allergic sensitization in 9615 French school children ages 9-11 compared to
only 881 in the Wyler et al. (2000) study. The investigators limited exposure misclassification by restricting their analyses to children who had spent at least three years at the same residence prior to the clinical exam. The researchers also evaluated a smaller group that had lived at the same residence at least eight years prior to the clinical exam. The investigators estimated three-year average concentrations based on measured values of air pollution. Only ozone was associated with atopy after adjusting for potential confounders (aOR 1.34, 95% CI 1.24-1.46). The confounders were not clearly identified. The investigators defined atopy as one positive skin prick test to at least one of seven aeroallergens.
Just as in the Penard-Morand et al. (2005) study, Oftedal et al. (2007) also studied the relationship between long term air pollution exposure and allergic sensitization. The
investigators studied exposure to PM10, PM2.5 and NO2 among school children born in Oslo,
PM2.5, NO2 and house dust mite and cat allergens prior to adjustment for socioeconomic
contextual variables. The investigators adjusted for gender, body mass index, keeping furry pets now and in early lifetime, wall-to-wall carpeting now and in early lifetime, dampness problems in early lifetime, parental ethnicity, atopy, smoking now and maternal smoking in pregnancy or in early lifetime. The investigators also adjusted for the following neighborhood contextual socioeconomic factors: percentage of unmarried residents, households with income below the median, residents with primary education only, with manual class only, non dwelling owners, flat dwellers and dwellers with less than one room per capita. After adjustment for contextual factors, the associations lost significance.
Most epidemiologic studies that have investigated the relationship between air pollution and allergic sensitization have been cross-sectional. In contrast, several cohort studies have been conducted. Morgenstern et al. (2008) conducted a longitudinal investigation of the relationship between PM2.5 and NO2 and allergic sensitization in 5352 children. The children were part of the
German Infant Nutritional Intervention (GINI) study and the Influences of Lifestyle-related Factors on the Immune System and the Development of Allergies in East and West Germany (LISA) prospective birth cohorts. The cohorts were followed during the first six years of life. Morgenstern et al. (2008) studied atopic diseases and symptoms and allergic sensitization at ages four and six. The researchers found positive association between PM2.5 and asthmatic bronchitis
(aOR, 1.56; 95% CI 1.03-2.37), hay fever (aOR, 1.59; 95% CI 1.11-2.27) and allergic
sensitization to pollen (aOR 1.40; CI 1.20-1.64). The researchers found a borderline association between NO2 and eczema (aOR, 1.18; 95% CI 1.00-1.19). The investigators included variables
cooking, home dampness, indoor molds and pets. In contrast, three prospective birth cohort studies did not find associations between air pollution and allergic sensitization (Brauer et al. 2007; Gehring et al. 2010; Kramer et al. 2009).
In contrast to the Bedada et al. (2007) and Charpin et al. (1999) studies, which examined regional contrasts in exposure using only one monitor per site, Morgenstern et al. (2008) used a linear model using land use factors and air pollution measurements to interpolate estimates from surrounding monitors for each participant based on their location. The investigators found a positive association between PM2.5 and distance to the nearest roadway and allergic sensitization.
This finding is consistent with previous in vitro and animal studies but is in contrast to most observational epidemiologic studies. The researchers noted using individual-based exposure assessment as a possible explanation for finding an association where other studies did not (Morgenstern et al. 2008).
Studies that found positive associations between ambient air pollution and allergic sensitization were mostly based on air pollution from traffic sources and were smaller studies. Larger population based studies such as the Bedada et al. (2007) ECRHS II study and the
Charpin et al. (1999) study did not find an association between ambient air pollution and allergic sensitization. Both the Bedada et al. (2007) and the Charpin et al. (1999) studies relied on central site monitors to characterize air pollution exposure. It is not clear whether the different
conclusions represent valid findings or whether they reflect limitations in the exposure
Evidence for air pollution associated with respiratory outcomes
McConnell et al. (2002) investigated the risk of exercise and high ambient air pollution exposure in children in twelve Southern California communities. The researchers followed 3535 children with no previous history of asthma for five years in a cohort study. The investigators found a higher incidence of asthma among heavy exercisers in communities with high ozone. The relative risk of developing asthma was 3.3 (95% CI 1.9 – 5.8). High ozone communities were characterized by an average eight hour concentration of 59.6 ppb compared to 40 ppb in low ozone communities. Evidence of increased asthma incidence related to ozone exposure in Southern California strengthens the evidence for ozone as a risk factor of asthma and further supports the need to investigate this relationship in a national population-based study.
Additional evidence for the increase in asthma incidence associated with air pollution exposure was provided by Anderson et al. (2013). Anderson et al. (2013) conducted a meta analysis of seventeen cohorts. Thirteen of the studies had estimates for NO2 and five had estimates for
PM2.5. Anderson et al. (2013) reported a statistically significant association for NO2 [aOR= 1.07
95% CI 1.06, 1.26)] but not for PM2.5 [aOR=1.16 (0.98, 1.37)].
population-based studies of respiratory outcomes in the US have been published but did not include quantitative measures of allergic sensitization. In addition, many of the studies of air pollution and respiratory health in Europe have focused on traffic-related air pollution exposures in urban areas. The profile of diesel emissions in Europe is different than the United States leading to potentially different exposures in the US compared to Europe. Given the evidence of adjuvant properties of diesel particulates, observational epidemiologic studies are needed to determine whether associations observed in European studies can also be observed in a sample
representative of the US population (Barck et al. 2002; Bevelander et al. 2007; Gilmour et al. 1996; Osebold et al. 1988; Riedl and Diaz-Sanchez 2005; Schelegle et al. 2003). Recent evidence of ozone contributing to the incidence of asthma in children although limited has created an even greater urgency for explaining the relationship between ozone and allergic sensitization.
Specific Aims
We used two different exposure assignment methods: monitored data and modeled air pollution data from the Community Multiscale Air Quality (CMAQ) model to analyze cross-sectional data from the 2005-2006 National Health and Nutrition Examination Survey (NHANES). With this data we investigated the following three specific aims:
Specific Aim 1 – Determine whether exposure to ozone (O3), PM2.5, PM10, and nitrogen
dioxide (NO2) is associated with allergic sensitization.
Specific Aim 2 – Determine whether exposure to O3, PM2.5, PM10, and NO2 is associated
Specific Aim 3 – Determine whether allergic sensitization status modifies the relationship between O3, PM2.5, PM10, and NO2 and current allergies, current hay fever, current asthma,
and current wheezing.
A conceptual model of the relationship between aims 1-3 is presented in figures 1 and 2. Chapter 2 contains findings for our investigation of specific aim1, followed by specific aims 2 and 3 in chapter 3. Chapter 4 will provide and overarching synthesis and discussion of specific aims 1 – 3.
Figures
Figure 1. Conceptual model for the relationship between particulate matter (PM), ozone (O3),
nitrogen dioxide (NO2) and allergic outcomes
Exposures PM2.5
PM10
O3
NO2
Allergic
Sensitization Inflammation
Figure 2. Conceptual model of the relationship between air pollution, allergic sensitization, and allergic outcomes
Main Covariates
Urban/rural status Body mass index Socioeconomic status Age Gender Ethnicity Region
Exposures PM2.5
PM10
O3
NO2
Allergic Sensitization
Outcomes Allergies Hay Fever Asthma Wheezing
Chapter 2. Air Pollution and Allergic Sensitization: Results from
the 2005-2006 NHANES – Specific Aim 1
Background
Both particulate and gaseous air pollutants have been hypothesized to play a role in the development and exacerbation of allergic diseases (Bjorksten 1997; Parnia et al. 2002; Riedl 2008; Takafuji and Nakagawa 2000). Allergic or atopic sensitization is a strong risk factor for childhood and adult asthma and is characterized by increased IgE production for specific antigen exposure. IgE can be detected by measurements in blood. (Becker and Chan-Yeung 2008; Ring 2005).
The evidence for a link between air pollution and allergic sensitization is inconsistent. Experimental studies provide a biological basis for gaseous and particulate air pollutants as risk factors for allergic sensitization by showing enhanced IgE production after exposure to NO2, O3
and particulates (Gilmour 1995; Gilmour et al. 1996; Osebold et al.1988; Takafuji and Nakagawa 2000). However, results from epidemiologic studies are equivocal. Positive
In contrast, four prospective birth cohort studies conducted in Europe did not find associations between air pollution and allergic sensitization (Brauer et al. 2007; Gehring et al. 2010; Gruzieva et al. 2012; Kramer et al. 2009). Positive associations in the study by Brauer et al. (2007) were limited to sensitization to food allergens and not inhalant allergens. Several cross-sectional studies also did not find associations between ambient air pollution and allergic sensitization (Bedada et al. 2007; Charpin et al. 1999; Hirsch et al. 1999; Rosenlund et al. 2009). To date, most epidemiologic studies of air pollution and allergic sensitization have been
conducted in Europe and have focused on air pollution from traffic sources. Diesel emissions represent the largest source of particulate matter from motor vehicles and have been
hypothesized to be an adjuvant for allergic sensitization (Riedl and Sanchez 2005). Diesel vehicles are a much larger percentage of the vehicle fleet in Europe than the US (Bauner et al. 2009). Recent studies of air pollution and asthma or allergies using nationally representative samples of the US population did not assess allergic sensitization. In addition, these studies relied on monitoring data alone, and as a result, focused on study subjects mostly in major metropolitan areas (Akinbami et al. 2010; Parker et al. 2009). No population-based studies of air pollution and allergic sensitization representative of the US population have been conducted.
participants who did not live near air pollution monitors, resulting in a sample more representative of the US population.
Methods
We analyzed data from the NHANES 2005-2006 database. The 2005-2006 survey oversampled Mexican Americans, African Americans, ages 60 and older, adolescents 12 – 19, and persons with low income to increase the reliability and precision of health status indicator estimates for these groups (Heeringa 2010; NCHS 2010). Our analysis was reviewed and
approved by the University of North Carolina Chapel Hill Institutional Review Board. The study participants gave informed consent when they agreed to participate in the NHANES study.
Population and Study Sample
The 2005-2006 NHANES included 10,348 participants. We limited our analysis to participants ages 6 and older who were examined in the mobile exam center (MEC) (n=8086). Among the 8086 participants, 7268 had complete data for all 19 specific IgEs, 686 had no IgE data, and 132 were missing one or more specific IgEs. We further limited eligibility to 6917 persons with no missing values for any of the covariates used in our analysis.
Air Pollution Exposure Assignment
specified our analysis plan and the variables we required from the public NHANES data file. NCHS approved our proposal and created a data set with AQS and CMAQ data linked to the NHANES data file.
We used AQS monitored data for particulate matter with aerodynamic diameter ≤ 2.5 µm (PM2.5) and ≤ 10 µm (PM10), ozone (O3), and nitrogen dioxide (NO2) to assign exposure
estimates to participants within 20 miles of a monitor. We selected annual calendar year estimates for NO2, PM2.5 and PM10. Annual calendar year estimateswerethe only long term
exposure option for monitored data available in NCHS data files. For example, if a participant visited the MEC on June 1, 2005, then the participant received an estimate based on
concentrations averaged from 1 Jan 2005 – 31 Dec 2005.
O3 is monitored at different times throughout the year in different locations. Average
eight-hour daily maximum concentrations were calculated from 1 May through 30 September since O3 is monitored in most locations during this period.
For monitored pollutants, inverse distance-weighted estimates were calculated using the inverse of the squared distance between the participant residence and monitors within twenty miles of the residence. Since we included only participants within twenty miles of a monitor, the sample size differed by pollutant because the location of the monitors varied by pollutant based on regulatory requirements. Of the 6917 participants with a complete panel of allergen-specific IgE and covariates, the number of participants with monitored estimates was 4331 for NO2, 4492
for PM10, 5201 for O3, and 5298for PM2.5.
were available for PM2.5, O3 and NO2 but not for PM10. CMAQ is often used by state air
pollution control agencies to assess how proposed air quality management changes might impact air pollution concentrations (EPA 2010; EPAa 2010). CMAQ generates pollutant estimates by simulating the chemistry and physics of the atmosphere using air pollution emissions and meteorological data as inputs. CMAQ’s ability to estimate air pollution concentrations has been assessed in several performance evaluations by comparing modeled estimates to monitored concentrations (Appel K 2011; Foley KM 2010; Godowitch et al. 2010; Yu et al. 2006). CMAQ performance varies by season, pollutant, grid resolution and averaging time.
CMAQ output consisted of hourly surface concentrations for each day of calendar years 2004-2006 for the continental US at a resolution of 36x36 kilometers. Using CMAQ output, NCHS calculated averages for one year prior to the participant medical exam date. Participants received exams throughout the calendar year. By using CMAQ, we increased the number of participants with air pollution estimates in our study sample to 6227 for PM2.5, NO2 and O3.
Participants had missing air pollution concentration data because they did not live within twenty miles of a monitor, lived outside the domain of the model or they did not have sufficient address information for data linkage.
Allergic Sensitization
Survey participants ages six and older were tested for each of nineteen allergen-specific IgE antibodies using the Pharmacia Diagnostics ImmunoCAP 1000 System. The panel included IgE to fifteen aeroallergens (Alternaria alternata, Aspergillus fumigates, Bermuda grass, birch, cat dander, cockroach, dog dander, dust mite [Dermatophagoides farinae and
rye grass and four food allergens (egg white, cow’s milk, peanut and shrimp). The lower limit of detection was 0.35 kU/L for each specific IgE. For samples below the detection limit, NHANES reported values equal to the lower limit of detection divided by the square root of two. The upper limit of detection was 1000 kU/L. Samples that exceeded the upper limit of detection were assigned a value of 1000 kU/L (NCHS 2008).
Variable Definitions
Sensitization was defined as detectable specific IgE (≥0.35 kU/L). We investigated five allergic sensitization outcome variables (Salo et al. 2011). These included: 1) any of the IgE antibodies; 2) outdoor allergen-specific IgEs (Alternaria alternata, Aspergillus fumigatus, Bermuda grass, birch, oak, ragweed, Russian thistle, rye grass); 3) indoor allergen-specific IgEs [cat dander, cockroach, dog dander, dust mite (Dermatophagoides farinae and
Dermatophagoides pteronyssinus), mouse proteins, rat urine proteins]; 4) inhalant (indoor or
outdoor allergen-specific IgEs); and 5) food allergen-specific IgEs (egg white, cow’s milk, peanut, shrimp). These five outcomes are not mutually exclusive.
We considered several covariates in our analysis. We obtained data for age,
urbanization where a participant resided (NCHS 2006). The scheme consists of four metropolitan categories and two non-metropolitan categories. We recoded the six-category NCHS urban-rural variable into five categories to preserve participant confidentiality and eliminate small cell sizes by combining the small and medium metropolitan categories into one category (Table 1). We used poverty income ratio as a surrogate for socioeconomic status. Race/ethnicity was
categorized into non-Hispanic white, non-Hispanic black, Hispanic, and other. Statistical Analyses
We calculated descriptive statistics for NHANES participants both with and without air pollution estimates (Table 2). Descriptive statistics were generated using SAS version 9.2. We used NHANES analytic and reporting guidelines to select the appropriate sub-sample weights (wtmec2yr) and design variables for our analysis except for descriptive statistics of air pollutant concentrations since all participants received the medical exam (NCHS 2006a).
We calculated crude and adjusted prevalence odds ratios using the SUDAAN R Logistic procedure release 10.0.1 to account for the clustering and stratification in the sample design. We used logistic regression to produce separate odds ratios for 1) monitored air pollution
concentrations, 2) CMAQ estimates for participants with monitored and CMAQ estimates and 3) all participants with CMAQ estimates. Odds ratios are scaled per 10 parts per billion for NO2
and O3, per 10 µg/m3 for PM10 and per 5 µg/m3 for PM2.5. We chose scaling factors to have
included poverty income ratio as a continuous variable and gender, race/ethnicity, age, cotinine and level of urbanization as categorical variables. We also adjusted for region, and indoor air exposures of mold, housing type, and pets; they made no difference in effect estimates, so they were not included in the final models. We conducted interaction testing for age and gender using p value < 0.10 as a criterion for positive interaction.
Results
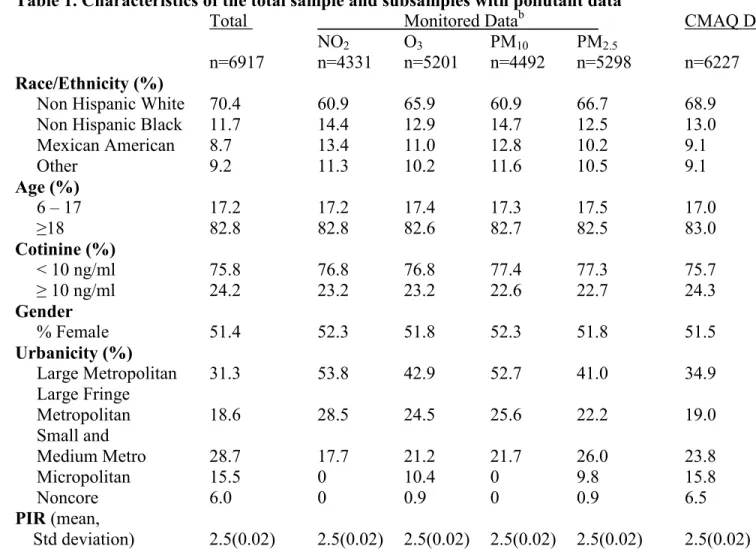
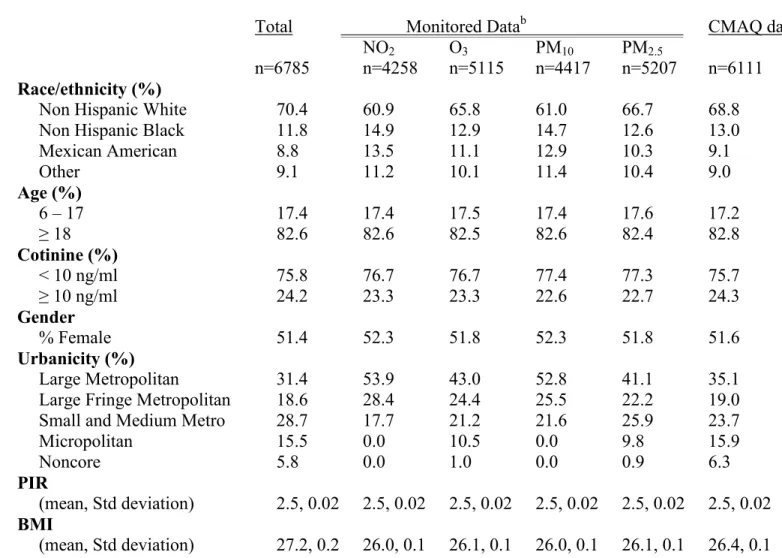
The total study sample (n=6917) was more white and less urban than the sub-samples created from linking AQS air pollution estimates to NHANES participants (Table 1). As expected, given that CMAQ data are available for subjects living in rural areas far from
monitors, the subsample created from linking CMAQ estimates was more similar to the overall sample than the subsamples created from linking monitored data, thus more representative of the overall US population.
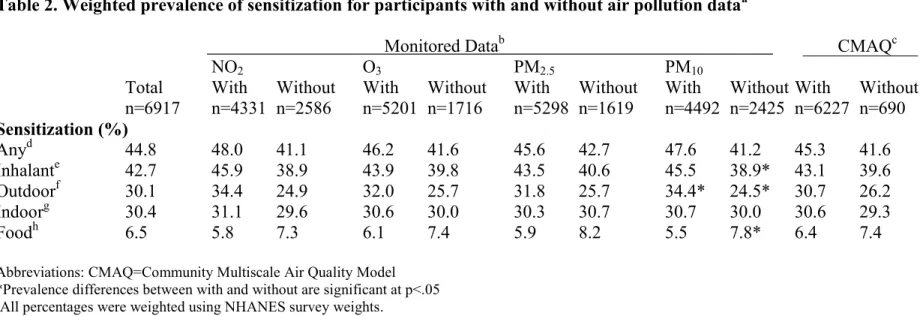
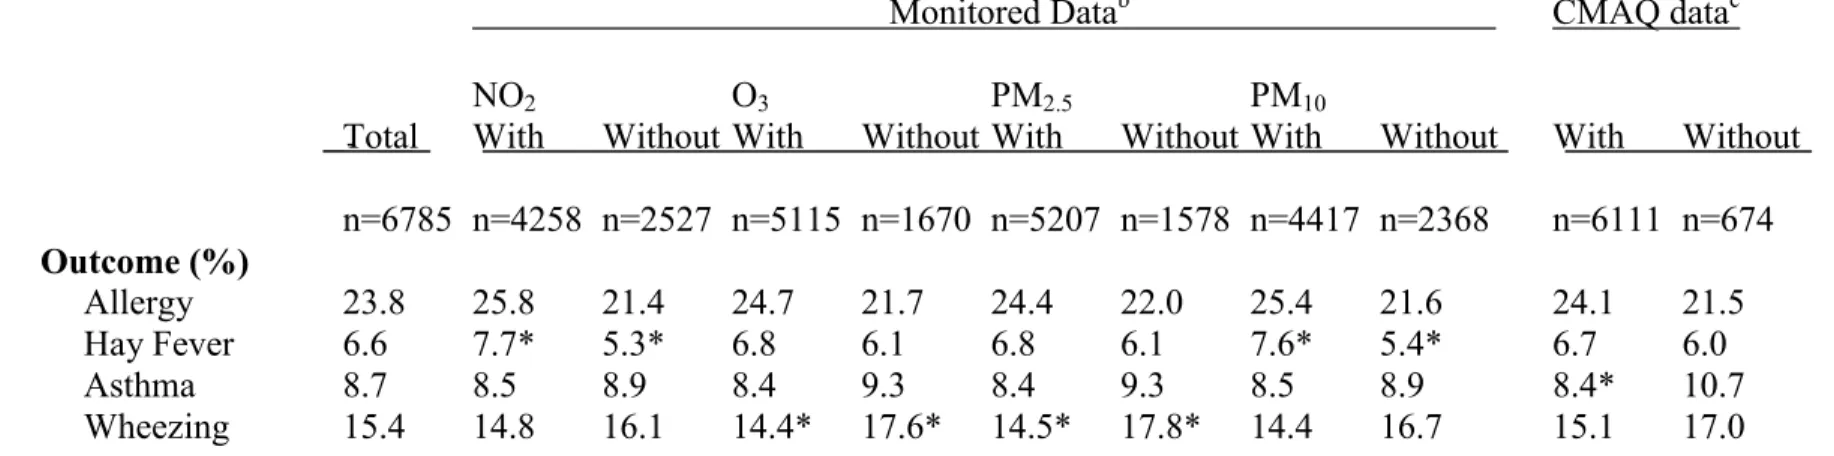
Table 2 shows the frequency of sensitization among the total sample and the sub-samples. With the exception of food allergen sensitization, the percentage of sensitization was lower in the subset of participants without linked air pollution estimates compared with the subsample of participants with air pollution estimates. Most of the participants without air pollution estimates live in rural areas. In our sample, the percentage of sensitization is lower in rural areas compared to urban areas (weighted prevalence of sensitization to any allergen = 39.7% for rural subjects and 46.2% for urban subjects, p=.002). Sensitization was also lower for all subtypes of allergens except food allergens for rural versus urban subjects (data not shown).
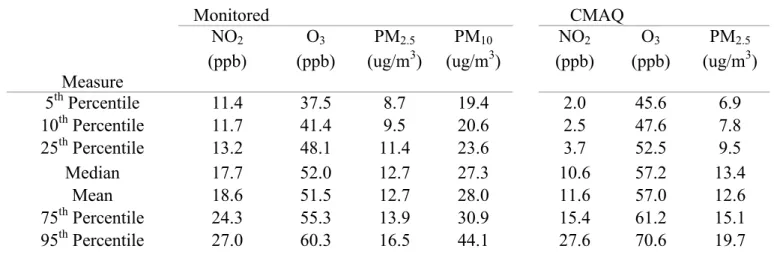
prior to the participant medical exam date were higher than the inverse distance weighted
monitored calendar year estimates on average. Model estimates for NO2 were lower than inverse
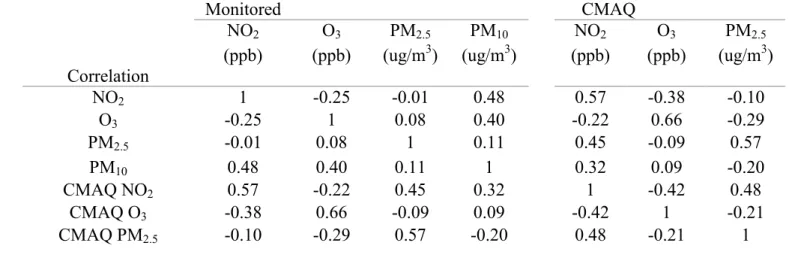
distance weighted monitored estimates. NO2 and PM10 were most strongly correlated (r=0.48)
among monitored pollutants. In contrast, NO2 was most strongly correlated with PM2.5 (r=0.60)
among modeled pollutants.
Table 5 displays adjusted prevalence odds ratios and 95% confidence intervals for each air pollutant in relation to each category of allergen-specific IgE based on the following: 1) monitored data, 2) CMAQ data among participants with monitored data and CMAQ data, and 3) the larger sample of all participants with CMAQ estimates. A similar table including crude and adjusted odds ratios is provided as supplemental material (Table A1). The largest percent change in crude odds ratios with adjustment for potential confounders was from the addition of
urbanicity and ethnicity.
The results were similar among the three analyses, but a greater number of significant associations were detected using modeled estimates than monitored estimates which might reflect the larger sample size for this analysis. The most frequent associations were observed for NO2 with most adjusted odds ratios near 1.2. After adjustment for confounders, the only
significant association identified using modeled data that was not identified using monitored data was for NO2 in relation to indoor allergen-specific IgE. Similar effect estimates from CMAQ
interaction P values are provided as supplemental material (Table A15). For gender, the relationship between PM2.5 and outdoor air pollution was the only relationship with an
interaction p value < 0.10. Discussion
We found associations between increased NO2 and PM2.5 concentrations and allergic
sensitization in the US population. NO2 exposure was significantly associated with three allergic
sensitization categories using CMAQ data. Overall, we found similar results using monitored data but with fewer statistically significant results in this smaller subset of the data. PM2.5 was
consistently associated with sensitization to indoor allergens. This is the first population-based study of air pollution and allergic sensitization that used a nationally representative sample of the US population.
Most previous studies that have identified associations between ambient air pollution and allergic sensitization were studies of traffic-related air pollution in Europe. In contrast, our study was not designed to specifically assess traffic-related air pollution since our exposure metrics do not differentiate near roadway exposures. Additionally, our sample contains both children and adults, whereas most other studies have assessed either children or adults.
Our findings are plausible based on several recent mechanistic studies in mice that provide support for NO2 exposure as a contributor to the development of allergic sensitization.
Ckless et al. (2011) provided evidence that NO2 contributes to allergic sensitization as an
Consistent with several recent studies, our most frequent associations involve NO2. In a
Swedish birth cohort, Nordling et al. (2008) found an association between traffic-related NO2
and sensitization to pollens (aOR =1.67 95% CI 1.10, 2.53 per 44 µg/m3, n=2543) at age 4 years. Similarly, Kramer et al. (2000) identified an association (aOR=4.96 95% CI 1.56, 15.74 per 10 µg/m3) between ambient NO2 and sensitization to pollens for children nine years of age residing
in urban areas. This cross-sectional study of 317 German children lost significance (aOR=1.05 95% CI 0.70, 1.56) when urban and suburban children were analyzed together. In addition, a cross-sectional study by Janssen et al. (2003) also found a positive association between NO2 and
sensitization to inhalant allergens (aOR=1.70 95% CI 1.03, 2.81 per 17.6 µg/m3) among 1114 Dutch children 7-12 years of age. Overall our effect estimates are generally smaller than reported in these studies. This may be in part because our exposure assessment approach could not resolve within city exposure contrasts or near roadway exposures. Possible reasons for the differences in association are that our sample included children and adults, was larger than the samples of the studies that reported positive associations and used a different scaling factor. Also, the allergens included in the definition of sensitization are not consistent across studies. In contrast to our findings, several epidemiologic studies did not find positive associations between NO2 and
sensitization to inhalant allergens. Three of these were birth cohort studies (Brauer et al. 2007; Gehring et al. 2010; Gruzieva et al. 2012) while six were cross-sectional studies (Annesi-Maesano et al. 2007; Charpin et al. 1999; Hirsch et al. 1999; Kramer et al. 2009; Oftedal et al. 2007; Rosenlund et al. 2009).
assess allergic sensitization, as well as differences in ambient pollutant levels that may all contribute to variation in the associations observed (Bousquet et al. 2010; Cox et al. 2008). The combination of these factors makes comparisons difficult. For studies where an association was detected, no one pollutant appeared to be most frequently associated with allergic sensitization. This observation raises a question regarding whether our findings for NO2 represents a pollutant
specific finding or if NO2 is a surrogate for traffic-related pollutants.
Two previous studies reported positive associations between PM2.5 and allergic
sensitization. A cohort study by Morgenstern et al. (2008) found an association between PM2.5
and sensitization to inhalant allergens (aOR=1.45 95% CI 1.21, 1.74 per 1.5 µg/m3) but was largely driven by sensitization to outdoor allergens. A cross-sectional study by Annesi-Maesano (2007) found a positive association between PM2.5 and sensitization to indoor allergens
(aOR=1.29 95% CI 1.11, 1.50 for high versus low pollutant exposure. Low pollutant exposure ranged from 1.6-12.2 µg/m3. Our finding of an association of PM2.5 with IgE of indoor allergens
(aOR=1.24 95% CI 1.13, 1.36 per 5 µg/m3) was similar in magnitude to the study Annesi-Maesano (2007). Our findings were driven largely by dust mite (data not shown), which is the most common antigen to which subjects in this category are sensitized (Gergen et al. 2009). Other studies identified included four studies that were not consistent with our results for PM2.5:
two birth cohort studies (Brauer et al. 2007; Gehring et al. 2010) and two cross-sectional studies (Bedada et al. 2007; Janssen et al. 2003).
mixtures and allergen species. In addition, the study is relatively large and the assessment of sensitization is comprehensive, based on nineteen specific allergen IgEs. We also included data on a number of potential confounders, including cotinine to objectively assess smoking and exposure to environmental tobacco smoke.
Another important strength of the current analysis is that we used an air quality model as an alternate method of assigning air pollution exposures to increase inclusion of participants living outside of major metropolitan areas. We found consistent associations using both
monitored and modeled air pollution estimates. To our knowledge, this is the first time that both monitoring and air quality modeling exposure assignment methods have been used in an
epidemiologic study to assess the US population. Using an air quality model provides air pollution estimates that capture the nonlinear atmospheric chemistry and physics of the atmosphere that linear interpolation methods cannot (EPA 2010). Finally, the general concordance of the results using both exposure assignment approaches adds strength to the validity of our findings.
pollutant estimates for rural participants. Although we increased the number of rural participants CMAQ has limitations inherent to simulating air pollution concentrations. Meteorological data, emissions data, and the chemical and physical processes that CMAQ is simulating all introduce uncertainty into estimates of air pollution concentration (EPA 2010).
Both of our exposure metrics are relatively coarse. We limited our investigation to participants within twenty miles of a monitor and used a 36 kilometer grid to generate modeled estimates of ambient concentration. Because NHANES is a national sample, we were primarily concerned with exposure contrasts between areas and not within an area. Despite our exposure assignment approach being limited by not being able to capture within area exposure contrasts, we still detected positive associations between air pollution and allergic sensitization. Since our study was aimed at looking at differences between areas, and not within an area, we believe that our estimates of air pollution concentration are suitable for estimating associations under these conditions. Two key factors in how well ambient monitors estimate personal exposure are how close participants are to monitors and how homogeneous the pollutant concentrations are in space. The degree of pollutant spatial homogeneity varies across the study areas selected by NHANES based on the inventory of sources, topography, type of pollutant, atmospheric conditions, locations of monitors relative to study participants, model performance, and size of the area (Sarnat et al. 2007). Ambient concentrations of O3 and PM2.5 are relatively
homogeneous over short distances compared to NO2. NO2 concentrations vary more over short
these same exposures, we may miss areas of highest concentration within an urban area that may have attenuated our effect estimates.
We chose to base our estimate of monitored pollutant levels on monitors within twenty miles, based on the work of Parker et al. (2008) who linked air pollution estimates for NHIS participants based on an average of one) all monitors within the county, 2) monitors within a five mile radius of the participant census block group, and 3) monitors within twenty miles of the participant census block group. Parker et al. (2008) suggested that these methods gave similar association results but have tradeoffs. Linking air pollution estimates to national survey data sets with finer spatial resolution reduces measurement error but also reduces sample size. On the other hand, using air pollution estimates with coarser spatial resolution increases the likelihood of measurement error, increases sample size and reduces the potential for selection bias.
While both the modeled and monitoring approaches to assessment of exposure in this study have limitations, we believe any bias should be non-differential since neither the quality of monitored estimates nor CMAQ estimates should be related to a participant’s allergic
sensitization status. Thus we expect that our effect estimates are more likely biased toward the null than away from the null for both monitored and CMAQ generated air pollution data.
Our study suggests that ambient air pollution is associated with allergic sensitization. Our main finding of an association with NO2 and allergic sensitization is seen for both monitored and
modeled data and across several categories of allergen-specific IgE. Our study is the first to assess the relationship between air pollution and allergic sensitization in a nationally
Table 1. Characteristics of the total sample and subsamples with pollutant dataa
Total Monitored Datab CMAQ Datac NO2 O3 PM10 PM2.5
n=6917 n=4331 n=5201 n=4492 n=5298 n=6227 Race/Ethnicity (%)
Non Hispanic White 70.4 60.9 65.9 60.9 66.7 68.9 Non Hispanic Black 11.7 14.4 12.9 14.7 12.5 13.0 Mexican American 8.7 13.4 11.0 12.8 10.2 9.1 Other 9.2 11.3 10.2 11.6 10.5 9.1 Age (%)
6 – 17 17.2 17.2 17.4 17.3 17.5 17.0 ≥18 82.8 82.8 82.6 82.7 82.5 83.0 Cotinine (%)
< 10 ng/ml 75.8 76.8 76.8 77.4 77.3 75.7 ≥ 10 ng/ml 24.2 23.2 23.2 22.6 22.7 24.3 Gender
% Female 51.4 52.3 51.8 52.3 51.8 51.5 Urbanicity (%)
Large Metropolitan 31.3 53.8 42.9 52.7 41.0 34.9 Large Fringe
Metropolitan 18.6 28.5 24.5 25.6 22.2 19.0 Small and
Medium Metro 28.7 17.7 21.2 21.7 26.0 23.8 Micropolitan 15.5 0 10.4 0 9.8 15.8 Noncore 6.0 0 0.9 0 0.9 6.5 PIR (mean,
Std deviation) 2.5(0.02) 2.5(0.02) 2.5(0.02) 2.5(0.02) 2.5(0.02) 2.5(0.02)
Abbreviation: PIR=poverty income ratio, CMAQ=Community Multiscale Air Quality Model aAll percentages were weighted using NHANES survey
weights.
bSubsamples for monitored NO
2, O3, PM2.5, and PM10 linked to NHANES participants. cSubsamples for monitored NO2, O3, PM2.5, and PM10 from the
CMAQ model linked to NHANES participants.
37
T
ab
Table 2. Weighted prevalence of sensitization for participants with and without air pollution dataa
Monitored Datab CMAQc NO2 O3 PM2.5 PM10
Total With Without With Without With Without With Without With Without n=6917 n=4331 n=2586 n=5201 n=1716 n=5298 n=1619 n=4492 n=2425 n=6227 n=690 Sensitization (%)
Anyd 44.8 48.0 41.1 46.2 41.6 45.6 42.7 47.6 41.2 45.3 41.6 Inhalante 42.7 45.9 38.9 43.9 39.8 43.5 40.6 45.5 38.9* 43.1 39.6 Outdoorf 30.1 34.4 24.9 32.0 25.7 31.8 25.7 34.4* 24.5* 30.7 26.2 Indoorg 30.4 31.1 29.6 30.6 30.0 30.3 30.7 30.7 30.0 30.6 29.3 Foodh 6.5 5.8 7.3 6.1 7.4 5.9 8.2 5.5 7.8* 6.4 7.4 Abbreviations: CMAQ=Community Multiscale Air Quality Model
*Prevalence differences between with and without are significant at p<.05
aAll percentages were weighted using NHANES survey weights.
bSubsamples for monitored PM
2.5, O3, NO2, and PM10 linked to NHANES participants.
c Subsamples for PM
2.5, O3, and NO2 linked to NHANES participants based on CMAQ data.
dAny=Detectable specific IgE to indoor, outdoor, or food allergens.
eInhalant= Detectable specific IgE to indoor or outdoor allergens.
fOutdoor= Detectable specific IgE to Alternaria alternata, Asperigillus fumigatus, Bermuda grass, birch, oak, ragweed, Russian thistle, or rye grass/
gIndoor= Detectable specific IgE to cat dander, cockroach, dog dander, dust mite (Dermataphagoides farinae and Dermatophagoides pteronyssinus),
mouse proteins, rat urine proteins.
hFood= Detectable specific IgE to egg white, milk, peanut or shrimp.
Table 3. Monitored and CMAQ Pollutant Concentrations
Monitored CMAQ
NO2 O3 PM2.5 PM10 NO2 O3 PM2.5
Measure
(ppb) (ppb) (ug/m3) (ug/m3) (ppb) (ppb) (ug/m3)
5th Percentile 11.4 37.5 8.7 19.4 2.0 45.6 6.9
10th Percentile 11.7 40.4 9.5 20.6 2.5 47.6 7.8
25th Percentile 13.2 48.1 11.4 23.6 3.7 52.5 9.5
Median 17.6 52.0 12.7 27.1 10.6 57.0 13.4
Mean 18.6 51.5 12.7 28 11.6 57.2 12.6
75th Percentile 24.3 55.3 13.9 30.9 15.3 61.2 15.1 95th Percentile 27.0 60.3 16.5 44.1 27.6 70.8 19.7
CMAQ PM10 air pollution concentrations were not available in our data set
Abbreviations: CMAQ=Community Multiscale Air Quality Model
Table 4. Pearson Correlations of Monitored and CMAQ Pollutant Concentrations
Monitored CMAQ
NO2 O3 PM2.5 PM10 NO2 O3 PM2.5
Correlation
(ppb) (ppb) (ug/m3) (ug/m3) (ppb) (ppb) (ug/m3)
NO2 1 -0.25 -0.01 0.48 0.57 -0.38 -0.10
O3 -0.25 1 0.08 0.40 -0.22 0.66 -0.29
PM2.5 -0.01 0.08 1 0.11 0.45 -0.09 0.57
PM10 0.48 0.40 0.11 1 0.32 0.09 -0.20
CMAQ NO2 0.57 -0.22 0.45 0.32 1 -0.42 0.48
CMAQ O3 -0.38 0.66 -0.09 0.09 -0.42 1 -0.21
CMAQ PM2.5 -0.10 -0.29 0.57 -0.20 0.48 -0.21 1
Abbreviations: CMAQ=Community Multiscale Air Quality Model
Table 5. Adjusted odds ratios and 95% Cls between air pollution concentrations and allergen-specific IgE for ages ≥ 6a,b Results Based CMAQ Results for Results for all
on Monitored Data Subjects with Monitored Data Subjects with CMAQ Data Sensitization
Pollutant n aOR (95% CI) n aOR (95% CI) n aOR (95% CI) Anyc
NO2 4331 1.24 (1.07, 1.44) 4331 1.13 (1.02, 1.26) 6277 1.15 (1.04, 1.27)
O3 5201 1.07 (0.94, 1.21) 5151 1.09 (0.91, 1.31) 6277 1.10 (0.93, 1.29)
PM2.5 5298 1.13 (0.94, 1.36) 5208 1.02 (0.90, 1.17) 6277 1.04 (0.93, 1.17)
PM10 4492 1.08 (0.95, 1.25)
Inhalantd
NO2 4331 1.23 (1.04, 1.46) 4331 1.15 (0.99, 1.34) 6277 1.17 (1.02, 1.33)
O3 5201 1.06 (0.93, 1.20) 5151 1.09 (0.90, 1.32) 6277 1.11 (0.93, 1.32)
PM2.5 5298 1.11 (0.93, 1.32) 5208 1.05 (0.88, 1.24) 6277 1.07 (0.93, 1.24)
PM10 4492 1.07 (0.93, 1.23)
Outdoore
NO2 4331 1.24 (1.00, 1.55) 4331 1.03 (0.83, 1.29) 6277 1.10 (0.89, 1.35)
O3 5201 1.17 (0.99, 1.38) 5151 1.12 (0.88, 1.42) 6277 1.14 (0.90, 1.43)
PM2.5 5298 0.84 (0.62, 1.15) 5208 0.88 (0.68, 1.13) 6277 0.93 (0.74, 1.17)
PM10 4492 1.18 (0.98, 1.42)
Indoorf
NO2 4331 1.14 (0.97, 1.35) 4331 1.20 (1.09, 1.33) 6277 1.16 (1.03, 1.31)
O3 5201 0.91 (0.78, 1.06) 5151 1.03 (0.86, 1.23) 6277 1.02 (0.86, 1.22)
PM2.5 5298 1.27 (1.12, 1.45) 5208 1.26 (1.16, 1.38) 6277 1.24 (1.13, 1.36)
PM10 4492 0.93 (0.85, 1.03)