ESTIMATING ORAL ANTICOAGULANT COMPARATIVE EFFECTIVENESS IN THE SETTING OF EFFECT HETEROGENEITY: COMPARING CLINICAL TRIAL TRANSPORT AND NON-EXPERIMENTAL EPIDEMIOLOGIC
METHODS
Michael Webster-Clark
A dissertation submitted to the faculty at the University of North Carolina at Chapel Hill in partial fulfillment of the requirements for the degree of Doctor of Philosophy in the Department of
Epidemiology in the Gillings School of Global Public Health.
Chapel Hill 2019
ii © 2019
iii
ABSTRACT
Michael Webster-Clark: Estimating Oral Anticoagulant Comparative Effectiveness in the Setting of Effect Heterogeneity: Comparing Clinical Trial Transport and Non-experimental Epidemiologic Methods
(Under the direction of Jennifer Lund)
Oral anticoagulation is vital to the health of patients with atrial fibrillation at elevated risk of stroke. The first treatment for these patients, warfarin, was approved in the 1990s. Since 2010, dabigatran has been available for use after demonstrating non-inferiority to warfarin in a randomized controlled trial. Non-experimental studies comparing dabigatran to warfarin and censoring at treatment discontinuation have shown greater benefits than the original trial for all-cause mortality and
attenuated harms for gastrointestinal bleeding.
The goals of this dissertation, then, were to compute and compare 1) estimates of the absolute-scale effects of dabigatran vs warfarin initiation on ischemic stroke (IS), death, and gastrointestinal bleeding (GIB) in trial-eligible older adults using non-experimental Medicare data and 2) estimates of those effects in the same populations using inverse odds of sampling weights to transport results from the Randomized Evaluation of Long-Term Anticoagulation (RE-LY) trial.
First, we conducted a propensity score weighted non-experimental study with the new user active comparator design in a 20% random sample of Medicare beneficiares. We estimated ontreatment twoyear risk differences for IS (RD for dabigatran users, RDdabi: 0.67%, 95% CI 1.10%, -0.24%), mortality (RDdabi: -2.98%, 95% CI -3.97%, -1.95%) and GIB (RDdabi: 0.51%, 95% CI -0.30%, 1.31%). Intention-to-treat estimates showed attenuation for mortality (RDdabi: -1.65%, 95% CI -2.32%, -0.98%) and reversal for IS (RDdabi: 0.16%, 95% CI -0.20%, 0.52%).
iv
ontreatment twoyear risk differences for IS (RDdabi: 0.77%, 95% CI 1.69%, 0.14%), death (RDdabi: -0.57%, 95% CI -1.83%, 0.68%) and GIB (RDdabi: 1.75%, 95% CI 0.76%, 2.74%).
v
vi
ACKNOWLEDGEMENTS
I would like to acknowledge the efforts of everyone on my dissertation committee for
vii
TABLE OF CONTENTS
LIST OF TABLES xi
LIST OF FIGURES xiii
LIST OF ABBREVIATIONS xv
CHAPTER 1: SPECIFIC AIMS 1
CHAPTER 2: BACKGROUND AND SIGNIFICANCE 3
2.1: Atrial Fibrillation 3
2.1.1: Pathophysiology 3
2.1.2: Population burden 5
2.2: Pharmacologic Treatment Options 7
2.2.1: Warfarin 7
2.2.2: Novel Oral Anticoagulants 8
2.2.2.1: Dabigatran 9
2.2.2.2: Other NOACs 10
2.3: Existing Evidence on Dabigatran Safety and Efficacy 11
2.3.1: Randomized Controlled Trials 11
2.3.1.1: RE-LY Trial 11
2.3.1.2: Heterogeneity in the RE-LY trial 12
2.3.1.3: Other Trials of Dabigatran vs. Warfarin 13
2.3.2: Non-experimental Studies 15
viii
2.4.1: Demographic Characteristic Heterogeneity 23
2.4.2: Warfarin Management Heterogeneity 24
2.4.3: Medication Adherence and Persistence Heterogeneity 25
2.5: Methods for Transporting Causal Effects 27
2.5.1: Standardization Methods 27
2.5.2: Weighting Methods 28
2.6: Methods for Assessing Transportability 30
2.6.1: Comparing Marginal Variable Distributions 30
2.6.2: Assessing Proportion of Patients Eligible for Trials 31
2.6.3: Weighting Methods for Assessing Transportability 32
2.7: Public Health Significance 35
CHAPTER 3: RESEARCH PLAN AND METHODS 36
3.1: Overview 36
3.2: Data Sources and Collection 37
3.2.1: RE-LY Population 37
3.2.1.1: RE-LY Population Description 37
3.2.1.2: Outcome Assessment in RE-LY 38
3.2.1.3: Exposure Assessment in RE-LY 39
3.2.1.4: Covariate Assessment in RE-LY 40
3.2.2: Medicare Atrial Fibrillation Population 43
3.2.2.1: Medicare Atrial Fibrillation Population Description 43
3.2.2.2: Outcome Assessment in Medicare 45
3.2.2.3: Exposure Assessment in Medicare 46
ix
3.2.3: Data Combination 49
3.3: Data Analysis 51
3.3.1: Aim 1, Estimating Non-experimental Treatment Effects in Medicare 51 3.3.1.1: Aim 1.1, New User Active Comparator Design 51 3.3.2: Aim 2, Transporting Treatment Effects with Inverse Odds of Sampling Weights 53
3.3.2.1: Aim 2.1, Assessing Transportability 53
3.3.2.2: Aim 2.2, Transporting Treatment Effects 56
3.3.2.3: Aim 2.3, Contrasting Effect Estimates 57
3.4. Human Subjects 59
CHAPTER 4: STAYING ON TREATMENT MATTERS: ESTIMATING EFFECTS OF
DABIGATRAN VERSUS WARFARIN IN MEDICARE 60
4.1. Introduction 60
4.2. Methods 62
4.2.1. Study Population 62
4.2.2. Exposure 62
4.2.3. Outcomes 63
4.2.4. Covariates 64
4.2.5. Statistical Analyses 64
4.2.6. Sensitivity Analyses 65
4.3. Results 66
4.4. Discussion 69
CHAPTER 5: REWEIGHTING ORANGES TO APPLES: COMPARING TRANSPORTED
RE-LY TRIAL AND NON-EXPERIMENTAL ESTIMATES IN ATRIAL FIBRILLATION 85
5.1. Introduction 85
x
5.2.1. Parameters of Interest 88
5.2.2. Study Populations 88
5.2.3. Exposure 90
5.2.4. Outcomes 91
5.2.5. Covariates 91
5.2.6. Statistical Analyses 93
5.2.7. Sensitivity Analyses 95
5.3. Results 96
5.4. Discussion 100
CHAPTER 6: CONCLUSIONS 122
6.1. Main Findings 122
6.2. Significance 125
6.3. Future Directions 126
APPENDIX A: OUTCOME CODING 128
APPENDIX B: ELIGIBILITY CRITERIA AND COVARIATES 132
APPENDIX C: PROCEDURE CODES FOR ANTICOAGULATION MANAGEMENT 136
xi
LIST OF TABLES
Table 1: Published studies comparing warfarin vs. dabigatran 22
Table 2: Aim 2 cohort summary 75
Table 3: Person-years, events, and risks in Aim 1 analyses 77
Table 4: Risk ratios and risk differences in Aim 1 main outcome analyses 81
Table 5: Risk ratios and risk differences in Aim 1 secondary outcome analyses 82
Table 6: Two-year risks of outcomes across sensitivity analyses 83
Table 7: Two-year risk differences for outcomes across sensitivity analyses 84
Table 8: Trial and main target population covariate distributions 104
Table 9: Trial and unrestricted target population covariate distributions 104
Table 10: Results from analyses in trial patients over 65 106
Table 11: Sampling model covariate distributions (main target population) 107
Table 12: Sampling model covariate distributions (secondary target population) 107
Table 13: Main outcome person-years and events after weights 114
Table 14: Other outcome person-years and events after weights 115
Table 15: Person-years and events after secondary target population weights 116
Table 16: SMR-weighted non-experimental risk differences in the target populations 117
Table 17: Transportability assessment results for the main target populations 120
xii
Table 19: Risk differences when transporting to sensitivity analysis target populations 121
xiii
LIST OF FIGURES
Figure 1: The heart and atrial fibrillation 3
Figure 2: Atrial fibrillation trends over time 5
Figure 3: Warfarin as rat poison 7
Figure 4: Dabigatran packaging 9
Figure 5: Subgroup results from the RE-LY trial 12
Figure 6: Inverse probability of sampling weights visual representation 28
Figure 7: Survival curves as used in transportability assessment 32
Figure 8: Causal diagram examining sampling and ischemic stroke 40
Figure 9: Causal diagram examining sampling and gastrointestinal bleeding 41
Figure 10: Exposure identification and follow-up 46
Figure 11: Causal diagram examining treatment and outcomes 47
Figure 12: Data flow diagram for the combination of each population’s data 49
Figure 13: Aim 1 conceptual diagram 51
Figure 14: Aim 2 conceptual diagram 53
Figure 15: Example transportability assessment cumulative incidence curves 53
Figure 16: Aim 1 cohort flow diagram 74
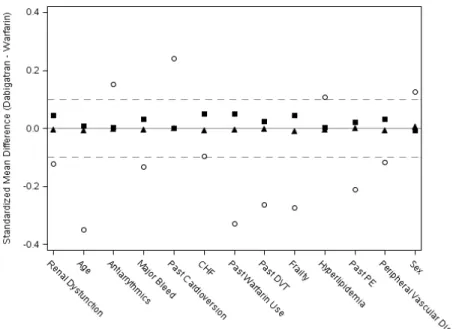
Figure 17: Aim 1 cohort standardized mean differences 76
xiv
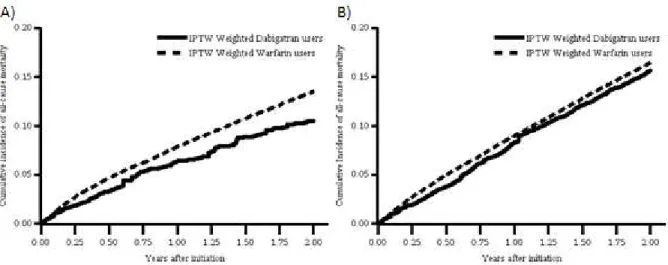
Figure 19: IPTW all-cause mortality cumulative incidence curves 78
Figure 20: IPTW gastrointestinal bleeding cumulative incidence curves 79
Figure 21: IPTW all stroke cumulative incidence curves 79
Figure 22: IPTW major bleeding cumulative incidence curves 80
Figure 23: Aim 2 cohort flow diagram 103
Figure 24: Aim 2 cohort standardized mean differences (trial vs target) 105
Figure 25: Ischemic stroke cumulative incidence curves 108
Figure 26: Ischemic stroke cumulative incidence curves (unrestricted targets) 109
Figure 27: All-cause mortality cumulative incidence curves 110
Figure 28: Gastrointestinal bleeding cumulative incidence curves 111
Figure 29: All stroke cumulative incidence curves 112
Figure 30: Major bleeding cumulative incidence curves 113
Figure 31: Constrasting treatment effects: main target populations 118
xv
LIST OF ABBREVIATIONS
AF Atrial fibrillation
CHADS2 Stroke risk score based upon Congestive heart failure, Hypertension, Age, Diabetes, and past stroke
C.I. Confidence interval
CSDR Clinical Study Data Request
CTDT Clinical Trial Data Transparency (platform)
EMM Effect measure modification or effect measure modifier
HR Hazard ratio
NOAC Novel oral anticoagulant
RCT Randomized controlled trial
RD Risk difference
RR Risk ratio
sIOSW Stabilized inverse odds of sampling weights
sIPCW Stabilized inverse probability of censoring weights
1
CHAPTER 1: SPECIFIC AIMS
Atrial fibrillation affects 33 million adults worldwide.1 Even if individuals with atrial fibrillation are asymptomatic, stroke incidence in the atrial fibrillation population is much higher and resulting strokes are more frequently associated with death, hospitalization, and long-term disability than strokes in adults without atrial fibrillation.2,3 Warfarin, the standard treatment for preventing strokes in atrial fibrillation, is difficult to manage therapeutically due to its lengthy half-life and narrow therapeutic range. Warfarin overdose can also result in catastrophic bleeding events.4 Novel oral anticoagulants have been shown to be non-inferior to warfarin administered with systematic management protocols in clinical trial populations.5 One of the first novel anticoagulants to be approved in the United States, dabigatran, was shown to be more effective than warfarin at stroke and embolic event prevention (HR 0.66, 95% C.I. 0.53-0.82) with no increase in bleeding (HR 0.93, 95% C.I. 1.07) in the RE-LY trial.6
However, estimates of efficacy in these clinical trials are not estimates of effectiveness in clinical care.7,8 Patients selected into trials tend to be young with fewer comorbidities than the general
2
The overarching goal of this dissertation is to estimate treatment effects in various Medicare populations of older adults, juxtaposing the estimates obtained from relatively novel methods for transporting treatment effects from a trial with estimates obtained using more standard propensity score weighting in those older adults.
Specifically, I will:
Specific Aim 1: Estimate the effect of dabigatran versus warfarin initiation on two-year risks of ischemic stroke, death, and gastrointestinal bleeding in Medicare beneficiaries with atrial fibrillation using non-experimental data and propensity score methods.
1.1: Estimate absolute effects of dabigatran versus warfarin on two-year risks of ischemic stroke, death, and gastrointestinal bleeding in warfarin and dabigatran new users with a new user active comparator design under both intention-to-treat and as-treated follow-up.
Specific Aim 2: Estimate the effect of dabigatran versus warfarin initiation on the two-year risk of ischemic stroke, death, and gastrointestinal bleeding among Medicare beneficiaries with atrial fibrillation using transportability methods reweighting the RE-LY trial data.
2.1: Compare risks of each outcome between the RE-LY and Medicare cohorts on each treatment before and after using inverse odds of sampling weights to standardize RE-LY to Medicare with respect to effect measure modifiers (EMM).
2.2: Estimate the absolute effect of dabigatran versus warfarin on two-year risks of ischemic stroke, death, and gastrointestinal bleeding using inverse odds of sampling weights to standardize the RE-LY trial to the Medicare cohort in effect measure modifiers.
3
CHAPTER 2: BACKGROUND AND SIGNIFICANCE
2.1: Atrial Fibrillation
2.1.1: Pathophysiology
Atrial fibrillation (AF) is a type of sustained disorder of cardiac rhythm in which the upper chambers of the heart beat irregularly due to abnormal impulse formation for any reason (see Figure 1).22 AF is typically divided into valvular and non-valvular categories based upon the etiology of the rhythm disorder, with valvular diseases tracing back to rheumatic diseases of the mitral
valve or valve replacement.23 In both types of AF the atria’s chaotic beat overwhelms the
atrioventricular node until it is unable to create consistent ventricular contractions, creating irregular time intervals between heartbeats. This leads to the symptoms of AF including heart palpitations, lightheadedness, fatigue, shortness of breath, and chest pain, though these symptoms do not occur in everyone with an irregular heartbeat.22 Symptomatic episodes may be brought on by a
4
variety of stimuli, including caffeine, stress, poor sleep, and (for some individuals) exercise, but the chronic disease persists regardless. The best ways to relieve symptoms are the use of medications or procedures for rate or rhythm control, but neither of these strategies have substantive morbidity or mortality benefits.24
5
2.1.2: Population burden
6
7
2.2: Pharmacologic Treatment Options for Anticoagulation
2.2.1: Warfarin
Warfarin (also known as coumadin or coumarin) has been the treatment of choice for oral anticoagulation in patients with AF at high risk for stroke for more than 50 years.22 Initially used as a rat poison, potential health benefits as an anticoagulant were identified at the University of Wisconsin.36 Warfarin prevents the synthesis of several key vitamin K dependent clotting factors in the liver. This leads to reduced thrombolysis, stroke, and death. Unfortunately,
warfarin features both a narrow therapeutic range and an extremely long and variable half-life between 20 and 60 hours.37 As a result, medical providers need to carefully titrate and monitor the dosing of individuals on warfarin to ensure their international normalized ratio for clotting (INR) stays within the therapeutic range (generally between 2 and 3 for non-valvular AF patients and slightly higher for patients with prosthetic heart valves) to prevent excessive bleeding events.37 These INRs are an estimate of the time it takes blood to clot and are typically taken at least weekly while doses are being initially adjusted. Even when a patient is stable with a consistent warfarin dose, guidelines recommend patients are monitored monthly (though extremely consistent and reliable patients may be suitable for monitoring every two months).22
Further complicating matters, due to warfarin’s metabolism by multiple cytochrome P 450 (CYP) enzymatic pathways and mechanisms of action, serum concentrations of warfarin can be substantially altered by antibiotics, herbal remedies, and even the amount of green vegetables in an individual’s diet.38 This creates a panoply of interactions that can quickly result in subtherapeutic or
supratherapeutic INRs unless dosing is carefully monitored, even when warfarin is being taken as directed. While antidotes to warfarin-induced bleeding are straightforward due to the low cost and ease Figure 3: Warfarin as it was
8
of administering a vitamin K infusion, long-term damage from bleeding events can be severe and the hospitalizations still have a mean cost of $10,819.39 While many attempts have been made to identify optimal methods for initiating patients on warfarin using both randomized trials and observational data, including attempts to leverage pharmacogenomics, 40-42 the science of warfarin dosing remains
challenging. Still, anticoagulation with warfarin is the definitive benchmark for thromboprophylactic AF treatment and all alternative medications must be able to demonstrate non-inferiority in safety and efficacy relative to warfarin to obtain regulatory agency approval in both the United States and internationally.
2.2.2: Novel Oral Anticoagulants (NOACs)
Due to advances in biological understanding and chemical engineering, the 21st century saw the advent of additional oral anticoagulant options.36 Instead of targeting vitamin K synthesis to reduce levels of circulating clotting factors, these agents either directly inhibit factor Xa or thrombin.43 NOACs possess a significantly shorter half-life compared to warfarin and a much wider space where doses are both efficacious and safe, making therapeutic monitoring much less necessary during the course of long-term anticoagulation.43 Between these characteristics and their smaller suite of drug interactions, there is limited to no need for the patient-specific dosing characteristic of warfarin treatment beyond
9
have generally only been approved for the treatment of non-valvular AF, so valvular AF is still treated with warfarin.
2.2.2.1: Dabigatran
Dabigatran (brand name Pradaxa) was the first of the NOACs to be approved in the United States for use in patients with non-valvular AF on October 10th, 2010. Dabigatran is a direct thrombin inhibitor, binding to thrombin to prevent thrombin’s conversion of
fibrinogen to the fibrin used to bind together platelets and create blood clots. It has a half-life of between 12 and 14 hours that is consistent across patients with normal renal function, resulting in twice-a-day dosing, and is eliminated renally, hepatically, and through P-glycoprotein pumps.50 Because it is not a CYP substrate, it possesses far fewer drug interactions than warfarin (though it interacts with P-glycoprotein inhibitors like proton-pump inhibitors) and because it acts on thrombin directly its effectiveness is not dependent on the amount of vitamin K a patient consumes. While the RE-LY trial examined both 110 mg and 150 mg dabigatran doses twice daily, only the 150 mg dosage was approved in the United States with a 75 mg dosage available for individuals with creatinine clearance between 15 and 30 mL/min. As of October 2015, Dabigatran is the first of the NOACs to have its own targeted reversal agent,
idarucizumab, which binds with dabigatran at the molecular level with higher affinity than thrombin to rapidly reverse dabigatran’s effects.51-53 Boehringer Ingelheim has posted the trial on
10
2.2.2.2: Other NOACs
Several other drugs have recently been discovered that fall under the umbrella of novel oral anticoagulants. Rivaroxaban (approved in the U.S. for AF on November 4th, 2011), apixaban (approved in the U.S. for AF on December 28th, 2012), and edoxaban (approved in the U.S. for AF January 8th, 2015) inhibit factor Xa of the clotting cascade, meaning they have a slightly different mechanism of action than dabigatran.54 Notably, rivaroxaban is the only one of these agents with once-daily dosing for prevention of stroke in AF. Each of these agents was approved after a randomized non-inferiority trial comparing them to warfarin: the ROCKET-AF trial by Bayer for rivaroxaban,47 the ARISTOTLE trial by Pfizer and Bristol-Myers Squib for apixaban,44 and the ENGAGE-AF trial by Daiichi Sankyo for edoxaban.46 In these trials, apixaban and edoxaban demonstrated superiority to warfarin with respect to both stroke prevention and major bleeding, rather than the stroke superiority and major bleeding non-inferiority shown by dabigatran and rivaroxaban. Andexanet alfa has been developed as an antidote for major bleeding associated with the use of any of these Xa inhibitors.55 Unfortunately, none of these trials are posted on ClinicalStudyDataRequest.com; individual-level or joint categorical trial data would need to be obtained through direct contact with the pharmaceutical company. Their later approval (particularly for apixaban and edoxaban) means that comparative effectiveness studies have a smaller sample size, particularly if data is only available through 2015 or the advent of ICD-10 codes, though there have still been several studies looking at each of them.
11
2.3: Existing Evidence on Dabigatran Safety and Efficacy
As with any approved drug, a great deal of research has been conducted in efforts to gauge the safety and efficacy of dabigatran. Several randomized controlled trials and multiple observational studies have sought to determine the relative merits of each potential pharmacologic treatment option.
Table 1 at the end of section 2.3 lists the results of some of these pivotal studies; more specifics regarding methodology and potential reasons for differing results are given throughout Section 2.3, as are the results of a phase II randomized controlled trial and subgroup analysis results from RE-LY.
2.3.1: Randomized Controlled Trials
2.3.1.1: RE-LY Trial
12
versus warfarin with a HR of 0.91 (95% C.I. 0.80, 1.03) and 0.88 (95% C.I. 0.77, 1.00), respectively. The non-inferiority margins set by the investigators were all met, and the drug was approved for dosing at 150 mg twice daily. It is not clear, however, how these tradeoffs might manifest in populations with differing distributions of risk factors for bleeding and stroke.
2.3.1.2: Evidence for
Heterogeneity in RE-LY
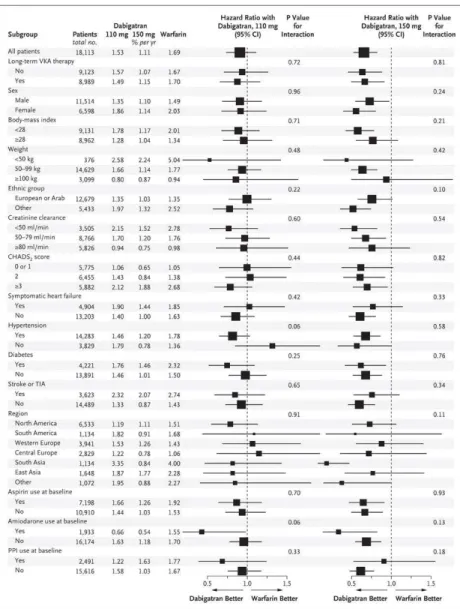
Some trialists have taken the position that subgroup analyses (and effect heterogeneity) should be ignored and the population relative effect should simply be applied to the estimated risks of individuals in each subgroup.56,57 This represents a significant assumption that effectively ignores the potential for biological differences in dose or individual metabolism of the studied drug. There is some evidence for heterogeneity of dabigatran effect in the RE-LY trial on the multiplicative scale used for the main analyses (p < 0.25 for the interaction) with respect to ethnic group, amiodarone use, sex,
13
mass index, and PPI use at baseline, as seen in Figure 5. Furthermore, age was not examined in their efficacy subgroup analyses. All of these factors may differ between the population of RE-LY patients and the Medicare AF patients; see Section D.1 for additional details. In addition, if the other variables in the table are associated with AF outcomes and are indeed not effect modifiers on the multiplicative scale, they will be effect modifiers on the absolute scale and necessary for estimating a valid risk difference and number needed to treat (NNT) for the clinical cohort.58 Furthermore, subsequent analyses of the RE-LY trial specifically analyzing different types of bleeding risk demonstrated relative scale effect heterogeneity based upon age when categorized above and below 75, particularly for extracranial hemorrhages.59,60 Similar subgroup analyses were conducted for the stroke outcome in patients with heart failure,61 patients using other antiplatelet therapies,62 patients with history of stroke or transient ischemic attack,61 and patients with paroxysmal vs persistent vs intermittent AF,63 with none of the analyses finding substantial heterogeneity on the hazard ratio scale but typically preserving benefit.
2.3.1.3: Other Trials of Dabigatran vs Warfarin
14
though the study centers were generally in European countries as well as the United States. Unlike RE-LY, PETRO was a phase II study focused on determining a safe dose of dabigatran that would result in an acceptable level of bleeding events relative to warfarin. It also sought to identify efficacy by examining the anticoagulant activity biomarkers of activated partial thromboplastin time and inhibition of D-dimer generation. Study investigators did not test a formal statistical hypothesis, instead seeking mainly to measure data on pharmacodynamics to help decide which doses should be used in the RE-LY study. Major bleeding events only occurred in the 300 mg of dabigatran twice daily group taking 81 mg or 325 mg of aspirin, and there were generally more bleeding events with higher doses of dabigatran and higher doses of aspirin. Of the groups, only the 50 mg dabigatran group had substantially lower
incidences of bleed than warfarin; the 150 mg dabigatran group was comparable. Only the 50 mg group experienced any embolic events. Biomarker analyses bore out these results. The end result of the study was to move forward with the 150 mg twice daily dabigatran dose, rather than the 50 mg or 300 mg dose, due to its favorable bleeding and embolic profile.
15
more gastrointestinal bleeds in the dabigatran group than the warfarin group (53 vs. 35). Because RE-LY focused on including individuals with cardiovascular risk factors, including age and diabetes, RE-COVER’s population was generally younger (mean age 71.5 in RE-LY vs mean age 55.0 in RE-COVER), suggesting there may be some modification of bleeding effect by age or these other risk factors that could account for the improved overall bleeding profile in RE-COVER.
2.3.2: Non-experimental Studies
There have been several comparative effectiveness studies published using routintely collected claims data in an attempt to determine whether dabigatran and other NOACs are as or more effective in practice compared to their performance in clinical trials. Their results have varied, but all have differed from RE-LY in one way or another. On the whole they reinforce the need for additional studies and examination of potential treatment effect heterogeneity.
Perhaps the largest study to date has been the FDA’s analysis using initiators of warfarin and dabigatran in the full Medicare sample from October 2010 to December 2012.15 They identified 67,494 new initiators of dabigatran and 273,920 new initiators of warfarin including individuals with any inpatient or outpatient diagnoses for AF or atrial flutter and excluding individuals with other competing indications for warfarin treatment. They used propensity score matching to eliminate differences in their study variables; based upon standardized mean differences (SMDs) they were successful and all
16
0.88, 1.07) for major bleeding, with a heightened risk of gastrointestinal bleeding for dabigatran patients with a hazard ratio of 1.28 (95% C.I. 1.14, 1.44); when they looked at dosages of 150 mg specifically, rather than 75 mg, they found improved stroke reduction (hazard ratio of 0.70) but greater risk of gastrointestinal bleed (hazard ratio of 1.51) more in line with the results of the RE-LY trial. They did notice, however, that the increase in the risk of gastrointestinal bleeding was concentrated in older adults, particularly women over 75 and men over 85. Women over 85 were the only group with an increased risk of mortality from dabigatran, but other groups experienced an improvement in mortality with an overall hazard ratio of 0.76 (95% C.I. 0.67, 0.86) with the 150 mg dose, more pronounced than the 0.88 observed in the RE-LY trial. The fact that they implemented an as-treated design and used such a short gap in days supply despite the large variance in warfarin prescribing makes it difficult to interpret the extent to which their findings parallel those from RE-LY. Still, the results were largely similar to the trial results on the relative scale, with a lower hazard ratio for mortality and some evidence of bleeding effect heterogeneity based on age and sex.
17
propensity score overlap to compare the difference between the dabigatran user and whole population, they do not share this information in their paper or supplement. After adjustment, they identified an increased risk of major bleeding with a hazard ratio of 1.58 (95% C.I. 1.36, 1.83) and an increased risk of gastrointestinal bleeding with a hazard ratio of 1.85 (95% C.I. 1.64, 2.07), both higher than the original RE-LY trial. Despite being conducted on a subsample of the FDA data, their results looked quite a bit worse for dabigatran, suggesting that either the difference in grace period, the use of a different target population than the FDA (the whole population of initiators rather than the dabigatran patients targeted in a matched design), worse confounding control, or all three are to blame.
Other U.S. governmental databases have been used to answer this question as well. Villines et al utilized the Department of Defense database, which provides uniform medical coverage and pharmacy benefits to nearly 10 million individuals receiving care at both military and non-military institutions, to find initiators of dabigatran and warfarin from October 2010 to July 2012 with at least one diagnosis for AF within 12 months of their initiation.17 They identified a cohort of 14,813 dabigatran users and 24,500 warfarin initiators, with propensity score matching using a model built by backwards selection reducing it to 12,793 of each. These authors used a grace period of 30 days after the final prescription, with sensitivity analyses exploring the impact of a 45 and 60 day grace period and integrating INR measurements as a way to extend follow-up, though it is unclear how they identified INR
18
changed results much. Overall, their results were more similar to the RE-LY results than the other non-experimental studies, but the fact that the gastrointestinal bleeding, M.I. and death estimates were substantially better for dabigatran than those from RE-LY is notable. Unfortunately, it is impossible to determine whether these differences are because of poor confounding control or heterogeneity, measured or otherwise, between this and the RE-LY trial population.
Other researchers examined private insurance databases. Seeger, Schneeweiss, et al performed an analysis using data from two commercial insurance databases (MarketScan from Truven and
Clinformatics from Optum) focusing on both safety and efficacy.18 These investigators identified 41,103 warfarin and 18,560 dabigatran initiators between October 2010 and December 2013. The authors matched on a propensity score with 78 investigator-specified covariates, resulting in a final cohort of 15,529 initiators of each medication (with successful removal of imbalances in the covariates as measured by the SMD), with an additional analysis using high-dimensional propensity scores. They performed an as-treated analysis with a grace period of 14 days without any days supply on hand, but also performed a sensitivity analysis extending this period by 365 days in an imitation of an intention-to-treat analysis. This study was the first to look at benefits on an absolute scale, rather than reporting purely hazard ratios. Individuals stopped follow-up at the time of death. Unlike many of the other studies, they combined ischemic and hemorrhagic strokes in their analysis. When contrasting dabigatran with warfarin, they found a hazard ratio of 0.77 (95% C.I. 0.54, 1.09) and oneyear risk difference of -0.0003 (95% C.I. -0.0006, 0.0002) for strokes and a hazard ratio of 0.75 (95% C.I. 0.65, 0.87) and risk difference of -0.018 (95% C.I. -0.025, -0.010) for major hemorrhages; they did not investigate
19
dabigatran stroke reduction in adults over 75 and improved reduction in major hemorrhage in adults under 55. All of this suggests that an older population (such the warfarin users in their analysis) might experience a differing risk/benefit profile than that in this study on both the absolute and relative scale.
20
between their cohorts even after propensity score matching and the strange trends between dabigatran doses (which could be the result of matching to different cohorts), their results are difficult to interpret but seem to show more pronounced benefits for dabigatran compared to the results from the RE-LY trial and other non-experimental studies.
21
hypertension, diabetes, and congestive heart failure. Overall, while they used an as-treated design that differed from RE-LY and included a younger patient population, these results reinforce that the overall benefits and risks of treatment with dabigatran may be quite heterogeneous across populations and that these heterogeneities in risk may only become apparent in large databases.
There is another study focusing on several different NOACs with dabigatran as one of the potential options whose results also warrant discussion. Lip et al conducted a study in MarketScan examining NOAC initiators from January to December 2013 focusing specifically on major bleeding risk and using Cox proportional hazards with direct adjustment for a variety of variables and backwards selection at p < 0.2.11 These authors identified a decreased rate of
major bleeding for dabigatran relative to warfarin (HR: 0.88, 95% C.I. 0.64-1.21). Their propensity matched analysis showed a slightly reduced rate of major bleeding with a hazard ratio of 0.69 (95% C.I. 0.50-0.96), suggesting some potential treatment effect heterogeneity.12 In both analyses individuals were followed until discontinuation from their initial medication or switching, though the amount of gap or grace period they allowed is unclear. These results generally seem to agree with those of other studies in younger, claims-
based cohorts.
22
be problematic, particularly when the competing event is roughly as common or more common than the event of interest.68 A new study in a Medicare cohort spanning more time using both IPTW and matched designs alongside an analysis using the trial data that conditions on staying on therapy would improve understanding of which medication performs better in an older population with a higher prevalence of comorbid conditions without assuming adherence patterns will be constant across the RE-LY and Medicare cohorts with respect to baseline modifiers.
Table 1: Results of published studies estimating the safety and effectiveness of dabigatran with respect to warfarin.
Study
population Type
Ischemic Stroke/Embolic Event Results
Gastrointestinal
Bleeding Results Mortality Results RE-LY6 ITT RCT HR: 0.76 ( 0.60-0.92) HR: 1.50 (1.19-1.89) HR: 0.88 (0.77-1.00)
RE-COVER65 ITT RCT --- 53 bleeds (dabigatran)
vs 35 bleeds --- 100% Medicare sample15 As-treated propensity-matched*
HR: 0.80 (0.67-0.96) HR: 1.28 (1.14-1.44) HR: 0.76 (0.67-0.86) 5% Medicare
sample16 As-treated IPTW --- HR: 1.85 (1.64-2.07) --- DOD
database17
As-treated propensity-matched*
HR: 0.73 (0.55-0.97) HR: 1.13 (0.94-1.37) HR: 0.64 (0.55-0.74) U.S. commercial claims18 As-treated propensity-matched*
HR: 0.77 (0.54-1.09) --- ---
Denmark19
As-treated propensity-matched*
HR: 1.18 (0.85-1.64) HR: 1.12 (0.67-1.83) HR: 0.57 (0.40-0.80)
Sentinel database20
As-treated propensity-matched*
HR: 0.92 (0.65-1.28) HR: 1.04 (0.83-1.30) ---
23
2.4: Heterogeneity Between Trial and Clinical Cohorts
RCTs have long been held up as the gold standard for assessing the effects of various
interventions, and for good reason.58 Randomization of patients will in expectation prevent confounding of effect estimates and often allows for straightforward data analysis. Unfortunately, the non-random nature of trial inclusion can lead to differences between trial cohorts and source populations in key variables, limiting our ability to directly transport results from the trial to target populations.69 There are three main types of heterogeneity that are concerning when attempting to transport the estimates of the RE-LY trial: demographic characteristic heterogeneity, warfarin management heterogeneity, and medication adherence heterogeneity.
2.4.1: Demographic Characteristic Heterogeneity
Heterogeneity in demographic characteristics between trials and source populations is a
common concern in the field of cardiology. A systematic review concluded that patients of advanced age and patients with complex comorbidity profiles are often not selected into randomized controlled trials in cardiovascular trials.10 Some studies have compared distributions of age, sex, race, and other baseline characteristics in trial patients compared to large-scale population estimates from stroke registries and found that trial populations are generally younger and more male.9 This is especially true when
comparing to older populations of patients initiating dabigatran. For example, in the FDA study using Medicare, the mean age was more than 75 compared to the RE-LY trial’s mean age of 71, 51% of initiators were female rather than RE-LY’s 64% male, and 33% of patients had diabetes rather than the 23% in RE-LY.15 Other researchers have assessed the proportion of patients seen in their clinic which would have been eligible for trial enrollment, finding that less than half of patients in a suspected stroke registry with AF were eligible for inclusion into the trials for the direct oral anticoagulants.7 The
24
any of the differing factors amongst eligible patients alter the treatment effect observed in the trial, adjustment of effect estimates will be necessary to obtain an unbiased effect estimate in the eligible patients.
2.4.2: Warfarin Management Heterogeneity
An additional source of heterogeneity between trials and clinical populations unique to oral anticoagulation is differences in methods of initiating and altering dosages of warfarin between trial and clinical practice.21 For example, RE-LY’s suggested warfarin management protocol involved specific changes in warfarin management with INRs observed in specific ranges; variance from this protocol was associated with lower time in therapeutic range (TTR, the amount of time patients spent with a safe and effective INR and a common metric for evaluating warfarin management quality).70,71 As a result of these algorithms and potential for better care, TTRs observed in trial patients can vary compared to the TTRs observed in community practice.71-73 While the median TTR in the RE-LY trial across all centers was 66%, national estimates for TTRs in the United States are between 54% and 55%.74,75
Outside trials, TTRs can vary depending on the type of provider managing anticoagulation, with cardiology clinics generally having higher TTRs than primary care at 61% vs 55% with only 10% of their time supratherapeutic rather than 15%.76 One analysis based in active anticoagulation clinics testing new methods for predicting effective warfarin management even showed TTRs above 75%.77 Even within the RE-LY trial, there was still substantial variation in INR control across the various centers that may have contributed to patients experiencing more or less benefit compared to being randomized to dabigatran.78 This is in part due to difficult to manage patients being excluded from trials, but different management methods are also likely to contribute. Dabigatran management and dosing is
25
warfarin. With all of these differences in warfarin management between the clinical trial and routine care setting, it becomes increasingly important to check the assumptions for generalizability when data does not exist to include warfarin management quality in the sampling model.
2.4.3: Medication Adherence and Persistence Heterogeneity
Adherence and persistence must also be considered in addition to management strategy. While estimating intention-to-treat effects ordinarily allows researchers to ignore adherence in the context of randomized controlled trials, if individuals outside the trial differ in their adherence to those included in the trial bias can be introduced into a transported effect estimate.79 Unfortunately, participation in a clinical trial also generally improves both adherence and persistence.80
If adherence were not linked closely linked to outcomes with the two medications, this problem might be ignorable. Regrettably, adherence is a clear cause of heterogeneity for both NOACs and
26
27
2.5: Methods for Transporting Causal Effects
Multiple methods exist for transporting and generalizing treatment effects from studies to differing populations. To give some perspective on the reasoning behind the methods that will be used in this study, we present here a brief summary of the oldest method for transporting results (direct standardization) as well as the advantages weighting methods have.
2.5.1: Direct Standardization Methods
Standardization is a potent and necessary tool for comparing results across different
populations, whether to assure internal validity and remove confounding or to improve external validity and remove problems of effect measure modification. As such, standardization has been used in
epidemiology for quite some time; the first examples involving standardizing rates of death can be traced back to the 18th century comparing observed to expected survival amongst various differing professions based upon age. It wasn’t until the 1970s that Miettinen published a paper describing the potential benefits of standardizing rate ratios to entire referent populations rather than using SMR weighting.86
When dealing with a few levels of key categorical variables, standardization is straightforward and simple cases are presented in textbooks58 describing generalization or transportation of causal effects. In standardization, a specific standard is chosen that identifies the distribution of key strata in a population. Estimates of treatment effects within those key strata are calculated and the results averaged using weights identified from the standard. Creating age category-sex standards is
28
standardization incredibly cumbersome and potentially imprecise. Moreover, dealing with continuous variables improperly when standardizing (for example, by dichotomizing age) may misrepresent the modification of the treatment effect of exposure and cause bias in the resulting estimates of treatment effects, just as it can result in bias when attempting to control for confounding.
2.5.2: Weighting Methods
Weighting methods are a more flexible alternative to standardization when generalizing and transporting treatment effects, though they rely on more parametric assumptions.87,88 In weighting methods, the trial population is transformed into a pseudo-population that resembles the target with respect to selected variables and then re-analyzed using these weights (Figure 6). In the setting of small numbers of categorical variables that may be potential effect measure modifiers and fully saturated non-parametric weighting models, weighting methods and standardization yield identical results. With larger numbers of effect measure modifiers or continuous effect measure modifiers, however, weighting methods allow researchers to obtain treatment effect estimates under some parametric assumptions that are cumbersome to implement in standardization.
29
be used, but this approach ignores the correlation of variables in the target population that could lead to interactions altering treatment effect. In order to transport both absolute and relative scale treatment effects (and thus transport the estimated risks), variables should be included in the sampling model that separate sampling and the outcome on a causal diagram.88,89
Logistic regression can then be used to estimate the probability of being in the study population rather than the target population, conditional on the key effect measure modifiers with as few or as many interaction terms as are necessary. From this probability, researchers can construct either inverse probability of sampling weights (IPSW) or inverse odds of sampling weights (IOSW) based on whether or not they wish to consider the study population part of the target population and generalize treatment results (which requires IPSW) or whether they consider the target population its own discrete to which the study results should be transported (which requires IOSW). These weights can be further stabilized based upon the probability or odds of sampling ignoring the key effect measure modifiers such that the sum of the weights will be equal to the original number of trial participants. Mathematically, stabilized odds weights are calculated for individuals in the study population as follows (where “EMM” refers to effect measure modifiers on the scale of interest):
ℎ ( ) =
( )
( | !!)" =
#( )
1 − #( )" ∗ 1 − #(#( | !!) " | !!)
30
2.6: Methods for Assessing Transportability
While these data transport methods exist and have existed in some form for quite some time, they have rarely been utilized. Part of this may be because of the lack of access to trial data, but some of it is surely due to difficulty in knowing when exactly they are necessary as well as how likely they are to actually work. After all, reweighting the trial population results in increased uncertainty that may lead to “non-significant” results, even if there is still evidence for some degree of causal effect. Techniques have been used to assess when we can’t transport trial results to a given target population, but they generally ignore the potential for effective use of a trial sampling model. Fortunately, an additional method has been theorized that helps assess performance of these weighting techniques.
2.6.1: Comparing Marginal Variable Distributions
Perhaps the most common method for assessing whether trial results are readily transported or generalized to “real-world” populations is simply comparing the proportion of individuals with a
characteristic to the amounts in the real-world, akin to what we discussed in Section 2.4.1 describing demographic characteristic heterogeneity. These methods are at the heart of the debate around representativeness in randomized controlled trials.90,91 How does the age distribution in RE-LY compare to that of the general AF population, or the Medicare AF population? Are there more or fewer African Americans than in the general AF population in the United States? Do more or fewer of them have comorbidities like hypertension, diabetes, and other stroke risk factors?
31
blue-eyed people in the study will not be a problem if the outcome is stroke and thus unlinked to eye color.
Second, even if the variable is associated with the outcome, its paths may go through other variables that were balanced in the study and target populations; the amount of bias they induce is proportional to the degree to which their association with the outcome remains. Take the issue of age, where trial participants are on balance younger than the general population but age was only associated with stroke because of diabetes. If the prevalence of diabetes were the same between the trial and general population, age would no longer be relevant.
Third, both standardization and weighting can be used to deal with variables that differ between the trial and target population, provided there are at least some individuals included with the
characteristic (though uncertainty increases and there is an attendant loss of precision). In other words, marginal imbalance or lack of representativeness is not in and of itself an obstacle to the theoretical exchangeability of the trial and target population.92 It does, however, represents an indicator for when we may want to standardize or weight trial results. Overall, while this method can indicate when the unweighted trial estimate is likely to be biased, a difference in distribution for a variable alone does not necessarily mean that obtaining an externally valid estimate is impossible, and indeed may be helpful for transporting trial results to a given population.93
2.6.2: Assessing Proportion of Patients Eligible for Trials
Another common metric to assess transportability, and one with potentially more merit, is the proportion of patients in a routine care practice or other target population that could have been
32
caveats apply as when comparing marginal distributions; if blue-eyed people were excluded completely from the trial, it is only relevant if being blue-eyed is associated with the outcome even after other variables have been accounted for.
Unfortunately, this is very likely the case with many trial eligibility criteria. They frequently increase the expected number of events to improve power with lower sample sizes or decrease the risk of negative safety outcomes for patient protection. We cannot rely upon weighting and standardization by this discordant variable because lack of positivity makes rendering the trial and target population exchangeable impossible; the trial simply contains no information on individuals with that covariate pattern.88 Extrapolating past the eligibility criteria requires reliance on non-experimental effect estimates and “generalizability bias,” a heavily limited concept dependent on similar confounding structure for eligible and ineligible individuals,94 or the use of various exposure-variable modeling techniques if the eligibility criteria is a continuous variable. Because both of these methods have quite strong assumptions, a greater the share of the target population ineligible for the trial generally
increases the potential for bias in transported effect estimates. Restricting the target population to trial-eligible individuals as much as possible reduces the risk of this kind of bias substantially.
2.6.3: Weighting Methods for Assessing
Transportability
There is another potential option that has been underutilized in epidemiology. Transport weights can identify whether outcomes are discordant between trial and target populations after utilizing sampling models. This method was first used in the transport literature by Stuart et al
33
using propensity scores in the setting of educational achievement95 and is analogous to the placebo-checking perspectives used in some trial indirect comparison literature.96,97 Factors associated with the outcome of interest will be effect modifiers on the absolute scale, relative scale, or both if there is a non-null treatment effect.58 Thus, a weight specification model that accounts for all heterogeneity on both scales and is properly specified should predict the risk of the outcome in patients in the target population receiving a treatment when it is applied to the patients in the trial receiving that same treatment (in other words, sampling and outcome will be independent on the transport diagram, a requirement of the weighting methods to yield unbiased results).88 You can then compare the observed target survival curves to the trial survival curves with or without weighting visually (Figure 7), at specific time points, or using proportional hazards regression. If there are large residual differences after weighting, the sampling model is inadequate for fully transporting results on both scales. Because we are focusing on the risk differences with respect to ischemic stroke and gastrointestinal bleeding, we can examine their incidence at specified time points in the unweighted trial, weighted trial, and Medicare cohorts to assess if additional effect measure modifiers or consistency violations due to warfarin management or medication adherence makes our transported effect estimates likely to be biased.
34
the outcome only in individuals receiving one of the two treatment arms. This approach is inherently retrospective and assesses whether trial results were transportable to a population that has already had a treatment decision made for it. This further solidifies its role as a method for ruling out
35
2.6: Public Health Significance
Understanding the risk-benefit profile of dabigatran in older adults is important for public health. Oral anticoagulants, including warfarin and dabigatran are used frequently in patients with AF, especially as criteria have shifted over time and point-of-care and self-INR monitoring have become more common.98,99 Since their introduction to the market in 2010, novel oral anticoagulants (including dabigatran) account for a large share of oral anticoagulant prescriptions100-103 and an even larger share of anticoagulant cost in the United States and worldwide, with dabigatran ranking 88th in current sales rank for all U.S. pharmaceuticals with over 800,000 prescriptions quarterly in 2013.104 With a large patient population and such frequently prescribed drugs, it is vitally important to make sure that the benefit-risk distribution for the potential treatment options are being appropriately presented to stakeholders at the patient, provider, and insurer level.
36
CHAPTER 3: RESEARCH PLAN
This research plan was designed to compare outcomes in older adults in routine care taking warfarin or dabigatran with risks in RE-LY trial participants, before and after adjusting for known risk factors; estimate effects of dabigatran compared to warfarin on ischemic stroke and gastrointestinal bleeding risk in older adults using transport weights; and assess how well estimates from various non-experimental methods agree with these transported trial results.
3.1: Overview
37
3.2: Data Sources and Collection
This research used two data sources from two populations that were collected in very different ways: the RE-LY trial’s individual-level data and cohorts of initiators of dabigatran and warfarin in Medicare from 2010 to October 2015.
3.2.1: RE-LY Population
3.2.1.1: RE-LY Population Description
Individual-level data for the RE-LY trial was obtained using Clinical Study Data Request (CSDR) and analyzed on the Clinical Trial Data Transparency (CTDT) platform, soliciting data access as soon as the analysis protocol is finalized. The RE-LY trial randomized 18,113 patients to warfarin, 110 mg
dabigatran twice daily, and 150 mg of dabigatran twice daily. We focused primarily on the results for the 150 mg dosage of dabigatran, since the 110 mg dose was not approved for usage in the United States. Eligible patients had documented AF during the six months before their enrollment, as well as at least one of five other risk factors for stroke including: age greater than 75; previous stroke, TIA, or systemic embolism; left ventricular ejection fraction under 40% in the past six months; a diagnosis of diabetes mellitus and age over 65; or hypertension requiring pharmaceutical treatment and age over 65; or documented coronary artery disease and age over 65.
Key exclusions to assure either safety or efficacy of warfarin or dabigatran included reversible AF, prosthetic heart valves or other conditions for which dabigatran had not been tested, stroke within the past 14 days or severe stroke within the past 6 months, a variety of conditions associated with increased risk of bleeding, active infective endocarditis, active liver disease, anemia or
38
conducted in a population from a variety of countries with a wide range of ages (mean age in dabigatran 150 mg of 71.5 years, standard deviation 8.8) and collected data on multiple potential causes of
heterogeneity including medication use, past stroke, and other medical diagnoses.
As a randomized controlled trial there is no confounding in expectation in the baseline covariate distribution in RE-LY (and analyses suggested limited chance confounding). This allowed estimation of an internally valid intention-to-treat effect estimate in the target population using outcome data from RE-LY in Aim 1 provided we have weighted the RE-RE-LY data to match the distributions of measured effect modifiers in our target. It does not, however, guarantee that an estimate censoring at treatment discontinuation will be internally valid. We limited our population to patients over 65 from the RE-LY trial to ensure we are looking only at older adults; this was not problematic from a sample size perspective, as 85% of the initial RE-LY trial population was over the age of 65.
3.2.1.2: Outcome Assessment in RE-LY
The RE-LY trial followed individuals for two primary outcomes after treatment initiation: first stroke or systemic embolism (efficacy) and first major hemorrhage (safety). These outcomes were reviewed and categorized by an international team of blinded adjudicators and patients were also provided symptom questionnaires at regular intervals; these symptom questionnaires were followed up on with medical record review. Stroke was defined as “sudden onset of a focal neurologic deficit in a location consistent with the territory of a major cerebral artery” and was divided into ischemic,
hemorrhagic, and unspecified types. Major bleeding was defined as reduction in hemoglobin level of 20 grams per liter or more, transfusion with at least 2 units of blood, or symptomatic bleeding in a critical area or organ.
39
capturing embolisms in claims data)106; risk of hemorrhagic stroke may be elevated with a more potent anticoagulant while risk of an ischemic stroke is lowered, so all stroke were analyzed in a secondary analysis. When assessing bleeding outcomes, focused specifically on gastrointestinal bleeding events, with the less-specific major bleeding term being used for secondary analyses. We also used crude mortality data from the trial.
3.2.1.3: Exposure Assessment in RE-LY
In order to facilitate comparison with non-experimental analyses and prevent the large gap in warfarin adherence (see section 2.3.2: Non-experimental Studies under Background and Significance) from jeopardizing transportability, our main analyses censored individuals at treatment switching or discontinuation.
In order to conduct any non-ITT analysis, we required data on when individuals discontinued or switched from drug to which they were randomized. Fortunately, the RE-LY trial tracked individuals to see whether they discontinued the study drug across the study period, with a one week grace period after permanent discontinuation. In our intention-to-treat secondary analyses, exposure assessment for trial patients was trivial: all their person-time was assigned the exposure to which they were
40
3.2.1.4: Covariate Assessment in RE-LY
Two types of covariates were assessed in RE-LY in addition to exposure and outcome: 1) effect measure modifiers for use in the sampling model and 2) variablesassociated with discontinuation and censoring. Fortunately, RE-LY collected a large quantity of baseline information on variables
hypothesized to be associated with the outcome in order to examine treatment effects in various subgroups that can be leveraged in these analyses.
41
Effect measure modifiers: Potential effect measure modifiers were identified from Figures 8 and
9, which depict hypothesized causal relationships between sampling, our outcomes of stroke and bleeding, and a variety of other variables. These diagrams were built by examining the marginal distributions of variables in trial and target populations (including in the literature review) as well as review of risk factors for stroke and bleeding for patients with AF. As mentioned in section 2.5.2:
Weighting Methods, a transport model that renders sampling independent of the outcome should allow estimation of an unbiased estimate in the target population. After adjusting for comorbidities, age, sex, frailty, and history of past medication use, the only path from sampling to either of our outcomes will be via the discontinuation and management node. Fortunately, censoring individuals at discontinuation or switching will reduce the potential for differing rates of discontinuation to be problematic.
42
variables had large differences between RE-LY and Medicare, likely due to a combination of differing sensitivity and specific of our pre-specified code-based algorithms compared to clinical assessment with longer lookback (when examining past vitamin K antagonist use) or simply assessing different things (when looking at bleeding in the past year vs. bleeding while on a vitamin K antagonist). This made weighting by hypertension, history of bleeding, and past use of vitamin K antagonists generate
extremely large weights that inflated variance unreasonably. Our main analyses omitted these variables, though we did explore using an altered definition of hypertension. Still, Aim 2.1 assessed the extent to which this or other unmeasured factors may bias our prediction of the outcome in the target
population.
Censoring weight covariates: We used baseline covariates to standardize the population
continuing treatment to continue to be representative of the population at baseline even if some of the effect modifying covariates are associated with censoring (or, in this case, trial discontinuation). This is for two reasons: first, there is potential for introduction of confounding after initial randomization. If, for example, patients with hypertension are more likely to discontinue treatment with warfarin than
treatment with dabigatran and hypertension is associated with increased stroke risk, an unweighted effect estimate censoring at discontinuation or switching would be biased in favor of dabigatran.107 Inverse probability of discontinuation weights can help deal with this problem.
The second reason is particular to transporting effect estimates that requires continuous prescribing and deals with mismatched effect measure modifiers or risk factors in the two populations. Suppose that patients in the target population with diabetes in the target population are more likely to discontinue their warfarin or dabigatran, while patients in the trial population are not. If we do not weight or standardize both populations, we could see differences in our weighted trial effect estimate and non-experimental population effect estimates purely because at later time points the trial
43
differences in our Aim 2.1 assessment of transportability that arise only because of differences we’ve induced by requiring individuals to stay on their initial therapy.
The solution was stabilized inverse probability of censoring (sIPCW) weights. In the RE-LY trial, these were estimated with stepwise logistic regression within each treatment arm assessing the
probability of staying on treatment up to a given time point, then the next time point, then the next, and so on. Variables were assessed at baseline, as RE-LY did not have readily available data on post-baseline variables. Individuals time periods were then assigned weights according to the following equation where Zi is the set of time-varying and baseline covariates associated with sampling and Tx is the treatment arm.
#' =#('#(' ( = 0| ' (*+= 0, -. = / )
(01 | ' (*+= 0, 23, -. = /)
We included effect measure modifiers as well as confounders that are known in the trial (discussed below in the non-experimental section) in the model. Fortunately, warfarin and dabigatran do not cause changes in many of these variables, particularly most of the comorbidities and age, so there are few mediators we have to worry about conditioning on.
3.2.2: Medicare Atrial Fibrillation Population
3.2.2.1: Medicare Atrial Fibrillation Population Description
44
cohort of dabigatran and warfarin initiators; and second, a cohort of dabigatran and warfarin initiators, where dabigatran users are allowed to have previously initiated warfarin or switched to dabigatran.
Patients were eligible for inclusion into the Medicare cohort at their first initiation of warfarin or 150 mg twice daily dabigatran with a 60-day washout period for use of either drug or another NOAC (apixaban, rivaroxaban, and edoxaban), provided they had an inpatient or outpatient AF diagnosis code in the 6 months before or 1 week after their prescription (in which case follow-up began at the time of diagnosis). This requirement for a recent AF diagnosis code was analogous to the RE-LY trial inclusion criteria that required evidence of recent AF. Individuals had to meet the eligibility criteria for RE-LY including at least one risk factor for stroke (described in section 3.2.1.1: RE-LY Population Description), as represented by at least one diagnosis code in the year prior to initiation (specific codes listed in
Appendix B) or age over 75. Individuals also needed to have 12 months continuous coverage in
Medicare parts A, B, and D before this index prescription to enable assessment of eligibility criteria, key effect measure modifiers, and potential confounders.
This period was also used to exclude individuals with identifiable exclusion criteria for the trial, including liver disease, severe stroke within the past six months, anemia and thrombocytopenia, valvular AF or prosthetic heart valves, and severe renal insufficiency (specific codes listed in Appendix B). If there were multiple eligible initiations, only the first eligible initiation was included. This Medicare cohort contributed external validity to the project and allowed insight into the distribution of effect modifiers in a general clinical cohort participating in anticoagulation care that may not have been willing or able to participate in a trial, critical for Aim 2. It also provided data for the Aim 1 non-experimental analyses.
45
that initiated warfarin for AF that could have been included in RE-LY; and 4) patients with less than 15% predicted probability of frailty that initiated dabigatran for AF that could have been included in RE-LY.
3.2.2.2: Outcome Assessment in Medicare
Unfortunately, we did not have access to medical records for review by an international blinded group of adjudicators for use in this cohort. Instead, we used ICD-9 codes in claims, both inpatient and outpatient, to identify ischemic stroke and gastrointestinal bleeding. We used similar ICD-9 codes to identify the types of stroke that were used in past non-experimental analyses using claims-based data to facilitate comparisons to their results (i.e., by Seeger et al.).18 Medical record review in some databases have shown positive predictive value of close to 90% for these codes, suggesting they perform quite well.108 The full list of codes for stroke is presented in Appendix A. We specifically examined codes for ischemic stroke, with secondary analyses examining all strokes.
46
3.2.2.3: Exposure Assessment in Medicare
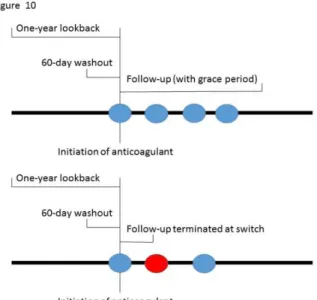
Prescription claims data for Medicare beneficiaries were used to identify warfarin and dabigatran initiators from 2010 to October 2015. Individuals were defined as initiators if the days supply from their last prescription for an oral anticoagulant ran out at least 60 days prior to the initial prescription. In the analysis censoring at discontinuation individuals’ follow-up time was
censored after switching medications as or having a 30-day gap in novel oral anticoagulant coverage or a 45 day gap in warfarin coverage as shown in Figure 10, with the larger gap for warfarin provided due to the fact that pharmacy days’ supply may be out of sync with the way patients are taking warfarin due to changes in directions for use at anticoagulation management appointments. To help identify warfarin initiators who may start to pay purely out of pocket, CPT codes for INR draws or anticoagulation management (CPTs 85610, 99363, and 99364)111 “refreshed” warfarin prescriptions and extended the length of follow-up for thirty days from the time of the CPT code. In the intention-to-treat analysis, individuals will be followed until death.
47
3.2.2.4: Covariate Assessment in Medicare
We assessed three kinds of covariates in the Medicare cohort: 1) effect measure modifiers, 2) confounders, and 3) censoring covariates.
Effect measure modifiers: Effect measure modifiers in the Medicare cohort were assessed at the
date of treatment initiation for the Medicare cohort. We used a lookback period of one year in claims data to assess the presence of the variables depicted in the sampling diagrams depicted in Figure 8 and
Figure 9. Specific ICD-9 codes are listed in Appendix B.
Confounding variables: Confounding variables were assessed at the date of treatment initiation