NEURAL BASIS OF THE NEUROLOGICAL DIAGNOSTIC
POWER OF VIBROTACTILE SENSORY TESTING
Theresa Marie Forshey
A dissertation submitted to the faculty of the University of North Carolina at Chapel Hill in partial fulfillment of the requirements for the degree of Doctor of Philosophy in the
Department of Biomedical Engineering.
Chapel Hill 2013
Approved by:
Barry L. Whitsel, Ph.D.
© 2013
ABSTRACT
THERESA MARIE FORSHEY: Neural Basis of the Neurological Diagnostic Power of Vibrotactile Sensory Testing
(Under the direction of Dr. Mark A. Tommerdahl)
As with most other injuries and disorders, the prognosis of neurological impairment is dependent upon early and accurate detection. Likewise, after an appropriate diagnosis has been made, it is important to start the patient on an effective treatment plan. Often a clinician prescribes a medication and asks the patient to come back for a follow-up appointment. It would be highly beneficial if the clinician could instead conduct a quantitative assessment to immediately determine the effectiveness of a prescribed treatment. Our research utilizes non-invasive, non-painful tactile sensory assessments which could assist in the timely, accurate detection of neurological impairments and evaluation of the effectiveness of attempted treatments by quantifying minute changes in cortical functionality.
assessments could become valuable tools in future clinical applications for the diagnosis of neurological disorders.
ACKNOWLEDGEMENTS
TABLE OF CONTENTS
LIST OF TABLES ………..……... viii
LIST OF FIGURES ………...…... ix
LIST OF ABBREVIATIONS ………...… xi
Chapter 1. INTRODUCTION ………. 1
2. METHODS ………...…. 5
2.1 Animal experimental procedures and analysis ……… 5
2.2 Human experimental procedures and analysis ………... 12
3. AMPLITUDE EFFECTS ON CORTICAL ACTIVITY AND PERCEPTUAL PERFORMANCE ……….…. 17
3.1 Stronger amplitudes increase temporal contrast ……… 17
3.2 Frequency discrimination capacity improves with stronger amplitudes ……… 25
3.3 Amplitude discrimination capacity is variably dependent on frequency ……….….. 31
4. DURATION EFFECTS ON CORTICAL ACTIVITY AND PERCEPTUAL PERFORMANCE ………..…… 39
4.1 Increased spatial and temporal contrast with extended stimulus durations ..……...……..………..………..………..……. 39
5. SPATIALLY DISTINCT CORTICAL REGIONS
COMMUNICATE DURING TACTILE PERCEPTION ……..……….. 51
5.1 Synchronization across spatially distinct cortical regions ...…….. 51
5.2 TOJ capacity diminishes with preconditioning vibrotactile stimulation ………...……...………..………..………..…….. 56
5.3 Bilateral stimulation suggests communication across cortical hemispheres ………..………..… 61
6. DISCUSSION ………..….…... 80
6.1 Cortical Metrics in comparison to other Quantitative Sensory Testing ………..……… 80
6.2 Representation of vibration in the primary somatosensory cortex in relation to perception ….…………...……….……. 87
6.3 Role of synchronization in information processing ………... 95
6.4 Overall conclusions ……….…. 100
6.5 Future research ..……….….. 101
LIST OF TABLES
Chapter 3
3.1 Frequency discrimination protocol at different amplitudes ………..…..… 27 3.2 Amplitude discrimination protocol at different frequencies……… 33
Chapter 4
LIST OF FIGURES
Chapter 2
2.1 Four site vibrotactile stimulator ………. 15
Chapter 3 3.1 Exemplary temporal response with increasing amplitude ……… 19
3.2 Temporal response with increasing amplitude ……….… 20
3.3 Detailed exemplary temporal response for increasing amplitudes ……….………… 21
3.4 Another detailed exemplary temporal response, increasing amplitudes from 12 µm to 200 µm ………...……… 21
3.5 Another detailed exemplary temporal response, increasing amplitudes from 25 µm to 400 µm ………...…... 22
3.6 Effects of stimulus amplitude on entrainment ………. 23
3.7 Visual contrast ………. 24
3.8 Frequency discrimination procedure ………...…. 26
3.9 Preliminary frequency discrimination testing at various amplitudes ……… 28
3.10 Frequency difference limens at various amplitudes ………...………….. 29
3.11 Amplitude discrimination procedure ………...……… 33
3.12 Amplitude discrimination capacity at various frequencies ……….. 34
3.13 Weber fractions at various frequencies……….……….... 35
3.14 Amplitude discrimination capacity at 10 Hz versus 40 Hz ………….…. 37
Chapter 4 4.1 Exemplary SI penetration …………..………..………. 41
4.3 Exemplary neuron ………..…..……. 44
4.4 Second exemplary SI population ………….………...………….. 45
4.5 Modified amplitude discrimination procedure ……….. 47
4.6 Amplitude discrimination capacity at various durations ..…….………... 49
Chapter 5 5.1 Exemplary stimulation protocol ………...… 52
5.2 Exemplary experiment ………. 53
5.3 Second exemplary experiment ………. 54
5.4 Temporal order judgment procedure ………..…….…….…... 58
5.5 Temporal order judgment capacity at various conditioning amplitudes ……….…... 59
5.6 Linear fit of temporal order judgment capacity ……….………….……. 60
5.7 Normalized temporal order judgment capacity ……….………….…... 60
5.8 Bilateral modifications to stimulator placement ………..…… 64
5.9 Bilateral amplitude discrimination procedure ..………..….…. 67
5.10 Amplitude discrimination capacity with unattended hand stimulation ……… 70
5.11 Inhibition models of cross-hemisphere activity ………... 76
LIST OF ABBREVIATIONS
2AFC (two-alternative forced choice)
2-D (2-dimensional)
μm (micrometers)
CCG (cross- correlograms)
CNS (central nervous system)
D2 (digit 2 – index finger)
D3 (digit 3 – middle finger)
DL (difference limen)
Hz (Hertz)
IACUC (institutional animal care and use committee)
ISI (inter-stimulus interval) ITI (inter-stimulus interval)
MFR (mean firing rate)
msec (milliseconds)
n (number of subjects)
OIS (Optic intrinsic signal) PC1 (principal component 1) PC2 (principal component 2)
PCA (principal component analysis) PSTH (peri-stimulus time histogram) QST (Quantitative Sensory Testing) RI (response interval)
sec (seconds)
SII (secondary somatosensory cortex) S/T (standard/test stimulus)
TOJ (temporal order judgment)
USPHS (United States Public Health Service) VAS (visual analogue scale)
CHAPTER 1
INTRODUCTION
immediately determine the effectiveness of a prescribed treatment. Additionally, acquiring specific measures of central nervous system (CNS) functionality should reduce the potential biases (e.g. placebo effect) from subjective patient feedback and produce a more accurate evaluation of the current treatment methods.
differently depending on the source of the abnormality. Nevertheless, it is the potential for the results from all of these tests (within a particular focus group) to deviate from the healthy controls group that is the most beneficial for clinical diagnosis. For instance, if the information processing mechanisms which facilitate human perception are impaired, then all of the sensory tests should clearly demonstrate below normal perceptual capabilities. Additionally, these diagnostic assessments utilize rapid detecting devices that are economical and pain-free. Even in cases of chronic pain, our sensory assessments could be used to evaluate changes in cortical functionality without the need to provoke any pain in the patient (Zhang et al., 2011a). These diagnostic tests could allow the clinic to implement more cost-effective and efficient diagnosis tests while maximizing personal comfort.
applications and serve as valuable diagnostic tools for the diagnosis of neurological disorders.
CHAPTER 2
METHODS
For these studies, we measured the cortical response in monkeys and cats to vibrotactile stimulation and compared those results to records of human performance on similar tactile sensory assessments. The basic methods for these two divisions of our research (animal and human) are described in this chapter. In later chapters, specific modifications to these standard methods are individually described for each study.
2.1 Animal experimental procedures and analysis
All methods and procedures were reviewed and approved by an institutional animal care and use committee (IACUC) prior to experimentation. Our research complies with United States Public Health Service (USPHS) guidelines on animal care and welfare.
Subjects and preparation
cannulas were placed into the femoral artery for monitoring blood pressure and femoral vein for administering drugs and fluids (5% dextrose and 0.9% NaCl), (4) a 1.5 cm opening was made in the skull exposing the forelimb regions of SI, (5) a recording chamber was placed over this opening and sealed with dental acrylic, (6) dura covering the cortical region of interest was removed, (7) the recording chamber was filled with artificial cerebrospinal fluid. The surgical procedures were conducted under deep general anesthesia. To lessen the chance of drug induced cerebral edema and bacterial septicemia, methylprednisolone sodium succinate (20 mg/kg) and gentamicin sulfate (2.5 mg/kg), respectively, were injected intramuscularly. Each wound was injected with a long-lasting local anesthetic before closure with sutures and bandages. After a completed preparation, the subjects were immobilized by Norcuron and connected to positive pressure ventilation. Following these surgical preparations, the concentration of the halothane/isoflurane in the oxygen and nitrous oxide mixture was reduced to keep the subjects under a light general anesthesia during the recordings sessions. Autonomic signs (heart rate, respiratory rate, etc.) were monitored and further adjustments to the anesthetic gas mixture were made to maintain vital signs consistent with light general anesthesia. Rectal temperature was sustained at 37°C with a heating pad. Pre-experimental optical imaging assisted electrode placement.
Cutaneous stimulation
was positioned 500 microns past the point of skin contact and remained in contact with the skin during stimulation. Range for the stimulus could reach 1-1000 µm in amplitude and DC to 250 Hz in frequency. A computer controlled digital waveform circuit board allowed the option to choose which amplitudes and frequencies of vibratory stimuli would be administered.
Optic Intrinsic Signal Imaging (OIS)
OIS imaging of the exposed cortical surface was obtained using an oil-filled chamber capped with a near-infrared (833 nm) optical window and a 200 msec exposure time. In order to generate average absorbance images, prestimulus and poststimulus images were captured. The prestimulus images were acquired 200 msec before stimulus onset and used as references. Poststimulus images were taken approximately every second until 20 sec following stimulus onset. Average absorbance images were produced by subtracting the prestimulus image from the corresponding poststimulus image and then dividing this resulting image by the reference image. The averaged absorbance images indicate changes in infrared light absorption. These increases and decreases of absorbance reflect corresponding changes in neuronal activation (Favorov et al., 2006; Simons et al., 2005, 2007; Tommerdahl et al., 1999a, b, 2002, 2005a, b, c; Whitsel et al., 2001).
Neurophysiological recording
the extracellular single-unit spike discharge activity to be recorded at high quality. The electrolytically sharpened, glass-insulated electrodes were also compatible with the amplifiers and closed-chamber recording equipment. The electrodes had been specifically designed for marking the cortex with small electrolytic lesions (using small DC currents) while still causing minimal damage to the targeted region. To record from a series of depths in a single cortical column, the electrodes penetrated SI at nearly 90o angle to the pial surface. Multiple penetrations were often recorded for future cortical analysis. The recording chamber was hydraulically sealed, “closed-chamber”, to minimize influence of cortical pulsations (from the cardiovascular and respiratory system) on the recordings. At a 20 KHz sampling rate, single unit and multi-unit samples (using 1-4 non-overlapping voltage windows) were recorded. Analog information (such as stimulus onset, interstimulus interval, and applied frequency) was digitized and saved with the spike data. Stimulus information for each set of recordings was reviewed and deviations in applied stimuli were removed from analysis. Von Frey-type filaments provided aid in determining the receptive field of the recorded neurons. Computations of stimulus and spike information were made with Alpha Omega and MATLAB software.
Mean firing rate (MFR) analysis
differences in MFR among the two groups were measured. One exemplary experiment traversed and sampled the full extent of the area 3b region, and thus allowed a transitional observation of marginal, to central, and back to marginal neurons. The other exemplary experiment traversed a smaller part of area 3b and consisted of only central neurons.
Peri-stimulus time histograms (PSTH)
Similar to the MFR analysis, the stimulus response (firing rate in spikes/sec) was measured by counting the number of spikes in a designated time period and then dividing that count by the number of bins. For PSTH, we are studying the phase of the stimulus response rather than the overall activity. Here we observe at 40 msec intervals (one cycle for our 25 Hz stimulus) and examine where in the stimulus cycle spike activity occurs. We chose 1msec bins (total of 40 bins per cycle) for our unit of time. Using PSTH analysis, the stimulus response for the first four cycles following stimulus onset could be averaged together and compared to the average of the first four cycles near 1sec of 25 Hz stimulation (cycles 22-25).
Principal component analysis (PCA)
Both single unit and population phase dynamics were measured. The first two principal components contained over 80% of the data. A hierarchical method confirmed that the information could be accurately depicted in our 2-D PCA plot.
Cycle Raster Plot
The cycle raster plot shows the spiking activity for a given neuron in relation to the phase of the applied vibratory stimulus. Each tick mark indicates an action potential at a particular time in each cycle of vibration. These plots provide a more in depth representation of the dynamics involved in a vibrotactile stimulus response. A decreased number of tick marks from one cycle to another indicates a lower level of activity, while a change in tick mark concentration from one part of a cycle to another indicates a change in the preferred phase.
Cross-correlogram (CCG) analysis
CGGs. Similarly to our PSTH analysis, permuted CCGs between the first four cycles following stimulus onset were averaged together and compared to the average of the first four cycles near 1sec of 25 Hz stimulation (cycles 22-25).
Degree of Entrainment
Entrainment, as measured here, refers to the position within the current stimulus cycle at which spike activity occurs. This approach to interpreting neural spike train data was first introduced by Goldberg and Brown (1969). Each spike has a particular phase angle Θ in relation to the current stimulus cycle (0 <= Θ <2π). The strength of entrainment for a sample population of N can be calculated from the phase angle and quantified by length r of their vector sum (Equation 2.1).
Equation 2.1
2.2 Human experimental procedures and analysis
Subjects
102 healthy subjects were recruited for the studies. Participants ranged from 20 to 42 years of age. For initial screening, subjects completed a survey on current medications and medical history prior to the experimental tests and participants with any history of cognitive dysfunction were excluded. Subjects signed a written informed consent form after a brief description of the study was explained. The explanation included the procedures of the study, the expected duration of the experiment, and the risks of participating in the study. Subjects were otherwise naïve to the study design and issue under investigation. Subjects were reassured that their participation was entirely voluntary, and they could request to terminate the study at any time. Generally tests lasted no longer than an hour; the exact duration was dependent on subject performance on the various sensory training procedures and assessments. An Institutional Review Board reviewed and approved the experimental procedures in advance.
Sensory assessment procedure
stimulator. The position of the stimulus probes was rotated to optimize hand position and comfort for each subject. Typically only two stimulator probes were utilized in a given experiment. These probes made contact with the glabrous tips of the second (index, D2) and third (middle, D3) fingers of the left hand. Subjects controlled a two-button response device (wireless mouse) with their right hand. Visual cues indicating the standard/test stimulus and response intervals were provided on a computer monitor. These stimulators and experimental procedures have assessed numerous sensory information processing characteristics in a variety of subject populations (Folger et al., 2008; Francisco et al., 2008, 2012; Holden et al., 2011; Nelson et al., 2012; Rai et al., 2012; Tannan et al., 2005, 2006, 2007a, b, 2008; Tommerdahl et al., 2007a, b; Zhang et al., 2009, 2011a, b; Nguyen et al, 2013a, b).
Tracking Paradigm
decrease. This change in bias increases the accuracy of our threshold measurements by preventing the paradigm to track down when a subject simply guessed the correct answer (Tannan et al., 2006). Tracking paradigms were used in the frequency, amplitude, and temporal order judgment assessments.
Exemplary Tracking Paradigm for an Amplitude Discrimination test: 200 µm standard vs 400 µm test at 20 Hz
In each amplitude discrimination run, the initial test amplitude was twice the standard amplitude, while the step size of the tracking paradigm (the amplitude which the test amplitude was increased or decreased) was 10% of the standard stimulus amplitude. For instance, a 200 µm standard amplitude had an initial test amplitude at 400 µm and a 20 µm step size for tracking. Subjects could only track as low as the minimal test amplitude. To maintain a continuous difference between the test and standard stimuli, the test amplitude was always at least 5 µm above the standard amplitude. So instead of matching the 200 µm standard, for this particular amplitude discriminatory assessment the test minimum was 205 µm.
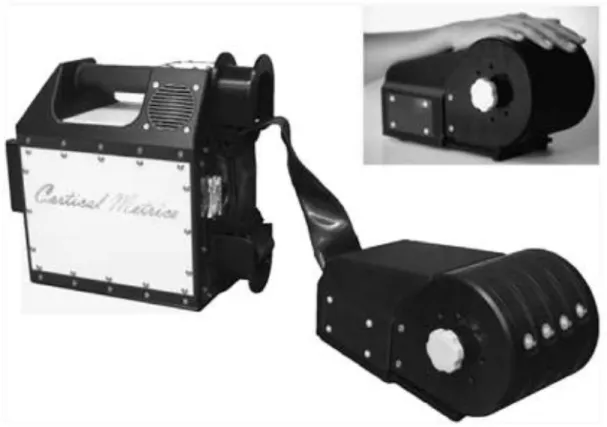
Figure 2.1 Four site vibrotactile stimulator. Top right: During an experimental session, subjects sit comfortably in a chair with their arm resting on an arm rest that is attached to the head unit of each device.
Data Analysis and Normalization
Equation 2.2
Normalized Discrimination (%) = (DL variation) / (DL baseline)
For example, the results of the amplitude discrimination procedure in the absence of bilateral stimulation (DLbaseline) were used as a reference to normalize the
discrimination thresholds in the presence of bilateral stimulation (DL variation). First the
ratios of the DLs (Equation 2.2) were calculated for each subject. Then the average of the DL ratios across subjects was calculated. This value showed the effect of unattended hand stimulation (in comparison to the unilateral condition) on a subject by subject basis averaged across a population.
CHAPTER 3
AMPLITUDE EFFECTS ON CORTICAL ACTIVITY AND PERCEPTUAL PERFORMANCE
3.1 Stronger amplitudes increase temporal contrast
Modifications of the standard Animal Experimental Procedure
For this section of the study, research and analysis was conducted as previously explained in the “Animal Experimental Procedures” section of the Methods Chapter. Microelectrodes recorded the response in area 3b to continuous 1 sec (minimal) durations of 25 Hz vibrotactile stimulation on the glabrous pad of the distal phalanges in 6 pigtail monkeys with a total of 47 cortical neurons. The amplitudes of stimulus vibration ranged from 10 µm to 400 µm. The analysis consisted of PSTHs, cycle raster plots, and measures for the degree of entrainment.
Results
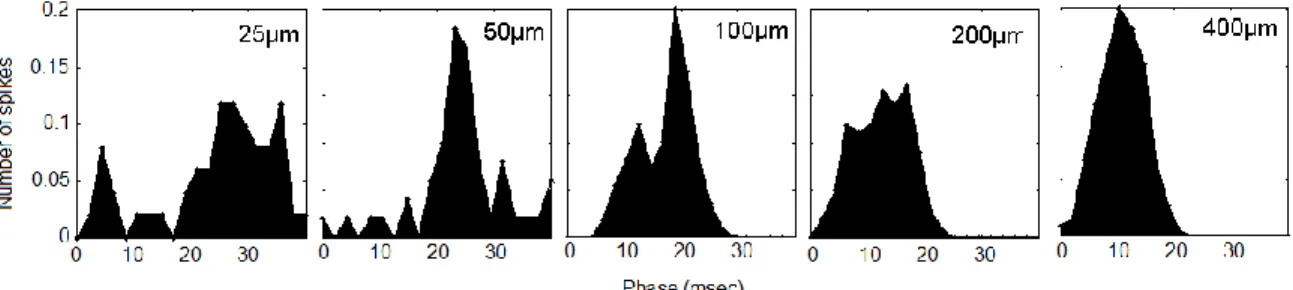
Figure 3.1 Exemplary temporal response with increasing amplitude. PSTHs of the cortical response to 5 amplitudes of 25 Hz stimulation for 1 sec. Increasing the stimulus amplitude from 25 µm to 400 µm increases the temporal contrast by eliciting a sharper response with a narrower time window.
This increase in synchronization and temporal contrast appears to be a general trend with stronger amplitudes for the cortical response. Figure 3.2 shows the spike activity in relation to cycle phase for 5 more exemplary neurons (one neuron per column) from 3 separate experiments on non-human primates to 1 sec of 25 Hz vibrotactile stimulation. For these experiments, amplitudes ranged from 10 µm to 400 µm. For each neuron, the temporal window of cortical response shrunk and the peak of activity became more prominent.
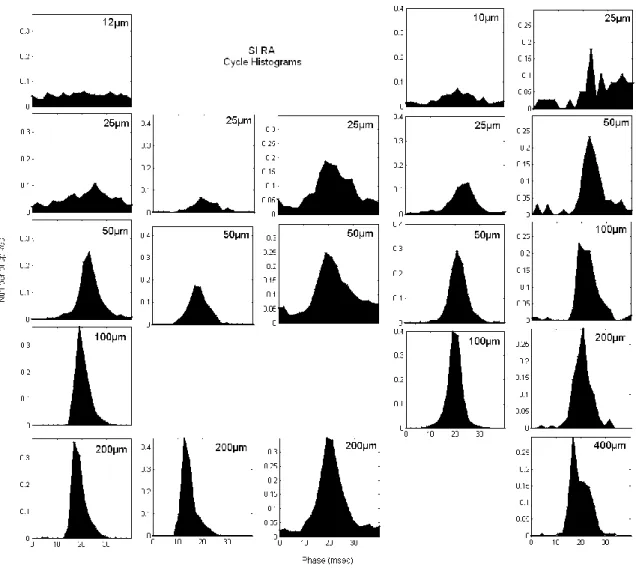
Figure 3.2 Temporal response with increasing amplitude. PSTHs of the cortical response to 7 amplitudes of 25 Hz stimulation for 1 sec. Each column of figures represents a different cortical neuron. The spike activity is on the y-axis with cortical phase in relation to the applied stimulus on the x-axis. Increasing the stimulus amplitude from 10 µm to 400 µm increases the temporal contrast by eliciting a sharper response with a narrower time window.
shrinks from approximately 30 msec in the 25 µm amplitude condition to approximately 10 msec for the 200 µm amplitude stimulation.
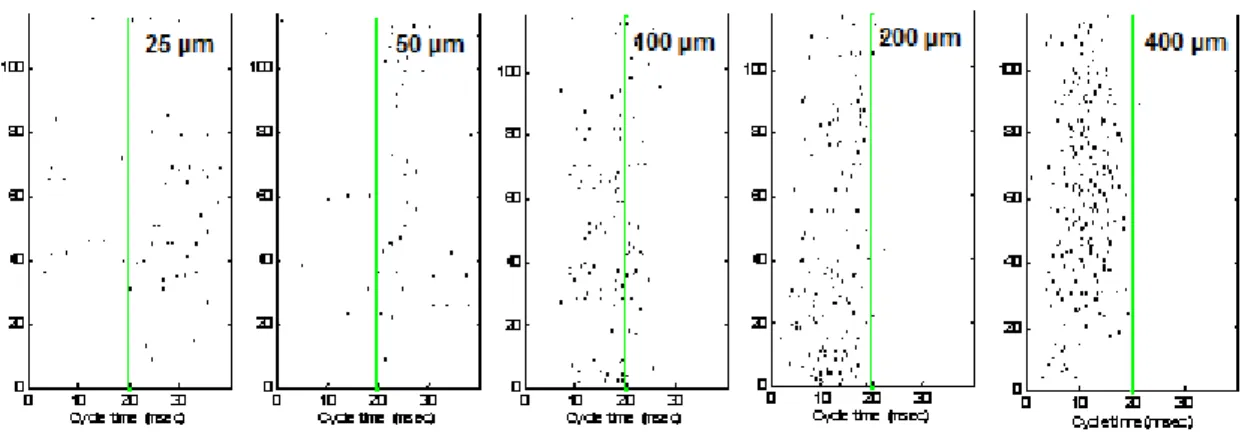
Figure 3.3Detailed exemplary temporal response with increasing amplitudes. Cycle raster plots of the cortical response to 3 amplitudes of 25 Hz stimulation for 3 sec. Increasing the stimulus amplitude from 25 µm to 400 µm increased the temporal contrast by eliciting a sharper response with a narrower time window.
amplitudes: 12 µm, 25 µm, 50 µm, 100 µm, and 200 µm (left to right, respectively). Again, the temporal window of response dramatically decreases with stronger stimulus amplitude. Instead of a scattered, rather randomized response as evident with 12 µm stimulation, 200 µm stimulation elicits a tight, well synchronized response that was approximately limited to 15 msec (starting at 15 msec and stopping by 30 msec) of the 40 msec cycle.
Figure 3.5 Another detailed exemplary temporal response, increasing amplitudes from 25 µm to 400 µm. Cycle raster plots of the cortical response to 5 amplitudes of 25 Hz stimulation for 5 sec. Increasing the stimulus amplitude increased the temporal contrast by eliciting a sharper response with a narrower time window.
amplitude was increased, there appears to be a corresponding increase in the neuronal response in addition to this enhancement of temporal contrast.
The degree of entrainment was measured for a total of 46 neurons from SI (Figure 3.6). Here, a greater percentage of entrainment is indicative of a smaller temporal window of response and suggests increased synchronization with the stimulus. Microelectrode recordings were obtained for a broad range of stimulus amplitudes from as low as 12.5 µm to high as 400 µm. In Figure 3.6, each black line represents the degree of entrainment versus stimulus amplitude relationship for 1 of the 46 neurons. The red line shows the average relationship across the entire sample population of cortical neurons. The results suggest that stronger amplitude enhances the temporal contrast of the cortical response.
Discussion
The results of this study are highly indicative of a strong relationship between stimulus amplitude and cortical temporal contrast. Each method of analysis (PSTH, cycle raster plot, and degree of entrainment) indicated an augmented temporal contrast among neighboring cortical ensembles after an increase in amplitude of the applied periodic vibrotactile stimulus. For the entire range of amplitudes studied (15 µm – 400 µm) the evoked response in SI was well entrained with the externally applied vibrotactile stimulus; however, stronger amplitude stimuli also produced a sharper, narrower temporal window of response.
One reason for tuning the cortical response into similar patterns of spatial and temporal behavior may be to enhance the differences in cortical activity between the two responding regions in order to improve tactile perception. The same concept can be applied to daily visual situations. For a comparison, consider the two options in Figure 3.7. If someone were to ask you to choose between these two options and indicate which one is easier to read, “Option B” should be the obvious choice.
Figure 3.7 Visual contrast. Visual example of how contrast can improve perception.
cortex can turn messy vibrotactile input (“Option A” – response from weaker stimulus amplitudes) into a clearer perceptional image (“Option B” – response from stronger stimulus amplitudes). Similar to this visual scenario, we expect two prominent and narrow peaks of cortical activity (“Option B”) to be less difficult for the brain to distinguish in comparison to two weaker but broader peaks in spike activity (“Option A”). In other words, this increase in synchronization (temporal contrast) should improve tactile perception since increasing cortical contrast should enhance our perceived tactile image. This enhancement of temporal cortical contrast may be especially beneficial in a tactile task such as frequency discrimination. Theoretically, frequencies should be easier to determine if the cortical response is organized into narrow, sharp channels of information.
3.2 Frequency discrimination capacity improves with stronger amplitudes
Modifications of the standard Human Experimental Procedure
Eighteen healthy subjects were recruited for the frequency discrimination portion of the study. Participants were college undergraduates ranging from 20 to 22 years of age. The consent and sensory assessment procedures as described in Chapter 2 Methods were followed.
Frequency discrimination assessment
The minimal frequency difference between two mechanical sinusoidal vibratory stimuli from which an individual can still successfully identify the higher frequency stimulus constitutes one’s frequency discriminative capacity. For the frequency discrimination assessment, the stimulator delivered sequential vibrotactile stimuli to D2 and D3 of the left hand. This protocol requested subjects to indicate which of their two fingers received the high frequency stimulus (Figure 3.8).
Frequency discrimination capacity was measured with a 2AFC tracking protocol (refer to Tracking Paradigm in Methods of Chapter 2) and acquired at multiple frequency standards/tests and numerous amplitudes (Table 3.1) to measure for potential improvements in frequency discrimination at stronger stimulus amplitudes.
Table 3.1 Frequency discrimination protocol at different amplitudes
Standard Frequency Test Frequency Amplitudes
10 Hz 20 Hz 25 µm, 50 µm, 100 µm, 200 µm, 400 µm 30 Hz 40 Hz 25 µm, 50 µm, 100 µm, 200 µm, 400 µm
Exemplary Frequency Discrimination test: 30 Hz standard versus 40 Hz test at 200 µm
While the standard stimulus was maintained at a frequency of 30 Hz, the test stimulus started at 40 Hz and had the potential to track down by 1 Hz. The frequency of the test stimulus was always greater than that of the standard stimulus and the stimulus amplitude remained at 200 µm (for both the standard and test stimuli) for the duration of assessment. The locations of the stimuli (D2 versus D3) were randomly selected on a trial-by-trial basis.
Data analysis was consistent with our standard methods for human experimentation as indicated in Chapter 2 Methods.
Results
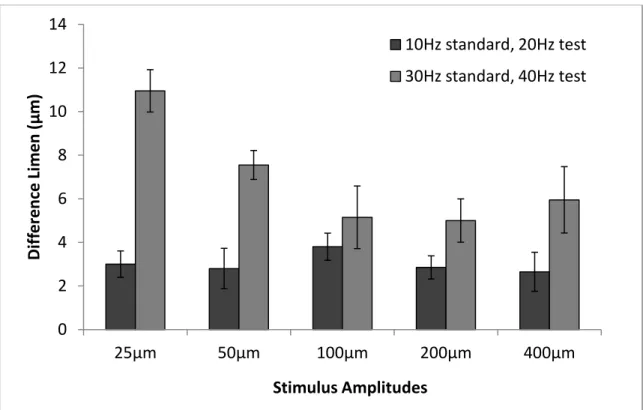
among the various stimulus amplitudes (25 µm, 50 µm, 100 µm, 200 µm, and 400 µm). However, as evident by the lower difference limens (DL), there was a noticeable improvement in the 30 Hz standard, 40 Hz test frequency discrimination assessment as the stimulus amplitude was increased from 25 µm or 50 µm. Specifically for the higher range frequency discrimination assessment (30 Hz standard, 40 Hz test), performance at the 25 µm was significantly worse than performance at 50 µm (*p=0.034), 100 µm (*p=0.020), 200 µm (*p=0.005), and 400 µm (*p=0.039). Although the preliminary sample population was too small to draw many conclusions, the results do suggest a possible saturation of frequency discrimination performance at amplitudes above 100 µm.
Figure 3.9 Preliminary frequency discrimination testing at various amplitudes. Insignificant differences on the 10 Hz standard, 20 Hz test among the different stimulus amplitudes. However, performance on the 30 Hz standard, 40 Hz test at 25 µm was significantly worse than performance at 50 µm (*p=0.034), 100 µm (*p=0.020), 200 µm (*p=0.005), and 400 µm (*p=0.039).
0 2 4 6 8 10 12 14
25µm 50µm 100µm 200µm 400µm
Di ff e re n ce Li m e n (µ m ) Stimulus Amplitudes
10Hz standard, 20Hz test
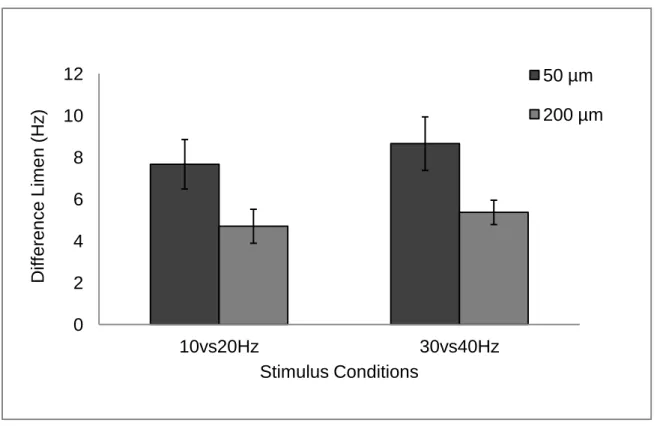
We then recruited 14 new subjects and compared their frequency discrimination capacity at 50 µm to their performance at 200 µm (Figure 3.10). The performance for both frequency discrimination assessments (10 Hz and 30 Hz standard) exhibited visibly decreased difference limens (DL). Although this slight reduction in DL does not indicate a significant improvement on the frequency discrimination task (p=0.18 for 10 Hz standard, p=0.098 for 30 Hz standard), this slight improvement is still important for our interpretations of cortical contrast. We believe with a larger sample population, the values would become significant.
Figure 3.10 Frequency difference limens at various amplitudes. The performance for both the 10 Hz and 30 Hz (standard) frequency assessments demonstrated visibly improved performance at stronger stimulus amplitudes.
0 2 4 6 8 10 12
10vs20Hz 30vs40Hz
Discussion
The findings from our study in non-human primates (Section 3.1, Increased amplitude improves temporal contrast) demonstrated that increases in stimulus amplitude are associated with increases in synchronization. We hypothesized that this increase in temporal contrast should improve tactile perception by enhancing the information of higher perceptual importance. We then tested this hypothesis by comparing frequency discrimination performance at a range of stimulus amplitudes. Our results here indicate that frequency discrimination capacity does improve with greater stimulus amplitudes for frequencies discrimination tasks below and above 25 Hz.
These findings of improved frequency discrimination capacity at greater stimulus amplitudes are also consistent with previous reports of optic intrinsic signal (OIS) imaging in non-human primates, which demonstrated that an increase in stimulus amplitude (within the same range of amplitudes studied 50 µm - 400 µm) was followed by an increase of absorbance within the central responding region of SI cortex (Simons et al. 2005). However, as the absorbance within the central ~2 mm diameter cortical region increased, the surrounding ~ 1 mm of SI experienced a prominent decrease in absorbance. In other words, as the stimulus amplitude increased, the spatial contrast of the activated region of cortex became more prominent. This enhanced spatial contrast at the stronger stimulus amplitudes appears to be reflected by an increased frequency discrimination capacity at greater magnitudes of stimulation.
among the centrally located and responding excitatory cortical neurons may correspond with the enhanced spatial contrast observed at the higher stimulus amplitudes. If this is true, the weak cortical dependency on utilizing MFR to encode stimulus frequency at frequencies above 25 Hz leads us to expect minimal changes to amplitude discrimination capacity at greater stimulus frequencies (Ahissar and Arieli, 2001; Ferrington and Rowe 1980; Hummel and Gerloff , 2006; LaMotte and Mountcastle, 1975; Mountcastle et al., 1969, 1990; Panzeri et al., 2003; Recanzone et al., 1992; Romo et al., 2003; Whitsel et al., 2001). Increasing the frequency of the applied vibrotactile stimulus should evoke a minimal increase in MFR within the responding region of SI, thus there is negligible enhancement of spatial contrast and theoretically only minor improvements would be observed for amplitude discrimination at higher frequencies.
3.3 Amplitude discrimination capability is variably dependent on frequency
To test our hypothesis, we measured changes in amplitude discrimination capacity due to increases in stimulus frequency among a healthy population of subjects.
Modifications of the standard Human Experimental Procedure
For the amplitude discrimination portion of the study, we recruited thirty two healthy subjects and followed the standard consent and sensory assessment procedures from Chapter 2 Methods. Participants were primarily undergraduates (range 20-22 years old) or college graduates with a mean age of 27.7 + 6.3 years (range 21 – 42 years old).
Amplitude discrimination assessment
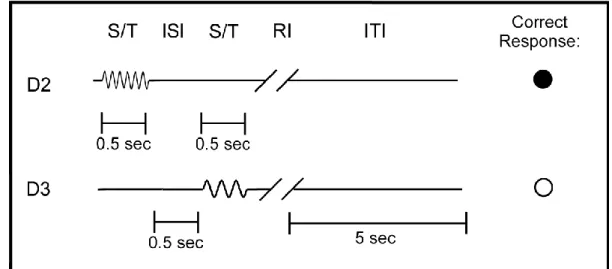
Figure 3.11 Amplitude discrimination procedure. After the standard and test stimuli (S/T) were simultaneously applied to D2 or D3 for 0.5 sec with a 0.5 sec inter-stimulus interval (ISI), the subject was provided with a short response interval (RI) to decide which digit received the stimulus of greater amplitude. After responding, the subject waited during a 5 sec inter-stimulus interval (ITI) before the next round of stimulation.
We measured amplitude discriminative capacity at multiple amplitude standards/tests and numerous frequencies (Table 3.2) to test for potential improvements in amplitude discrimination at higher frequencies. Our data analysis was consistent with the standard methods for human experimentation as previously described in Chapter 2 Methods.
Table 3.2 Amplitude discrimination protocol at different frequencies
Standard Amplitude Test Amplitude Frequencies
100 µm 200 µm 10 Hz, 20 Hz, 30 Hz, 40 Hz
200 µm 400 µm 10 Hz, 20 Hz, 30 Hz, 40 Hz
Figure 3.12 Amplitude discrimination capacity at various frequencies. A frequency increase from 10 Hz to 20 Hz slightly significantly improved amplitude discrimination capacity in the higher standard amplitude assessments (standards 200 µm, *p=0.013; 400 µm, *p=0.049). However, increasing the stimulus frequency from 30 Hz to 40 Hz did not alter amplitude discrimination capacity.
Results:
The full range of amplitude discrimination protocols were tested in 24 healthy subjects (Figure 3.12). For each of the standard amplitudes tested (100 µm, n=18; 200 µm, n=18; and 400 µm, n=6) standards) amplitude discrimination capacity was unaffected by increasing the stimulus frequency from 30 Hz to 40 Hz. Interestingly, as interpreted from a decrease in the difference limens, increasing the frequency from 10 Hz
0 50 100 150 200 250
0 10 20 30 40
Di ff e re n ce Li m e n (µ m )
Frequency of Simulation (Hz)
100 std, 200 test (µm)
200 std, 400 test (µm)
(to 20 Hz, 30 Hz, or 40Hz) did promote slight improvements in amplitude discrimination capacity. The improvements at frequencies above 10 Hz were more noticeable and significantly greater in the higher standard amplitude assessments (200 µm, or 400 µm standard) than the 100 µm standard assessment (*p=0.013, *p=0.049 respectively for the 200 µm, 400 µm standards versus p=0.41 for the 100 µm standard).
Figure 3.13 Weber fractions at various frequencies. A frequency increase from 10 Hz to 20 Hz slightly significantly improved amplitude discrimination capacity in the higher standard amplitude assessments (standards 200 µm, *p=0.013; 400 µm, *p=0.049). However, increasing the stimulus frequency from 30 Hz to 40 Hz did not alter amplitude discrimination capacity.
0.1 0.2 0.3 0.4 0.5 0.6 0.7
0 10 20 30 40
W
e
b
e
r
Fr
act
ion
Frequency of Stimulation (Hz)
100 std, 200 test (µm)
200 std, 400 test (µm)
Weber Fractions for these amplitude discriminatory assessments (difference limens divided by standard stimulus amplitude) were then calculated for this sample population of 24 healthy subjects (Figure 3.13) to provide a different perceptive to our results. Among the 3 standard amplitudes that were tested, we observe the same trends of perceptual performance as the frequency of stimulation is increased. Amplitude. discrimination capacity remained unaffected by a stimulus frequency increase from 30 Hz to 40 Hz; however, increasing the frequency from 10 Hz improved amplitude discrimination capacity. Since the Weber Fractions are the amplitude difference limens divided by a constant (100, 200, or 400 depending on the standard amplitude), statistical significance is the same as the previous analysis. The similarities in performance among the various amplitudes suggest our findings follow Weber’s Law.
14 new subjects were recruited for further analysis and their amplitude discrimination capacities at 10 Hz were compared to their performance at 40 Hz for a 200 µm standard, 400 µm test amplitude assessment (Figure 3.14). The difference limens (DL) were significantly lower in the 40 Hz condition in comparison to the 10 Hz stimulus frequency (*p=0.040, n=32) indicating significant improvement on the amplitude discrimination assessment. When analyzed on a subject by subject basis, the ratio of performance at 10 Hz over the performance at 40 Hz is 1.59 + 0.17, which further suggests that the average subject (not just the average of our sample population) experiences a drop in when the stimulus frequency is raised.
Figure 3.14 Amplitude discrimination capacity at 10 Hz versus 40 Hz. Amplitude discrimination capacity is significantly improved in the 40 Hz condition in comparison to the 10 Hz stimulus frequency (*p=0.040).
Discussion:
Our results are highly suggestive of a minimally dependent relationship of frequency on amplitude discriminatory performance for frequencies above 25 Hz. When the stimulus frequency was increased from 30 Hz to 40 Hz, amplitude discrimination capacity had not significantly improved for any of the 3 amplitude discrimination assessments that were studied (100 µm, 200 µm, and 400 µm standards). Since frequency has negligible dependency on MFR above 25 Hz, (LaMotte and Mountcastle, 1975; Mountcastle et al., 1969; Recanzone et al., 1992; Whitsel et al., 2001) changes in MFR would be minimal and MFR should fail to enhance spatial or temporal contrast to the same degree as demonstrated previously with increases in stimulus amplitude (Simons et al., 2005, previous section on 3.1 Increased amplitude improves temporal contrast). Thus, these findings support our hypothesis that contrast serves a crucial role in improving tactile perception. 0 20 40 60 80 100
10 Hz 40 Hz
Di ff e re n ce Li m e n (µ m )
Our data does suggest improved amplitude discrimination capacity when the frequency is increased from 10 Hz to 20 Hz, 30 Hz, or 40 Hz. Since frequency coding is dependent on MFR for frequencies below 25 Hz , (Ahissar and Arieli, 2001; Ferrington and Rowe 1980; Hummel and Gerloff , 2006; LaMotte and Mountcastle, 1975; Mountcastle et al., 1969, 1990; Panzeri et al., 2003; Recanzone et al., 1992; Romo et al., 2003; Whitsel et al., 2001) it is understood that an increase in frequency within the MFR dependent frequency range would elicit a corresponding increase in MFR. Therefore, when increasing the frequency from 10 Hz to the other frequencies studied, we believe spatial and temporal cortical contrast would be enhanced from this increase in MFR. As a result, this augmented contrast should lead to the enhanced amplitude discriminatory performance observed at the higher frequencies in comparison to the tactile perceptual capabilities at 10 Hz. Finally, our results are consistent with previous reports indicating that amplitude discrimination follows Weber’s Law (Franciso et al., 2008; Holden et al., 2011).
CHAPTER 4
DURATION EFFECTS ON CORTICAL ACTIVITY AND PERCEPTUAL PERFORMANCE
4.1 Increased spatial and temporal contrast with extended stimulus durations
Our previous findings demonstrated how an increase in stimulus amplitude could lead to improved temporal and spatial cortical contrast as well as prove an improved frequency or amplitude discrimination capacity. Published reports of OIS indicate that longer durations of vibrotactile stimulation can elicit similar improvements in spatial cortical contrast (Simons et al., 2007). Since enhanced temporal contrast corresponded with improved spatial contrast in our stimulus amplitude studies, for extended stimulus durations we would also expect an enhanced temporal contrast to correspond with the improved spatial contrast observed in previous OIS studies. To test this hypothesis, the cortical response to various durations of vibrotactile stimulation on the hand of a pigtail monkey was recorded with microelectrodes. The stimulus frequency and amplitudes remained constant during the course of each experiment.
Modifications of the standard Animal Experimental Procedure
and 2 cats. A total of 77 cortical neurons were compared using MFR, PSTH, PCA, raster plot, and CCG analysis.
Results
Increased spatial contrast with extended stimulus durations
For the first exemplary experiment, one microelectrode penetration transversed and sampled the response to 1 sec of 300 µm, 25 Hz vibrotactile stimulation on the tip of digit 3 (D3) of a pigtail monkey. While the stimulus location was not moved during the course of this penetration, we shifted the microelectrode recording position from three marginal, to five central, and then back to three marginal locations as the penetration depth was increased (Figure 4.1a). A total of 11 SI neurons were analyzed from this single microelectrode penetration. The MFRs for this sample population of cortical neurons can be observed in Figure 4.1a. The red line indicates the level of baseline spike activity prior to vibrotactile stimulation. For all 11 cortical neurons, vibrotactile stimulation evoked an initially positive response above baseline levels of cortical activity. However, as the applied stimulation continued, the magnitude of stimulus evoked activity for each cortical neuron experienced a slow but relatively continuous decline.
neurons, we found this ratio declines over time (Figure 4.1c). In other words, this decrease in MFR over extended stimulus durations is more drastic for the marginal neurons (Figure 4.1c).
Increased temporal contrast with extended stimulus durations
We then analyzed the temporal response of this 11 neuron sample population in relation to the phase of the applied 25 Hz mechanical stimulation. Figure 4.2a compares the spike activity from the start of vibrotactile stimulation (first 4 cycles or 0-160 msec) to the response around 1 sec of stimulation (cycles 22-25 or 880-1000 msec). Although the population response initially had a prominent biphasic nature, spike activity became increasingly monophasic after further stimulation. Importantly, following just 1 sec of continuous stimulation, the cortical response of this neuronal population was already noticeably coherent and well entrained to the stimulus frequency.
PCA analysis of the phase changes that evolved during this temporal enhancement indicate a clear differentiation in the cycle histogram for each neuron from early (red: first 160 msec) to late (blue: 880-1000 msec) vibrotactile stimulation (Figure 4.2b). Although the slightly scattered pattern of dots in the PCA analysis suggests the phase of each neuron is somewhat variable, the clustering of red and blue points indicates that the phase changes developing upon continuous mechanical stimulation occur together as a population. Furthermore, the tighter clustering between later phases (blue) in comparison to the early phases (red) suggests that the population response developed into phases which became increasingly similar over time.
Figure 4.2 Exemplary SI population. Temporal response for a population of 11 cortical neurons in relation to the phase of 25 Hz vibrotactile stimulation. A) PSTHs comparing early (0-160 msec) to late (880-1000 msec) vibrotactile stimulation. B) PCA demonstrating how the population’s phase shifts during early (red) to late (blue) vibrotactile stimulation. C) CCG indicating how the average correlation among the cortical response is stronger during late (blue) versus early (red) vibrotactile stimulation.
the gradual shift in phase characteristics over time (red-initial, blue-final) as this exemplary neuron slowly develops an enhanced temporal response.
Figure 4.3 Exemplary neuron. Temporal response for an exemplary neuron in relation to the phase of 25 Hz vibrotactile stimulation. A) Cycle raster plot of the cortical activity demonstrating how a biphasic response evolves into a monophasic response. B) PCA analysis indicating how the phase of the cortical response shifts from the start of stimulation (red) during 1 sec of vibrotactile stimulation (blue - final).
880-1000 msec). Although, this initial response for particular population of neurons had already started off monophasic in nature, following extended stimulation the spike activity still evolved into a sharper, narrower monophasic response.
Figure 4.4 Second exemplary SI population. PSTHs comparing early (0-160 msec) to late (880-1000 msec) vibrotactile stimulation.
Discussion
than their marginal counterparts. Furthermore, we found extreme degrees of temporal contrast enhancement. After only 0.5 sec of continuous 25 Hz stimulation, a population of biphasic neurons developed a prominent monophasic nature. Over a similar time course, a separate population of neurons evolved from a relatively broad monophasic response into a sharp and narrow monophasic response.
We believe this enhancement of contrast during longer continuous vibrotactile stimulation should be reflected in tactile perception. Our previous findings coupled enhanced spatial and temporal contrast from stronger stimulus amplitudes with improved frequency discrimination capability at greater stimulus amplitudes. Previously, we believed the enhanced contrast should provide a clearer perceptual picture and thus improve a person’s perceptual capabilities. This evidence of improved spatial and temporal contrast with longer stimulus durations encourages us to verify corresponding improvements in tactile perception for a task such as amplitude discrimination at extended stimulus durations.
4.2 Amplitude discrimination capability unaffected by extended stimulus durations
improved amplitude discrimination capacity. To explore this hypothesis, we compared measured changes in amplitude discrimination capacity to a change in stimulus duration.
Modifications of the standard Human Experimental Procedure
There were 55 healthy recruits for this amplitude discrimination portion of our study. Participants were college students ranging from 20-25 years of age. We followed the standard consent and sensory assessment procedures as described in Chapter 2: Methods.
Figure 4.5 Modified amplitude discrimination procedure. Subjects indicated which finger received the greater amplitude stimulus during a brief response interval (RI). The applied stimulus was either 120 msec or 600 msec (S/T) in duration. As in the previous amplitude and frequency discrimination assessments, the inter-stimulus interval (ITI) was 5 sec in duration.
Amplitude discrimination assessment
of the left hand, the subject’s amplitude discriminative capacity was measured using a 2AFC tracking protocol (refer to Figure 4.5 and Tracking Paradigm of Chapter 2 Methods). As before, we acquired amplitude discriminative capacity at 200 µm standard and 400 µm test amplitudes; however, the duration of the stimulus was now variable between 120 msec and 600 msec (S/T) to measure potential improvements in amplitude discrimination capacity at longer stimulus durations (Table 4.1). As in the previous amplitude and frequency discrimination assessments, the inter-stimulus interval (ITI) was 5 sec in duration.
We adhered to the standard methods for human experimentation as previously explained in Chapter 2 Methods for the data analysis.
Table 4.1 Amplitude discrimination protocol at different durations
Standard Amplitude Test Amplitude S/T Durations
200 µm 400 µm 120 msec, 600 msec
Results
experience a slight drop in DL for the longer duration assessment even if the overall average of our sample population had not.
Figure 4.6 Amplitude discrimination capacity at various durations. Amplitude discrimination capacity is not significantly improved in the 600 msec condition in comparison to the 120 msec stimulus duration (p=0.27).
Discussion
The purpose of this portion of our research was to connect our previous findings of enhanced spatial and temporal contrast from longer stimulus durations to evidence of improved tactile perception capabilities under similar stimulus conditions. Our findings suggest the cortical dynamics of extended stimulus durations are more complex than our initial predictions. Amplitude discrimination capacity hardly improved during the 600 msec duration stimulus in comparison to the 120 msec stimulation. The enhancement of spatial and temporal contrast during longer vibrotactile stimulation as demonstrated in our previous research is not visibly replicated in this tactile perception task.
0 10 20 30 40 50 60 70 80 90 100
120 msec 600 msec
There are two possible reasons for these results. Perhaps improved spatial or temporal cortical contrast (as observed with the stronger stimulus amplitude conditions) does not necessarily lead to improved tactile perception. Although it is possible that the enhanced cortical contrast with the longer stimulus durations may not necessarily affect tactile perception, we believe another cortical mechanism may be instead taking precedence over the local synchronization and spatial contrast and more strongly impacting tactile perception.
CHAPTER 5
SPATIALLY DISTINCT CORTICAL REGIONS COMMUNICATE DURING TACTILE PERCEPTION
5.1 Synchronization across spatially distinct cortical regions
Previously our studies only addressed how vibrotactile stimulation can increase local synchronization within local cortical regions. However, for normal daily function, the human brain must simultaneously process and integrate information from multiple sensory projections. With this in mind, we hypothesize that vibrotactile stimulation may be able to facilitate synchronization across spatially distinct cortical regions. To test the hypothesis, we will apply simultaneous vibrotactile stimulation to two digits of a squirrel monkey and record the cortical response in hopes of monitoring possible synchronization among distant cortical regions.
Modifications of the standard Animal Experimental Procedure
can be observed in Figure 5.1. Analysis consisted of peri-stimulus time histograms (PSTH).
Figure 5.2 Exemplary experiment. The cortical response to D2 and D3 vibrotactile stimulation. Delivering a mechanical pulse to D2 evoked a prominent response in the cortical region of D2 both with and without preconditioning synchronized vibrotactile stimulation (left quadrant). Vibrotactile stimulation also appears to have inhibitory effects on the baseline levels of cortical activity (top versus bottom half).
Results:
pulse on D2 now evokes a response in the corresponding cortical regions of both D2 and D3. Furthermore, when comparing baseline levels of activity prior to pulse stimulation (the cortical response prior to 0 msec), vibrotactile conditioning (bottom of Figure 5.2) appears to inhibit the cortical response that can otherwise be observed without prior stimulation (top of Figure 5.2).
Figure 5.3 Second exemplary experiment. The cortical response to D2 and D3 vibrotactile stimulation. Delivering a mechanical pulse to D2 evoked a prominent response in the cortical region of D2 both with and without preconditioning synchronized vibrotactile stimulation (left quadrant). Vibrotactile stimulation also appears to have inhibitory effects on the baseline levels of cortical activity (top versus bottom half).
however, no such changes were observed in D2 cortical activity when the same simple mechanical pulse was applied to D3 (Figure 5.3b). Alternatively, when synchronized sinusoidal mechanical stimulation was simultaneously applied to both D2 and D3 prior to pulse delivery (Figure 5.3 c-d), the pulse on D3 now evokes a response in the corresponding cortical region of D2 (Figure 5.3d). Perhaps due to initially weak baseline levels of activity prior to pulse stimulation, potential inhibition due to vibrotactile conditioning is not as obvious as in the previous exemplary experiment.
Discussion
Although our previous studies only demonstrated how local synchronization could occur within local cortical ensembles, the results of this study demonstrate how a preconditioning vibrotactile stimulus can promote two otherwise separate cortical projections (D2 and D3) to respond together. While vibrotactile stimulation can locally enhance spatial and temporal contrast, it also appears to improve overall cortical networkability. Perhaps this improved processing of sensory information between “separate” cortical regions from vibrotactile stimulation makes it difficult to perceive the two digits separately. As a result, this could explain the minimal improvement in amplitude discrimination capacity that was demonstrated with longer stimulus durations.
significantly lower temporal order judgment capacity. Judging from these cortical observations, if we were to recruit human subjects and deliver preconditioning vibrotactile stimulation to D2 and D3 prior to a simple mechanical pulse on just D2, we would expect subjects to elicit a strong cortical response in the corresponding region of D2 and also a weak response in the region representing D3. As their cortical projections respond together, the digits may become rather indistinguishable from each other. In other words, the subjects could feel as though both digits are being simultaneously stimulated. Following similar preconditioning vibrotactile stimulation of D2 and D3, if we were to deliver a mechanical pulse first to D2 followed by a pulse on D3, we would expect the respective cortical regions to each respond to both pulses. Thus, it should be more difficult for the subjects to distinguish which mechanical pulse occurred first since it may feel as though both digits were stimulated twice. Our next task was to then test our hypothesis of decreased temporal order judgment (TOJ) from preconditioning vibrotactile stimulation.
5.2 TOJ capacity diminishes with preconditioning vibrotactile stimulation
performance in the TOJ assessment. We measured the temporal order judgment capabilities in a healthy sample population in the presence of preconditioning vibrotactile stimulation. A range of amplitudes were used for the conditioning stimulation in order to elicit a range of contrast enhancement within the responding region of SI.
Modifications of the standard Human Experimental Procedure
We recruited eighteen healthy subjects to participate in the temporal order judgment (TOJ) portion of our study. Although the mean age was 25.5 + 2.9 years, the participant age ranged from 21 to 31 years. Standard consent and sensory assessment procedures were followed as previously explained in Chapter 2: Methods.
Temporal order judgment assessment
100 µm. Similar procedures for TOJ have been utilized in previous literature (Tommerdahl et al., 2007b, 2008).
The standard methods for human experimentation as previously described in Chapter 2 Methods for data analysis were utilized for this portion of the study.
Results
As the conditioning stimulus was increased from 0 µm to 100 µm, there was a prominent increase in the minimal interstimulus interval necessary for successful temporal order judgment (TOJ) (Figures 5.5 and 5.6). Based on the slope of the fitted tread line (red line Figure 5.5), an amplitude increase by 1 µm corresponded with a 0.61 msec increase in TOJ interstimulus interval (R2 = 0.96). Using the zero amplitude conditioning stimulus as a reference point, only a slight increase of interstimulus interval was evident for the 10 µm (p=0.23) condition. However, increasing the stimulus amplitude to 20 µm or higher produced a significant increase of interstimulus interval (*p= 0.013, 0.0022, 0.014, <0.001, <0.001 respectively.)
Figure 5.5 Temporal order judgment capacity at various conditioning amplitudes. Reduction of TOJ capacity from the average baseline difference limen with increasing amplitudes of conditioning vibrotactile stimulation.
0 20 40 60 80 100 120
0 10 20 40 60 80 100
In te rsti m u lu s In te rv al ( m sec )
Figure 5.6 Linear fit temporal order judgment capacity. A linear fit of the reduction of TOJ capacity from the average baseline difference limen with increasing amplitudes of conditioning vibrotactile stimulation.
Figure 5.7 Normalized temporal order judgment capacity. An average subject by subject reduction in TOJ capacity when compared to the baseline (no conditioning stimulation) assessment.
y = 0.6092x + 31.477 R² = 0.9593
0 20 40 60 80 100 120
-10 0 10 20 30 40 50 60 70 80 90 100
In te rsti m u lu s In te rv al ( m sec )
Conditioning Amplitude (µm)
0 0.5 1 1.5 2 2.5 3 3.5 4 4.5
-5 15 35 55 75 95
N o rm al ize d In te rsti m u lu s In te rv al
When normalized on a subject by subject basis to the zero amplitude conditioning stimulus condition (unity in Figure 5.7), we again observe an increased interstimulus interval with stronger conditioning amplitudes. In comparison to unity, the full range of conditioning amplitudes tested (10 µm, 20 µm, 40 µm, 60 µm, 80 µm and 100 µm) have a significantly greater interstimulus interval (*p=0.022, 0.035, 0.0071, 0.015, 0.0029, <0.001 respectively). This suggests our results are true for both the average of our population as well as on the level of each individual.
Discussion
Despite the presence of two digits providing enhanced cortical contrast and local synchronization with a greater amplitude stimulus, increased networkability between the two separate cortical ensembles from vibrotactile conditioning appears to lower TOJ capacity. Furthermore, the results indicate that stronger stimulus amplitudes lead to greater reductions in TOJ capability. This suggests that higher stimulus amplitudes produce an even stronger cortical networkability making longer interstimulus intervals necessary in the TOJ assessment.
5.3 Bilateral stimulation suggests communication across cortical hemispheres
stimulation (Tommerdahl et al., 2005a, 2006; Reed et al., 2011). Hypothesizing from our preceding reports of enhanced cortical contrast improving tactile perception, we would expect this reduction of cortical response to lead to diminished tactile capabilities. In corresponding perceptual literature, reports support our hypothesis and have indicated that tactile sensory perception is degraded with stimuli to the body site contralateral to the test. For instance, detection thresholds are increased when an interference stimulus is located at a homologous across hemisphere skin site (Levin and Benton, 1973), localization of tactile stimuli on the digits is influenced by stimulus delivery on the opposite hand (Braun et al., 2005), spatial acuity on one hand decreases when stimuli are delivered to the opposite hand (Tannan et al., 2005), and delivering stimuli on the opposite hand also interferes with frequency discrimination (Harris et al., 2001). There also exists a striking correlation among previous literature where, under similar stimulus conditions, SI cortical activity evoked by bilateral stimulation is ~30% less than the activity evoked by the contralateral condition (Tommerdahl et al., 2005a, b; 2006) and the percept of spatial acuity is respectively decreased by approximately the same amount in the bilateral versus contralateral stimulus condition (Tannan et al., 2005). Based on the previously-mentioned reports in which interference stimuli degraded some aspect of sensory perceptual performance across the body mid-line, we sought to test the hypothesis that amplitude discriminative capacity of an attended hand would degrade when simultaneously delivering stimuli to the unattended hand.
was delivered to the unattended hand. The higher frequency condition of 200 Hz differentially activates the SI cortex (Tommerdahl et al, 1999a, b, 2005a; Whitsel et al, 2001) where amplitude discrimination is proposed to take place (Simons et al, 2005; Francisco et al 2008). However, this is not a clear indication that the 200 Hz condition would have a dissimilar impact task performance when compared to the 25 Hz condition. If performance modifications are comparable, and if both the 200 Hz and 25 Hz stimuli on the unattended hand does have an impact on performance, then the difference in performance could be attributed to the same mechanism where cross-hemisphere connectivity degrades cortical contrast.
performance on the task? We believe specificity may overcome the typical perceptual changes observed with modifying cortical contrast.
Modifications of the standard Human Experimental Procedure
Thirty-eight healthy subjects were recruited for the bilateral portion of the research. Participants ranged from 20 to 66 years of age (mean=32.4, standard deviation=14.1). Although the participant age is rather diverse, it should not affect the results of our current study. Previous reports indicate that although reaction speed and sensory thresholds may change with age, discriminative capacity and adaptation metrics remain unchanged (Zhang et al., 2011b). The consent, sensory assessment procedures, and analysis as described in Chapter 2 Methods were followed.
Figure 5.8 Bilateral modifications to stimulator placement. So that the bilateral conditions could stimulate both hands simultaneously, the device cabling was modified so to use two stimulators. Left: CM-4 Stimulator. Right: Overhead view of left and right hands positioned on two head units for the bilateral protocols.
Bilateral sensory assessment