Pressure Points: Economic and Political Influence on EPA Enforcement Decisions
Logan Judy
A Thesis submitted to the faculty of the University of
North Carolina in partial fulfillment of the requirements of a degree with
Honors in Political
Abstract
Environmental legislation in the United States is intended to serve the public interest by shielding the environment from the byproducts of
Introduction
Towards the latter half of the twentieth century, environmental policies and issues rose to prominence in mainstream American politics. With the advent of environmental legislation and regulation firms were forced to be more responsible in terms of emissions and pollution in order to yield higher net benefits for society while minimizing detrimental societal costs. The passage of environmental legislation was only the first step in a lengthy regulation process. Indeed, the passage of legislation was the quickest step in the process—once environmental laws were passed was when the strenuous task of environmental enforcement was left to the executive branch of the United States government.
The Environmental Protection Agency (EPA), since its creation in 1970, has served as the chief federal enforcement body for environmental legislation and regulations. The EPA, like any federal agency, has discretion in which cases that it chooses to pursue. While there are codified environmental standards that respective firms must adhere to, the respective sanctioning regime is not automatic in its sanction prescription. The EPA selects which cases to pursue for formal
sanctioning and which to settle with an informal enforcement: such as a written warning. If the agency had no discretion over when to enforce or what type of enforcement action to use, then the story of EPA enforcement would be a
understand what the driving forces are behind discretionary enforcement in order to determine if a publicly funded agency is accountable to the voice of the people, as best represented in laws passed by Congress by popularly elected representatives.
As environmental issues came to the forefront of political debate in the 1960s and 1970s, opposition to new environmental standards emerged from key stakeholders. The fundamental disagreement arose over the tradeoff between environmental protection and firm profit and efficiency. Corporations that rely on production or extraction, whether embodied in textiles, oil drilling, mining, etc., will naturally be large stakeholders when it comes to EPA regulations that provide environmental standards that may reduce production or hurt a firm’s bottom line. Regulations enforced by the EPA may very well clean up the environment, but often times do so by sacrificing economic prosperity manifested in lost firm profit or the loss of jobs. Regions that rely on emitting industry for economic livelihood are placed in a gauntlet of decision making—forced to compromise between economic prosperity and the preservation of the environment, both of which are salient issues to any region or community.
agency to formally enforce every regulation for each violation that is brought under their jurisdiction. The question thus arises: why does the EPA, a federal agency with some level of enforcement discretion, choose to formally enforce regulations in certain areas while not in others?
In order to examine EPA enforcement behavior, I will analyze enforcement data along with the local characteristics of the congressional district in which each respective firm in violation of EPA standards is located. This analysis will reveal what characteristics are significant indicators of EPA formal enforcement as well as which are indicators of informal enforcement. In addition, in order to determine why formal enforcement is sought against violators in some cases and not in others, I will examine how the trends in enforcement have changed over time as political and economic shifts happen on a macro level.
My method consists of compiling data and characteristics into an ordered probit regression model to predict which factors are significant indicators of EPA formality in enforcement. In addition I will use linear regression to examine the relationship between EPA budget and overall enforcement action.
Literature Review
EPA oversight, while a relatively new phenomenon to the study of political science, is one that is extensively examined. Environmental protection is an
increasingly salient issue to the United States in the twenty first century.
between 1970 (the creation of the EPA) and 1990, the analysis was conducted taking the costs incurred by firms that were under EPA scrutiny The sample of cases is drawn from The Wall Street Journal Index, extracting any mention of the EPA and US corporations (Bosch et al 1998, 168). The analysis specifically focuses on the cost and benefits of affected firms when dealing with the EPA by breaking the firms into four subgroups: targeted firms, losers, winners, and challengers (Bosch, Eckard, Lee 1998, 169). Cases are coded into the “targeted” category if the EPA investigated, cited, or charged a firm during the period.
“Losers” consist of firms that had to close or alter operations due to EPA citations,
firms that lost a legal battle to the EPA, or firms that chose to settle with the EPA. “Winners” are coded as such when the EPA either endorses a firm’s operations, or recants previous allegations of misconduct. The final category of “challengers”
contains those who chose to fight EPA rulings or enforcement actions (Bosch, Eckard, Lee 1998, 169).
surprising, is the returns for a firm that is deemed a “winner” are actually negative despite having won a battle with the EPA, although this result is statistically weak and not significant at the 10% level (Bosch et al, 171). These findings taken together suggest that firms receiving formal enforcement via the EPA pay real economic costs both from the EPA as well as from private investors who may lose confidence in a firm—suggesting the true economic power that the EPA holds over violating firms (Bosch et al 1998, 176).
Hunter and Waterman (1992) offer another perspective on EPA
enforcement on more of a theoretical level. They present two competing models for agency enforcement: the “enforced compliance model” and the “negotiated
compliance model”. The enforced compliance model assumes oversight that is
regionally in the United States. It is this consideration that led the EPA to
decentralizing oversight to state governments in 37 states (Hunter and Waterman 1992, 407-08).
In order to discern the enforcement structure of the EPA, the authors code EPA actions on a scale of 0-7 with 0-2 representing informal enforcement actions, 3-5 indicating unilateral EPA action, and the 6-7 range encompassing legal action against violators (Hunter and Waterman 1992, 410). Once the data is analyzed, 2 is the modal response of EPA enforcement, accounting for 40.2% of the total dataset. In addition, in only 7% of the cases was legal action taken against the violator (Hunter and Waterman 1992, 411). The modal response, 2, is indicative of the enforcement structure of the EPA. This level encompasses enforcement actions such as a warning letter, or an informal notice of violation, indicating that in most cases the EPA chooses a flexible punishment that is not a predetermined sanction on the violator, but rather varying depending on the case (Hunter and Waterman 1992, 411). The data was also broken up regionally in order to discern any sort of regional divergence in enforcement methods. The range of the mean value was noticeable: 4.24 being the highest average, contained in region 4, as well as 1.57 being the lowest recorded average for Region 1. This sort of regional variation suggests less of a systematic
guides my hypotheses to follow. In addition, Hunter and Waterman’s system of coding inspires my ordinal measure of EPA enforcement severity employed in my ordered probit model.
Deily and Gray (1991) examined the relationship between the EPA and the steel industry from 1977-1986. They hypothesized that the EPA would direct less enforcement activity toward plants that were in danger of closing, or plants that were located in areas where closing would harm employment levels and the economy. Using data on 49 steel plants and the areas surrounding them, their regression model produced results aligning closely with their hypotheses (Deily and Gray 1991, 261). They found conclusive evidence that enforcement behavior is influenced by the potential adjustment costs to local communities. Results showed that enforcement activity drops 6.5% for each 10 percentage point increase in the firm’s probability of closing (Deily and Gray, 269). This clearly shows that EPA enforcement activity is sensitive to the possibility of disrupting local economies. Deily and Gray found that the EPA allocates enforcement resources and attention in a way that minimizes adjustment costs in localities where violating plants are located (Deily and Gray, 271). My theory builds off of Deily and Gray’s argument, predicting a model of EPA enforcement that is responsive to the ebbs and flows of local economies.
causes of divergence in party politics since 1970, viewed through the lens of environmental political behavior. Their data consists of interest group ratings from the League of Conservation Voters, a non- profit, non-partisan group in order to determine each member of Congress’ views on environmental issues. The scores
range from 0 to 100, 0 being no support and 100 being full support for
environmental legislation (Shipan and Lowry 2001, 248). The dataset consists of 16,000 observations ranging from 1969-1999 for the Senate, 1970-1999 for the House (Shipan and Lowry 2001, 249). The authors note that they must control for inter-temporal changes and normalize through two parameters: a shift parameter as well as a stretch parameter they use 1980 as the base year, take the nominal score and subtract the shift parameter, the left-right shift needed to normalize, and then divide by the stretch parameter, the stretch or compression needed to normalize the data (Shipan and Lowry 2001, 249-50). The author’s main hypothesis is that the two major parties are diverging over time manifested in 6 sub-hypotheses:
H1: The higher the percentage of Democrats who are from the South, the
closer ideologically the party will be to the Republicans and therefore the
smaller the divergence in environmental voting scores.
H2: The more active the interest groups supporting factions with strong
views, the greater the divergence between party voting scores.
H3: When the salience of an issue increases, ideological factions are
more constrained, thus leading to reduced divergence between the two parties.
between the two parties on environmental voting.
H5: The more replacement in each term, the greater the divergence
between the two parties on environmental voting.
H6: When Ideological differences between members of different parties are
higher, divergence in voting on specific issues will be larger.
After multivariate analysis is complete, they find several key trends in the divergence of parties. In the House, broad ideological scores correlate with environmental voting. When salience increases, voting in the House converges between the two respective parties (p<.05). The higher number of freshmen, the more divergence in both chambers of Congress(p<.05). In the Senate, four out of six variables are significant. The lower percent of southerners in Democratic party, the wider the convergence. The stronger presence of interest groups, the wider the divergence. As well as in the Senate, when there is higher inflation, there is less divergence. When regressed for ideology, there are similar results with interest group activity positive and significant in both chambers (Shipan and Lowry 2001, 258-259).
model regarding EPA enforcement. Their key finding that the EPA allocates enforcement decisions so as to minimize adjustment costs to firms is a crucial tenet of my own theory of enforcement; my theory is centered around the concept of EPA sensitivity to economic conditions in the allocation of enforcement actions. I hope to expand upon their findings to capture a more complete picture of EPA enforcement that takes into account budgetary, economic, as well as political factors.
There is a plethora of research and analysis conducted on the mechanisms present within the EPA. There is however a lapse in research on the influence of local characteristics on EPA enforcement. In general, only the opposite
relationship is explored—how EPA sanctions and punishment affect firms and localities. I am more interested in how the EPA caters its enforcement efforts around the state of local economies and politics—either to avoid upsetting the economy, or to avoid a legal battle.
Theory
each of the respective 435 congressional districts, with my hypotheses listed at the end of the theory section.
My theory posits that the EPA will systematically choose to implement less severe EPA enforcement actions in areas where such an action could destabilize the economy. This is supported by the “negotiated compliance model” of enforcement which assumes a world of agency enforcement in which agencies have some degree of discretion over enforcement actions, meaning that the sanctions for a violation are not pre-prescribed and subject to discretion based on a variety of factors (Hunter and Waterman 1992). Upon observation, I presume that the EPA is not a neutral third party enforcement body, but rather an agency that is susceptible to outside political pressures, the same political pressures generally associated with the executive branch and Congress.
While environmental protection is the primary aim of EPA enforcement, I propose that the issues of employment and economic health in a locality will play a significant role in the decision making process of the EPA. I propose that the EPA, while traditionally viewed as devoted solely to environmental enforcement, will be more lenient to firms when congressional districts are experiencing high
The aim of environmental legislation and enforcement is to provide for a cleaner environment through the use of varying standards, including emission standards for industrial firms. However, I propose that the EPA, as an extension of the executive branch, will naturally be inclined to weigh their enforcement
decision at least partly on the perceived outcome of enforcement. If violations occur when unemployment is high and wages are low within a respective district, I posit that the EPA will be more likely to employ informal enforcement rather than more severe formal or judicial proceedings to prevent further injury to a weakened economy.
I theorize that during the time period 2000-2015, increasing EPA strength can be traced through the size of the EPA budget, as well as through the overall frequency of enforcement actions. My theory predicts that as the EPA
enforcement budget rises, so will overall enforcement, since a larger budget will expand institutional capacity to employ enforcement. In addition, I predict that a rise in average LCV in the House will be associated with a rise in EPA
enforcement budget.
this trend further, I also hypothesize that the prominence and position of each member within Congress will also affect EPA enforcement decisions— as the EPA would be more sensitive to their most powerful opponents in Congress. I plan to trace this by incorporating the number of terms served in my ordered probit model with the aim of capturing prominence and influence in Congress as a function of the number of terms served.
Congress, which holds the “power of the purse”, has the ability to constrict the EPA budget in an effort to limit more formal enforcement actions if legislators feel that their home districts are systematically harmed by EPA actions. Congress, through the power of appropriations can threaten to slash EPA operations, which is more likely when members of Congress feel that their respective district is being targeted by the EPA. Therefore, the EPA has an interest in appealing somewhat to the sentiments of legislators from industrial-friendly districts in order to prevent their administrative activities from being restrained by Congress. In addition, I argue that industry-friendly legislators are less likely to favor any legislative agenda that strengthens the EPA’s enforcement model since in doing so, it would jeopardize the economic and political interests of these legislators who align themselves with pro-industrial interests.
My overall theory is tied to the idea that League of Conservation Scorecards, which are compiled annually, can be used as a valuable and
an indicator of that member’s ideology as well as the collective attitude of the
constituents represented by that member, since a representative is namely that—a representative of the collective attitudes of his or hers constituency, particularly in the realm of environmental legislation.
Economic Characteristics Hypothesis: A weaker district economy, as indicated
by high unemployment and low median income levels, will receive EPA enforcement that is less strict, as the EPA is less likely to punish firms harshly during economic downturns.
Budgetary Hypothesis: There is a positive relationship between the EPA
enforcement budget and the total number of enforcement actions per year, as expenditures increase so should enforcement activity. Associated with a rise in EPA enforcement budget should be a pro- environmental trend in the House of Representatives, indicated by a rise in average annual LCV score for the chamber.
Ideological Characteristics Hypothesis: Congressional districts with members
of Congress who are hostile to environmental legislation, as measured through the League of Conservation scorecard, will generally experience less severe EPA enforcement actions in their respective home districts.
Method
Information System (ICIS) due to the depth of information given for each case as
well as the facility information linked to this data through the Facility Registry
Service (FRS). The unique case number for each EPA violation in the FE&C-ICIS
matches the data in the FRS to provide a street address for a vast majority of
facilities which was used to place the facilities on a map in order to eventually tie
them to their respective congressional district in the particular year that the
violation was recorded.
In order to assign each violating firm to a congressional district, I used ArcGIS to plot the firms onto a map of the United States using information
provided in the FRS spreadsheets provided by the EPA’s enforcement compliance database: ECHO. I narrowed down the close to one million violations reported by the EPA since 1970 into approximately 26,000 cases encompassing the years 2010-2015.1
Since the FRS spreadsheets I used were consolidated from several different agencies, the pivotal fields that I required in order to obtain (x,y) coordinates for firm location were difficult to extrapolate for certain entries in the spreadsheet. Before I could begin geocoding, I cleaned the data and narrowed down the
variables listed to encompass only the case number, street address, city, state, and ZIP code for each entry. Once the data was “clean”, I put my condensed excel file into ArcGIS to match the firms by respective street address. Many of the street addresses for each entry were either incorrect, too vague, or simply blank, so after this process of plugging in 26,000 cases in to geocode, I was still left with some “unmatched” locations, but was able to retain over 90% of the cases for the period
1
2010-2015.
Once I obtained the precise location of each of the thousands of EPA violations for the period 2010-2015, I then began to gather and code data for the variables of interest in the categories of EPA, District, and congressional factors which were each coded by year.2
Variables
My dependent variable is the ordinal variable measuring the level of EPA enforcement employed in each case (Informal, Formal, Judicial which will be coded 0-2). This ordinal measure was adopted from the EPA, as each enforcement action in their database is categorized in this way. My explanatory variables are contained in three categories. First are variables associated with the EPA. The second category encompasses variables associated with district characteristics. The third category encompasses characteristics of Congress in each district.3 EPA
Variable Variable Type Variable Value
Year Interval 2010-2015
Region Nominal 1-10
Enforcement Type Ordinal 0-2
EPA Annual Budget Interval $ value
EPA Enforcement Budget Interval $ value
District Characteristics
Variable Variable Type Variable Value
Per Capita GDP Interval $ value
Unemployment Rate Interval %
District Ideology Interval % vote for Obama in
previous election
2 See Appendix A.
3
Congress
Variable Variable Type Variable Value
Member of Congress Party ID Dummy 1 Rep, 0 Dem
MoC Terms in Office Interval Positive Integer
MoC Environmental Rating (LCV)
Interval 0-100
I chose to use the ordinal enforcement measure employed by the EPA in my own analysis which yielded three categories: informal enforcement, formal enforcement, as well as judicial proceedings. Due to the ordinal measure of the dependent variable, an ordered probit model was employed to best capture the characteristics of the dataset. First, I modeled without any control variables for time effects or EPA region. In my next model, which is the one presented in this paper, I controlled for both changes in time (year) as well as variance across the 10 EPA regions—with my results yielding almost identical results suggesting the robustness of my model.
Results and Analysis
District Characteristics: Economic Factors
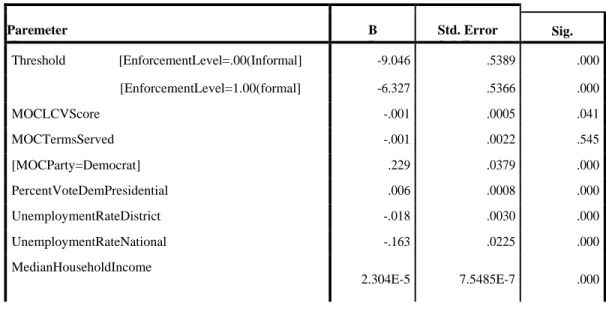
Overall, district characteristics prove to be the most consistent predictor of EPA enforcement activity. With regards to median income, there is a positive relationship between median district income and enforcement level that is
significant at the .000 level (see table 1). Thus when median income is higher, so is the likelihood of higher levels of enforcement—which is consistent with my theory surrounding EPA enforcement and economic conditions. When a district is
healthier in economic terms, as indicated by higher median household income, then formal environmental enforcement will be higher since there is likely less worry about formal enforcement actions harming an already healthy economy.
effects consistent with my first hypothesis:
Economic Characteristics Hypothesis: A weaker district economy, as
indicated by high unemployment and low median income levels, will receive EPA enforcement that is less strict, as the EPA is less likely to
punish firms harshly during economic downturns.
Overall, both of the major economic indicators per congressional district reveal a model of enforcement that is responsive to local economic conditions. The positive association between median income and enforcement level coupled with the negative association between unemployment rate and enforcement level suggests that local economic conditions are consistent and significant indicators of EPA activity. With the knowledge that enforcement could possibly harm the local economy, the EPA will be more likely to resort to more informal enforcement actions when the economy is in peril in order to ensure economic stability. This responsiveness of the EPA to economic conditions could be a utilitarian response with the simple goal of economic stability, or as my theory might suggest, it may be a political move to decrease hostility towards the EPA at the grassroots level but more importantly at the congressional level—where the actions of legislators directly influence the EPA’s jurisdiction and enforcement capacity.
District Characteristics: Ideological Factors
In addition to economic indicators, ideological characteristics of
association with the level of EPA enforcement (see table 1). Therefore, the higher the percentage of voters that chose Obama in the previous presidential election, the higher the likelihood of increased levels of EPA enforcement in any given district. This is consistent with my third hypothesis, as districts that are liberal ideologically will intuitively be linked to members of Congress with similar viewpoints—
resulting in pro-environmental legislators representing districts that receive more formal enforcement actions.
Ideological Characteristics Hypothesis: Congressional districts with
Members of Congress who are hostile to environmental legislation, as
measured through the League of Conservation scorecard, will generally experience less severe EPA enforcement actions in their respective home
districts.
Districts that are more liberal, as measured by Obama’s vote share in the previous
election, are more likely to have higher levels of enforcement while districts that are less liberal will, by the measure of vote share for Obama, receive less severe enforcement actions. This relationship is consistent with my theory that posits that districts with members of Congress who are more hostile to environmental
legislation will experience less severe EPA enforcement actions. Congressional Characteristics
Party Identification and the severity of EPA action implying that a district that is represented by a Democrat will be more likely to receive more severe EPA actions. This result is consistent with the previously mentioned relationship of overall district ideology and EPA enforcement— where a district with a member of Congress who identifies as a Democrat more likely to be associated with levels of EPA enforcement that are more severe.
Member of Congress Party identification is the only congressional variable that is intuitive and easily extrapolated from my theory of EPA enforcement. Member of Congress LCV score displays a negative relationship with level of enforcement, significant at the .05 level (see table 1). This is not the result that was anticipated in my third hypothesis:
Ideological Characteristics Hypothesis: Congressional districts with
members of Congress who are hostile to environmental legislation, as measured through the League of Conservation scorecard, will generally
experience less severe EPA enforcement actions in their respective home districts.
In fact, my model suggests the opposite result, that the lower the LCV score (less friendly to environmental legislation), the higher the level of enforcement. Perhaps the aggregate level of industry is an unknown confounding variable that influences both the ideology of the member of Congress (LCV score) as well as the severity of enforcement. Further analysis will present a more complete picture of the
higher severity of enforcement overall.
The final congressional variable I examined, the importance of a member of Congress as measured through the number of terms served in Congress, proved to not be a predictor that was significant at the .05 level (see table 1). Perhaps this result has less to do with the utility of member importance as a predictor of EPA action and more to do with the “number of terms served” not serving as the best indicator for this variable. However, given the insignificance of this measure in my model, it suggests that the notoriety of any member of Congress on its own will not sway the severity of EPA measures employed in any respective district systematically. This suggests the existence of an EPA that is insulated from the individual power of individual legislators, at least on the aggregate level.
EPA Characteristics
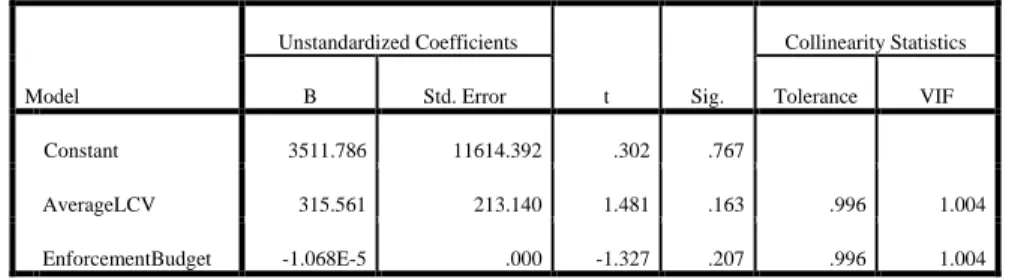
Aside from the ordered probit model, a linear regression model measuring the effect of the annual mean LCV score for the House of Representatives as well as the EPA enforcement budget on the total number of annual enforcement actions forced a rejection of the second hypothesis:
Budgetary Hypothesis: There is a positive relationship between the EPA
enforcement budget and the total number of enforcement actions per year, as expenditures increase so should enforcement activity. Associated with a
rise in EPA enforcement budget should be a pro-environmental trend in the House of Representatives, indicated by a rise in average annual LCV score for the chamber.
statistically significant at the .05 level (see Table 2). Table 2 also suggests that there is no significant collinearity at the root of the relationship between LCV score and EPA enforcement budget. Perhaps as the EPA enforcement regime expands over time, it becomes more efficient, allowing for increased enforcement actions at a lower cost—thus helping to explain the lack of a strong positive relationship between the annual EPA enforcement budget and the aggregate number of annual EPA enforcement actions.
Another possible explanation for the decline in formal enforcement actions, particularly in 2015, is the incompleteness of data. The EPA enforcement databases are massive and merge together data from all 50 states. There may be thousands of cases that will be dated for 2015 that simply have not been updated in the database, or enforcement actions that did not occur prior to my consolidation of EPA data around November of 2015. Additionally, the EPA offers no explanation of the completeness and reliability of the data that they provide, however my exploration of the data did not yield any sort of systematic trend in the incompleteness or inaccuracy of data. Regionally, no significant trends arose regarding a discrepancy in the severity of enforcement within my model.
Conclusion
is in good health. While characteristics of Congress and individual representatives seem to matter to the conclusions of EPA cases, it is the political and economic characteristics of congressional districts that are the most consequential in influencing EPA enforcement actions.
The Environmental Protection Agency, like other agencies in the U.S. Government, does not operate within a vacuum free from the pressures of politics and the economic plight of Americans. This paper explores the factors that
systematically influence EPA enforcement actions not as an indictment against the agency, that in theory is supposed to be neutral, but rather in an effort to understand the discrepancies in enforcement as well as systematic patterns that arise at the aggregate level.
Recognizing the different pressures placed upon the EPA is the first step in building a more efficient agency that works towards equitable enforcement despite the constant flow of political and economic influences. A more efficient and neutral EPA is in the public’s interest and may help to avert environmental disasters such as the recent water crisis in Flint, Michigan.
Table 1: Ordered Probit Model Results, Controlling for EPA Region and Year
Parameter Estimates
Dependent Variable: ordinal values (enforcement level)
Model: (Threshold), MOCLCV, MOCTerms, MOCParty, PercentVoteDemPresidential, UnemRateDis, UnemRateNatl, MedianHouseholdIncome
Dummy variables for Region and Year are present, but suppressed.
Number of observations included= 24,161
Log Likelihood: -9714.502
Akaike’s Information: 1945.004
Bayesian Information: 19540.021
Paremeter
Parameter
B
B
Std. Error
Std. Error
Sig.
Threshold [EnforcementLevel=.00(Informal] -9.046 .5389 .000
[EnforcementLevel=1.00(formal] -6.327 .5366 .000
MOCLCVScore -.001 .0005 .041
MOCTermsServed -.001 .0022 .545
[MOCParty=Democrat] .229 .0379 .000
PercentVoteDemPresidential .006 .0008 .000
UnemploymentRateDistrict -.018 .0030 .000
UnemploymentRateNational -.163 .0225 .000
MedianHouseholdIncome
Table 2: Aggregate Enforcement Actions as Function of Mean LCV & EPA Enforcement Budget
a. Dependent Variable: Count of Enforcements b. Number of Observations: 16
c. R Square= .244
Model
Unstandardized Coefficients
t Sig.
Collinearity Statistics
B Std. Error Tolerance VIF
Constant 3511.786 11614.392 .302 .767
AverageLCV 315.561 213.140 1.481 .163 .996 1.004
Appendix A
Coding
The coding of EPA variables was a fairly straightforward task. Many of the categories such as the year the violation occurred, as well as the enforcement type were simply carried over from the ECHO Database. However, in order to create an ordinal coding system for the Level of Enforcement, I took the three types of enforcement given in the ECHO Database: Informal, Formal, and Judicial and coded them 0-2, with informal being the lowest level (0) and judicial the highest level (2). Coding the character variable of enforcement type into a new variable labeled “Enforcement?” greatly simplified the analysis and allowed for an ordered
probit model.
Once district demographic values were obtained, coding these variables was fairly simple. I did take the liberty of using the % vote for Obama in the previous election as the measure for “District Ideology”. Aside from the party identification of the member of Congress representing a district, I feel this is a measure that is independent of choice for a candidate for Congress and therefore a more reliable measure of district ideology, as the % vote for Obama did not always correlate with choice for representative.
In terms of coding for congressional attributes for each district in each given year, the process was much more tedious and required decisions to be made regarding the coding process. “Member of Congress Party ID” was the easiest measure to code, with 1 for “Republican” and 0 for “Democrat” but that is where
for each of six years, I realized that due to redistricting and mobility within states, many members of Congress served in multiple districts during the time studied. To account for this in “MoC Terms in Office”, I manually tallied the number of terms
served, regardless if they were from another district. This may not be the most efficient way of coding, but seemed the best to capture what I wanted from this particular variable which was to quantify experience and entrenchment in Congress.
In regards to the League of Conservation Voter Scores, I chose to use a member’s lifetime score for the year 2015, due to the 2015 scorecard being
unavailable at the time of coding. If 2015 was the first year for a representative and there was no lifetime score, I used the average LCV score for that particular district over the course of the preceding 10 years. LCV scorecards do not record a score for the Speaker of the House, so the Speaker’s score was omitted from analysis each year. In addition, if the member of Congress was absent or vacant for too many votes to record a score, I omitted the LCV score from that particular district for that specific year. If a representative split a term with another person during the year, the LCV score recorded was for the representative that was present for a majority of votes in that particular year.
Spatial Analysis
the state in which the firm was located. Even with throwing out some cases I was left with around 26,000 cases out of the 27,500 I started with—a 94% success rate in geocoding.
Offshore violations presented another issue. Specifically in the Gulf of Mexico, many violations occurred in the state waters just off the coast. I coded these violations as having occurred in the congressional district closest in proximity to the offshore site, using features of ArcGIS.
Once the firms were plotted according to the year in which they were in violation, I had to use the specific shapefile associated with each new set of district lines for the period studied.4 This was necessary to ensure that as the district lines moved, so did my classification of which district was tied to each violating firm in order to create an accurate analysis of the factors at play.
4
Appendix B
Sources of Information for Variables Used
Variable Source
Firm characteristics, including enforcement outcomes
"Integrated Compliance Information System for Federal Civil Enforcement Case Data
(ICIS FE&C Data)." EPA Enforcement Compliance History Online: Data Downloads. Accessed October 10, 2015. https://echo.epa.gov/tools/data-
downloads#downloads. EPA Budgetary
Information
"EPA's Budget and Spending." EPA. February 12, 2016. Accessed February 16, 2016.
http://www.epa.gov/planandbudget/budget. Firm Location "Facility Registry Service: Facilities and Linkages." EPA
Enforcement Compliance
History Online: Data Downloads. Accessed October 10, 2015. https://echo.epa.gov/tools/data-
downloads#downloads. Per Capita GDP and
Unemployment Rate per District per Year
Census Bureau. "American FactFinder: ACS 1 Year Surveys." American FactFinder:
American Community Survey. Accessed December 27, 2015.
http://factfinder.census.gov/legacy/aff_sunset.html. District Ideology Singer, Jeff. "Daily Kos Elections: Statewide Election
Results by Congressional and
Legislative Districts." Daily Kos. September 7, 2013. Accessed November 21, 2015.
http://www.dailykos.com/story/2013/07/09/1220127/- Daily-Kos-Elections-2012-election-results-by-
congressional-and-legislative- districts?detail=hide#AL. Member of Congress
Party ID and Terms Served
Civic Impulse, LLC. "Members of Congress Profile." GovTrack.us. Accessed December
12, 2015.
https://www.govtrack.us/congress/members/current#. Member of Congress
LCV Score
League of Conservation Voters. "LCV Scorecards: 2010- 2014." League of Conservation
Voters Scorecard. Accessed October 8, 2015. http://scorecard.lcv.org/.
Congressional District Filters for GIS
Lewis, Jeffrey B., Brandon Devine, Lincoln Pritcher, and Kenneth C. Martis. "United States Congressional
Appendix C
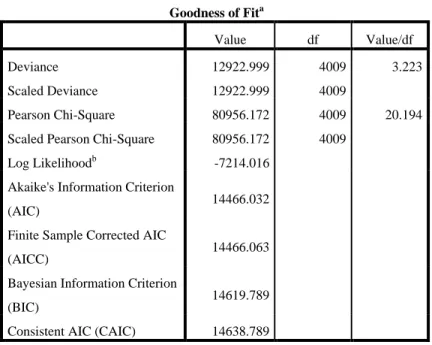
Table 1 (without regional or year dummy variables)
Goodness of Fita
Value df Value/df
Deviance 12922.999 4009 3.223
Scaled Deviance 12922.999 4009
Pearson Chi-Square 80956.172 4009 20.194
Scaled Pearson Chi-Square 80956.172 4009
Log Likelihoodb -7214.016
Akaike's Information Criterion
(AIC) 14466.032
Finite Sample Corrected AIC
(AICC) 14466.063
Bayesian Information Criterion
(BIC) 14619.789
Consistent AIC (CAIC) 14638.789
Dependent Variable: ordinal values
Model: (Threshold), MOCParty, Region, MOCLCV, MOCTerms,
UnemRateDis, UnemRateNatl, MedianHouseholdIncome,
EnforcementBudget, EPABudget
a. Information criteria are in smaller-is-better form.
b. The full log likelihood function is displayed and used in computing
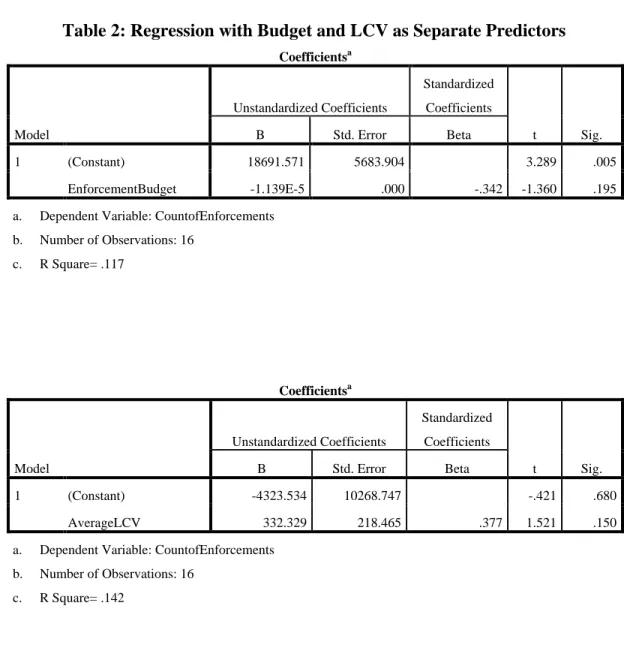
Table 2: Regression with Budget and LCV as Separate Predictors
Coefficientsa
Model
Unstandardized Coefficients
Standardized
Coefficients
t Sig.
B Std. Error Beta
1 (Constant) 18691.571 5683.904 3.289 .005
EnforcementBudget -1.139E-5 .000 -.342 -1.360 .195
a. Dependent Variable: CountofEnforcements
b. Number of Observations: 16
c. R Square= .117
Coefficientsa
Model
Unstandardized Coefficients
Standardized
Coefficients
t Sig.
B Std. Error Beta
1 (Constant) -4323.534 10268.747 -.421 .680
AverageLCV 332.329 218.465 .377 1.521 .150
a. Dependent Variable: CountofEnforcements
b. Number of Observations: 16
Works Cited
Bosch, J.C., E. Woodrow Eckard, and Insup Lee. "EPA Enforcement, Firm Response Strategies, and Stockholder Wealth: An Empirical Examination." Managerial and Decision Economics 19 (1998): 167-77. Accessed February 25, 2015.
http://onlinelibrary.wiley.com/doi/10.1002/(SICI)1099-1468(199805)19:33.0.CO;2-7/epdf.
Census Bureau. "American FactFinder: ACS 1 Year Surveys." American FactFinder: American Community Survey. Accessed December 27, 2015.
http://factfinder.census.gov/legacy/aff_sunset.html.
Civic Impulse, LLC. "Members of Congress Profile." GovTrack.us. Accessed December 12, 2015. https://www.govtrack.us/congress/members/current#.
Deily, Mary E. and Wayne B Gray. “Enforcement of Pollution Regulations in a Declining Industry.” Journal of Environmental Economics and Management, Volume 21,
Issue 3, 1991, Pages 260-274, ISSN 0095-0696, http://dx.doi.org/10.1016/0095-0696(91)90030-M.
(http://www.sciencedirect.com/science/article/pii/009506969190030M)
"EPA's Budget and Spending." EPA. February 12, 2016. Accessed February 16, 2016. http://www.epa.gov/planandbudget/budget.
"Facility Registry Service: Facilities and Linkages." EPA Enforcement Compliance History Online: Data Downloads. Accessed October 10, 2015.
https://echo.epa.gov/tools/data-downloads#downloads.
Quarterly 45, no. 2 (1992): 403-17. Accessed April 1, 2015. http://www.jstor.org/stable/448718.
"Integrated Compliance Information System for Federal Civil Enforcement Case Data (ICIS FE&C Data)." EPA Enforcement Compliance History Online: Data Downloads. Accessed October 10, 2015. https://echo.epa.gov/tools/data-downloads#downloads.
League of Conservation Voters. "LCV Scorecards: 2010-2014." League of Conservation Voters Scorecard. Accessed October 8, 2015. http://scorecard.lcv.org/.
Lewis, Jeffrey B., Brandon Devine, Lincoln Pritcher, and Kenneth C. Martis. "United States Congressional Shapefiles." United States Congressional District Shapefiles. 2013. Accessed August 28, 2015. http://cdmaps.polisci.ucla.edu/.
Mallinson, Daniel J. "Upstream Influence: The Positive Impact of PAC Contributions on Marcellus Shale Roll Call Votes in Pennsylvania." Interest Groups & Advocacy 3, no. 3 (2014): 293-314.
Mohai, Paul, and David Kershner. "Race and Environmental Voting in the U.S.
Congress." Social Science Quarterly 83, no. 1 (2002): 167-89. Accessed February 11, 2015. wiley.com.
"Right to Work FAQ." National Right to Work Legal Defense Foundation. Accessed November 12, 2015. http://www.nrtw.org/b/rtw_faq.htm.
Shipan, Charles R., and William R. Lowry. "Environmental Policy and Party Divergence in Congress." Political Research Quarterly 54, no. 2 (2001): 245-63. Accessed February 11, 2015.