Workplace Bullying, Depression
and Cortisol
Maria Gullander
PhD Thesis
This thesis has been submitted to the Graduate School at the Faculty of Health and Medical Sciences, University of Copenhagen
Workplace Bullying, Depression and
Cortisol
Maria Gullander
PhD thesis
Faculty of Health and Medical Sciences
University of Copenhagen
and
Department of Occupational and Environmental Medicine
Bispebjerg University Hospital
Workplace Bullying, Depression and Cortisol Maria Gullander
PhD thesis
Submitted June, 2014 Defended September, 2014 ISBN XXX-XX-XXXX-XXX-X
Academic advisors
Jens Peter Bonde Bispebjerg University Hospital, Dept. of Occupational and Environmental Medicine,
Åse Marie Hansen University of Copenhagen, Dept. of Public Health Annie Høgh University of Copenhagen, Dept. of Psychology
Assessment Comitee
Rikke Lund
University of Copenhagen (Chair)
Anne Helene Garde
National Research Centre for the Working
Environment
Judith Sluiter
University of Amsterdam
Department of Occupational and Environmental Medicine Bispebjerg University Hospital
DK-2400 Copenhagen NV Denmark
This Ph.D. thesis arises from the Modena Project, which was funded by the Danish Working Environment Research Fund in 2010. The overall aim of the project was to investigate exposure to workplace bullying and risk of mental distress with a longitudinal design. The Modena Project gave us the opportunity to develop and use independent measurements of both exposure and outcome. The Modena Project is a joint collaboration between four Danish research institutions; the Department of Occupational and Environmental Medicine at Bispebjerg University Hospital, the Department of Occupational Medicine at Aarhus University Hospital, the National Research Centre for the Working Environment, and the Institute of Psychology at the University of Copenhagen.
I have held a key position in the Modena Project throughout the whole process; planning the data collection, establishing the survey, undertaking screenings for standardized diagnostic interviews, making contact to respondents, planning and inviting respondents to interviews and clinical sessions, cleaning data, and completing the Modena database. This work has resulted in the present Ph.D thesis, and a complete, three-wave database, which can be used in future work on workplace bullying and the psychological and physiological consequences of this.
I would like to thank my supervisors, Jens Peter Bonde, Åse Marie Hansen and Annie Høgh for their support and advice throughout the process. I have enjoyed being inspired by you and I truly appreciate all your knowledge and expertise in the field of occupational health from which I have learned a lot, developed my competencies within many areas, and strengthened my integrity and wisdom.
A big thank you should also be directed to the Modena Project group; Henrik Kolstad, Morten Willert, Jens Peter Bonde, Jane Frølund Thomsen, Åse Marie Hansen, Roger Persson, Annie Høgh and Ole Mors. To be a part of work processes and discussions in the Modena group has been a journey full of happiness and frustrations, but most of all, pride to be a part of this ambitious project. In a late state of the project process Matias Grynderup became part of
the group, and even though I have only worked with you for a short time, I owe you a great deal of recognition for your help with my work on cortisol.
My Ph.D. journey also included three months at Uni Research in Bergen, Norway. My time at your office meant inspiration and new points of view for which I am eternally thankful. Working closely with Anette Harris gave me strength and new belief in my work. Thank you Anette, I really enjoyed working with you.
In my everyday life as a Ph.D candidate I have spent many hours in the office at Bispebjerg University Hospital, so to all my officemates; Ina, Marianne, Emina, Thomas, Kasper, Dorthe, Rikke, Kristian and Hanne, thank you so much for fun and inspiring lunch- and coffee breaks, as well as support, when processes have been frustrating, but most of all, thank you all for the lovely and trusting friendships that have developed throughout the years.
To my dearest mom and dad, my family and friends; all of you have been a fantastic support on this journey. I appreciate your continued support and would like to thank you all for always standing by me.
Finally, Trond and Birk, my lovely little family, you two are my greatest supporters. To you, my dearest Trond, you deserve my deepest and greatest gratitude. Your positive and never-ending help and assistance has been encouraging and appreciated, more than you will ever realize.
Maria Gullander June 2014
This thesis is based on three papers:
Paper I
Manuscript: Exposure to workplace bullying and risk of depression Gullander Maria (M.Sc), Hogh Annie (Prof.), Hansen Åse Marie (Prof.), Persson Roger (Ph.D.), Rugulies Reiner (Prof.), Kolstad Henrik Albert (Prof.), Thomsen Jane Frølund (Ph.D), Willert Morten Veis (Ph.D), Grynderup Matias (Ph.D), Mors Ole (Prof.), Bonde Jens Peter (Prof.)
Submitted in the Journal of Occupational and Environmental Medicine February 6th 2014
Paper II
Manuscript: Is workplace bullying related to changes in levels of cortisol in saliva?
Gullander Maria (M.Sc), Grynderup Matias (Ph.D), Hansen Åse Marie (Prof.), Hogh Annie (Prof.), Persson Roger (Ph.D.), Kolstad Henrik Albert (Prof.), Thomsen Jane Frølund (Ph.D), Mors Ole (Prof.), Andersen Johan Hviid (Ph.D), Kærlev Linda (Ph.D), Bonde Jens Peter (Prof.)
Manuscript to be submitted
Paper III
Manuscript: An examination of cortisol reactivity and recovery during low level exercise among workplace bullied persons
Gullander Maria (M.Sc), Harris Anette(Ph.D), Hansen Åse Marie (Prof.), Hogh Annie (Prof.), Grynderup Matias (Ph.D), Persson Roger (Ph.D.), Kolstad Henrik Albert (Prof.), Kærlev Linda (Ph.D), Bonde Jens Peter (Prof.)
LIST OF ORIGINAL PAPERS ... 1
LIST OF ABBREVIATIONS ... 4
LIST OF TABLES AND FIGURES ... 5
INTRODUCTION ... 6
1 BACKGROUND... 8
2 2.1 Workplace bullying – what does it mean? ... 8
2.1.2 Assessmentof workplace bullying ... 9
2.1.3 Witnesses to workplace bullying ... 10
2.2 Depression ... 10
2.2.1 Assessment of depression ... 11
2.3 Cortisol ... 11
2.3.1 Assessment of cortisol ... 13
2.4 Literature search on workplace bullying and depression ... 13
2.4.1 Review of cross-sectional studies on workplace bullying and depression and symptoms of depression ... 15
2.4.2 Review of longitudinal studies on workplace bullying and depression and symptoms of depression ... 18
2.5 Review of literature on workplace bullying and cortisol ... 22
2.6 Workplace bullying, cortisol and depression ... 25
AIM OF THESIS ... 27
3 MATERIALS AND METHODS ... 28
4 4.1 Design and Population ... 28
4.2 Exposure Assessment... 29
4.2.1 Self-labeled workplace bullying ... 29
4.2.2 Measures of witnessed workplace bullying ... 29
4.2.3 Work-units ... 29
4.2.4 Cycling test... 30
4.3 Outcome assessment ... 30
4.3.1 Depression ... 30
4.3.2 Symptoms of depression... 31
4.3.3 Cortisol concentrations ... 31
4.4 Screening criteria for SCAN interviews ... 32
4.5 Data structure ... 33
4.5.1 Confounders ... 33
4.5.2 Statistical analyses ... 34
RESULTS ... 35 5
5.1 Paper I: Exposure to workplace bullying and risk of
depression ... 35
5.1.1 Supplementary analysis: Symptoms of Depression ... 35
5.2 Paper II: Is workplace bullying related to changes in levels of cortisol in saliva? ... 37
5.2.1 Supplementary analysis: Cross-sectional cortisol concentrations ... 37
5.3 Paper III: An examination of cortisol reactivity and recovery during low level exercise – an innovative study ... 38
DISCUSSION ... 40
6 6.1 Main Results ... 40
6.2 Exposure Assessment... 40
6.2.1 The self-labeling method ... 40
6.2.2 The witness method ... 41
6.3 Outcome Assessment ... 42
6.3.1 Depression and symptoms of depression ... 42
6.4 Confounding and reversed causality ... 43
6.5 Saliva cortisol... 44
6.5.1 Strength and limitations in cortisol studies ... 45
6.6 Selection bias and loss-to follow-up... 47
CONCLUSION ... 48
7 7.1 Future implications ... 48
REFERENCES ... 50
8 SUMMARY ... 60
RESUMÉ ... 62
PAPER I ... I
PAPER II ... II
LIPT Leymann Inventory of Psychological Terror
NAQ Negative Acts Questionnaire
BDI Beck Depression Inventory
ZSDS Zung Self-rating Depression Scale
MDI Major Depression Inventory
HSCL-25 Hopkins Symptom Check List
CES-D Center for Epidemiological Studies – Depression Scale
CMDQ Common Mental Disorder Questionnaire
HAD Scale Hospital Anxiety and Depression Scale
ICD International Classification of Diseases
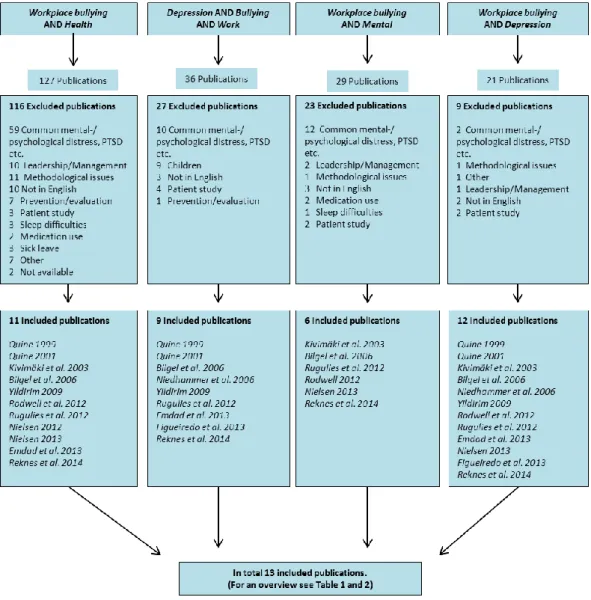
Figure 1 Diagram of literature search
Figure 2 Cohort material
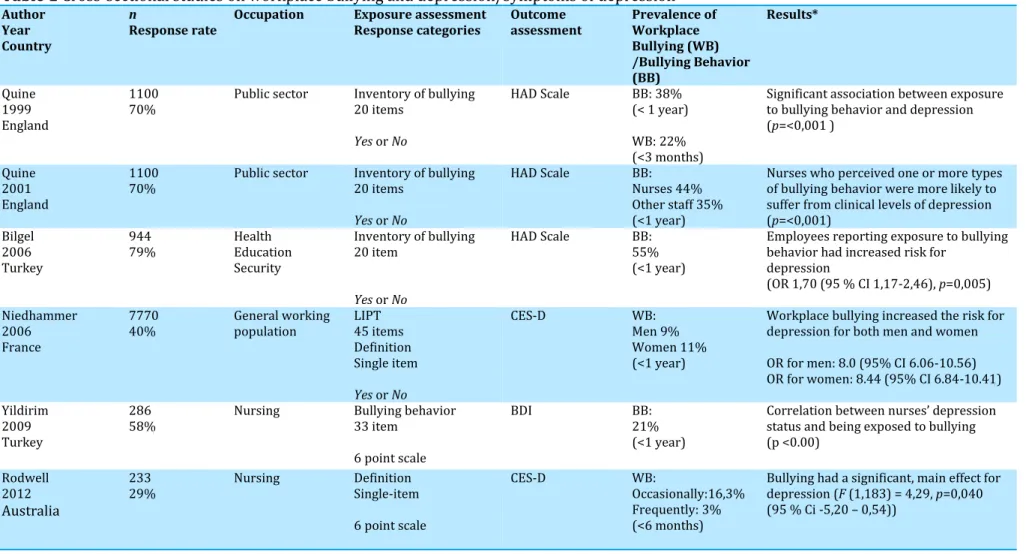
Table 1 Cross-sectional studies on workplace bullying and depression/symptoms of depression
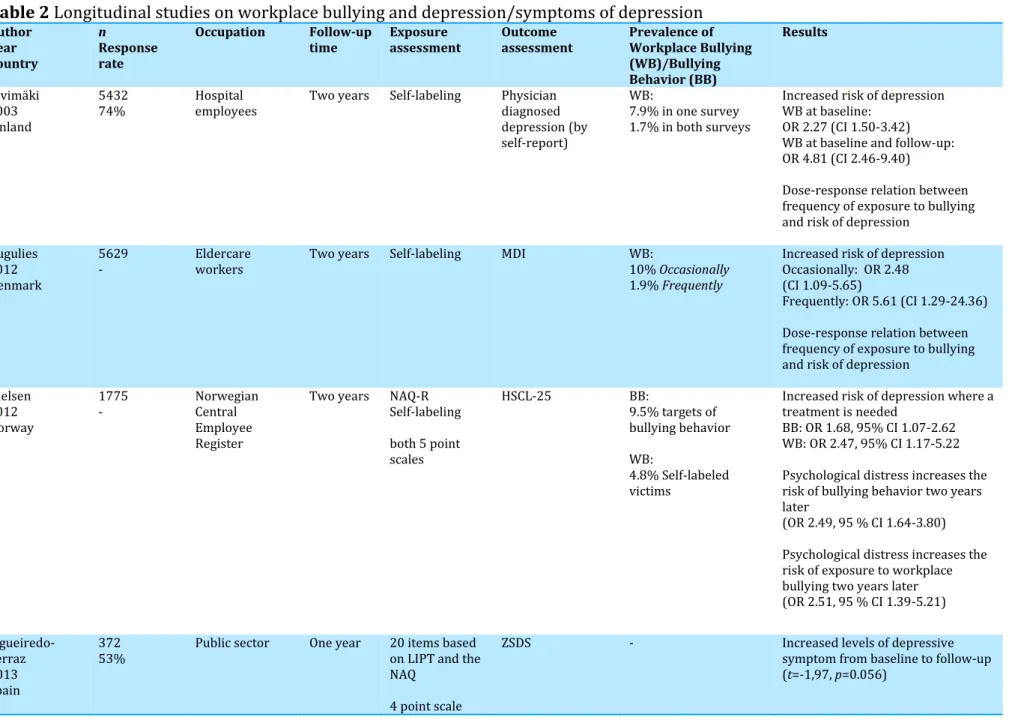
Table 2 Longitudinal studies on workplace bullying and depression/symptoms of depression
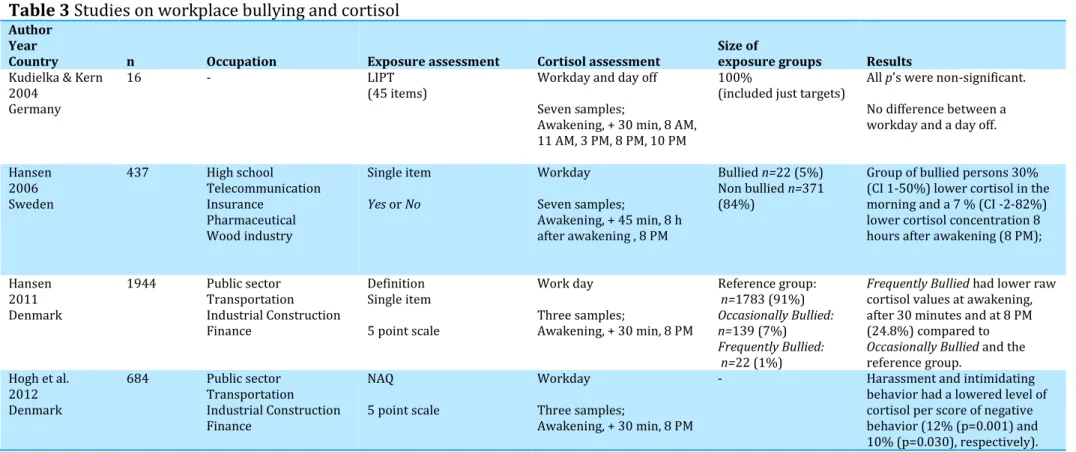
Table 3 Studies on workplace bullying and cortisol
Table 4 Prevalence of bullying in the Modena database
Table 5 Risk of symptoms of depression by self-reported workplace bullying
Table 6 Risk of symptoms of depression by exposure groups
Table 7 Cortisol concentrations for morning and evening samples in the PRISME- and the WBH Cohort in cross-sectional design
Over the last decade workplace bullying has received an increased amount of attention from researchers within different disciplines, and it has been revealed as a complex and serious phenomenon. Among psychologists and physicians working with victims of workplace bullying, it is well known that people who perceive themselves as being bullied, feel humiliated and report harsh and unfair treatment at work. Employees exposed to workplace bullying often express feelings in line with symptoms of anxiety, depression, Post-Traumatic Stress Disorders and burnout; and they also often describe their emotional state as being frustrated, helpless, powerless, unable to concentrate, as well as having low self-esteem, and low self-efficiency [1]. Their stories are often characterized by descriptions of situations where colleagues or managers deliberately try to hurt and demean them. For some employees it has meant exclusion from a community, where a person’s social position has been seen as uninteresting, dull and unworthy [2].
In 2009, The National Board of Industrial Injuries in Denmark acknowledged that it was necessary to obtain more knowledge on the causality of workplace bullying and development of mental distress. This is due to an increase of reports of work-related injury arising from workplace bullying and harassment. It is usually difficult to have mental disorders be acknowledged as a work related injury, as it is problematic to prove that the mental disorder has emerged from work environment, e.g. because of exposure to workplace bullying. Most often, there are so-called “competitive conditions”, e.g. contributory factors at home, or having previously suffered from a depression.
The main focus of this Ph.D. thesis is exposure to workplace bullying, depression and cortisol. It contributes to the debate on the health consequences of workplace bullying, and includes a deeper understanding of the methodological issues that are associated with the investigation of workplace bullying. The background chapter gives an overview of workplace bullying, depression and cortisol, and includes a review of studies in the research field. Subsequently, the aims of the thesis will be presented, followed by an overview of methods used in PaperI, II and III and the ensuing results.
Lastly, methodological issues and the findings of the thesis will be discussed, followed by conclusion and future implications.
Within bullying research, several terms and definitions have been used in the investigation of the phenomenon: Workplace Harassment [3], Mobbing [4], or Workplace Abuse [5]. However, the most used definition is from Einarsen (1996) [6], who describes workplace bullying as harassing, offending, socially excluding someone or negatively affecting someone’s work repeatedly and regularly over a longer period, e.g. six months. The definition is developed from a definition by Olweus (1993) [7], who stated that three criteria have to be present if a situation can be defined as bullying: (1) The bullying is a negative and unwanted behavior by the target, (2) The bullying is carried out systematically and over time, and (3) The bullying occurs in an interpersonal relationship, characterized by an imbalance of power [7]. The definition by Einarsen (1996) [6]refers to the escalation of the bullying process where the target is persistently and over time, subjected to negative behavior and increasingly unable to defend him- or herself against this behavior. Because the definition of workplace bullying includes the above-mentioned criteria, it is significant for the understanding of workplace bullying to be aware of the chronicity part of the definition.
Workplace bullying not only influences the person exposed to the humiliating behavior, but also the workplace and society at large [8]. Studies have also shown that low satisfaction with the leadership, low work control [9], high role conflict [9, 10], poor job content, and a negative social environment as well as a negative social climate [6] are the consequences of bullying in a working environment.
Research has revealed that the prevalence of workplace bullying varies between countries, cultures and job categories [11], and furthermore among ways of measurements of workplace bullying [12]. For example, in a study among 1657 employees in the Royal Norwegian Navy, 2,5% reported being bullied at work [13]. This was measured with a single question, and the result did not provide information about the frequency of the exposure to bullying. In a study among the French working population (n=7694) Niedhammer and
exposed to bullying at work daily or almost daily. In this study, cases of bullying were defined using both the Leymann Inventory of Psychological Terror (LIPT) and self-labeling. Furthermore, in a British study among 5288 employees in different organizations, current exposure to bullying at work was reported by 11%, 2% of whom were Frequently Bullied [15].This study was measured by self-report with five answer alternatives. The three studies illustrate the diversity in methods used to measure workplace bullying.
In 2012, 16,300 Danish employees responded on the national survey Work Environment and Health provided by the National Research Center for Work Environment. Among those, 10% reported being Occasionally exposed to workplace bullying, and 2% reported being exposed to workplace bullying
Frequently, within the last 12 months [16]. Several studies have estimated the prevalence of workplace bullying among employees in Denmark. A representative population study showed an overall prevalence of workplace bullying of 8.3%, among those 6.2% reported Occasionally Bullied whereas 1.6% reported being Frequently Bullied at work [17]. Rugulies and co-workers (2012) [18] reported 10% Occasionally Bullied and 1.9% Frequently Bullied
among 5629 women in the eldercare sector, whereas Hogh and co-workers(2011) [19] revealed that among newly educated health care workers 7.4% reported being Occasionally Bullied and 1.8% reported being Frequently Bullied in the first year after their graduation.
Assessment of workplace bullying is difficult since the concept reflects many aspects, and may be influenced by reporting bias. However, the most used methods are 1) to determine if employees feel victimized by bullying, or 2) to assess employee’s perception of being exposed to a range of specific bullying behaviors.
The first assessment is referred to as the self-labeling method and is measured with a single item with response categories as either Yes or No, or with a scale that also indicates the frequency of exposure [20]. This method does not indicate what kind of bullying behavior the employee has been exposed to, but reports if an employee identifies him or herself as a victim of bullying at work.
workplace bullying to the respondent, prior to the interview [20]. The second method is referred to as the Behavioral Experience Method, which defines what kind of bullying behaviors employees are exposed to [20]. This method does not provide information about whether or not a person perceives the acts as workplace bullying. This assessment is predominantly measured with the
Negative Acts Questionnaire (NAQ) [21], which includes 22 items of bullying behaviors with a five-point response category [20]. Other measurements for the behavioral experience method is the LIPT [22], or adjusted versions of the NAQ that are developed to specific occupational groups.
Witnesses to workplace bullying often constitute a larger group than those being bullied in a working environment [23]. This group represents employees in a work unit who are not directly victims of bullying behavior or directly perpetrators. Assessing witnesses to workplace bullying is often done in line with the self-labeling method; with a single item and with response categories as Yes or No, or with a scale that indicates the frequency of employees witnessing workplace bullying in the working environment [20].
Depression is a mental disease characterized by episodes of depressed mood, loss of interests and decreased energy that persists for at least 14 days [24]. The diagnosis of depression covers a spectrum of disorders ranging from relatively light conditions to a severe life-threatening disease. The World Health Organization has placed depression as the fourth out of ten most common diseases in the world [25, 26]. In the European population the lifetime prevalence of depression is approximately 13% [24] and it is currently the leading burden of disease assessed by disability-adjusted life years in middle and high-income countries [25].
Depression is more prevalent among women than men, and the peak of first-onset depression episode is between 25 and 45 years [27]. Several
age, low socioeconomic status, low educational level, alcohol consumption, smoking, a family history of depression, certain personality traits, previous depression, and stressful life events [28-31]. The duration of a depression is normally 3-12 months, and 10-30% of the patients are at risk of developing chronic depression due to the risk of new depressive episodes increasing with the number of previous depressive episodes [32]. Depression has a high co-morbidity with other mental disorders, and although depressive episodes rarely last more than a year, the disorder is highly recurrent and can have an impact for life.
Depression rating scales are the preferred instruments to measure depression in surveys where several self-rating scales have been used in studies: the Beck Depression Inventory (BDI) [33] Zung Self-rating Depression Scale (ZUNG-SDS) [34], Major Depression Inventory (MDI) [35], and the Center for Epidemiological Studies – Depression Scale (CES-D) [36] and Common Mental Disorder Questionnaire (CMDQ) [37]. The conventional clinical procedure is to have a trained person to interview the person with suspected depression and check for the occurrence and duration of a predefined set of symptoms, which form the basis for the diagnosis according to International Classification of Diseases (ICD-10) or Diagnostic and Statistic Manual of Mental Disorders (DSM) [38]. An often used interview scale is the Hamilton Depression Scale [39], the Schedules for Clinical Assessment in Neuropsychiatry (SCAN) [40] and the Composite International Diagnostic Interview [41].
Cortisol is a stress hormone produced in the cortex of the adrenal glands and is involved in the psychopathology reflecting emotional arousal and regulates the metabolic system and the anti-inflammatory pathways [42]. The release of cortisol is facilitated by the Hypothalamus-Pituitary-Adrenal (HPA)-axis where the primary stimulus comes from the Corticotrophin-Releasing Hormone (CRH). CRH is locally produced in hypothalamus. A stimulus of an acute stressor increases the CRH and induces increased secretion of
Adrenocorticotropic Hormone (ATCH) from the pituitary gland. The cortex of the adrenal gland is stimulated by ATCH and triggers the secretion of cortisol into the circulation.
Cortisol exhibits a distinct diurnal variation with a peak in the morning approximately 45 minutes after awakening where cortisol increases up to 50% [43]. Cortisol declines during the day and is low during the evening and at night [43]. Several secretory episodes of short duration and high amplitudes, which depend on the activity, are seen in the variation of cortisol during a day. The short term activations are thereby necessary and adaptive for humans; however, a long term activation of the HPA-axis may be related to negative health outcomes [44]. A cortisol rise increases the oxygen and energy supply, which translates into a temporary increase in blood pressure, levels of blood glucose and free fatty acids. For example, a hypersecretion of cortisol may have implications for the physiological pathways that mediates effects of chronic stress, and can lead to dysregulation of multiple other physiological systems including the autonomic nervous system, the metabolic system, the gut, the kidneys and the immune system [45]. Among others, the changes of the diurnal rhythm have been associated with psychological and somatic complaints; e.g. major depression [46].
In a perspective of workplace bullying, Dickerson and Kemeny (2009) have suggested that even though a variety of situations can elicit negative feelings, only the threatening component of a situation elicits a particular physiological response [47]. They further propose that the motive to defend the Social Self is supported by specific biological processes that include the HPA activation. Dickerson and Kemeny (2004) uses the term Social Self-Preservation System
for a biological skill that monitors the environment for threats to one’s social esteem or social status, and coordinates psychological, physiological and behavioral responses to cope with such threats [48]. Responses to threatening situations include an increase in negative evaluations (negative self-related thoughts and feelings), increase in cortisol, and changes in other physiological parameters. This is defined as the Social-Evaluative-Threat. The magnitude of these responses depends on the intensity of the threat, its context, and the presence of vulnerability and protective factors in the
Cortisol has been a tool widely used to investigate the responsiveness of the HPA axis in occupational stress studies, in both field- and experimental studies [49]. The ways of assessing cortisol vary among many options and can be measured in blood, urine, hair and saliva. Cortisol is used as a biomarker of the diurnal rhythm [50] and activation of adrenocortical activity (HPA activity) [51]. Assessing cortisol in large epidemiological studies offers different alternatives, such as cortisol awakening response, the diurnal slope, area under the curve, morning cortisol, evening cortisol, cortisol at specific time (points across the waking day), reactivity to a momentary stressor, and reactivity to a daily stressor [52].
During the last 20 years, several studies have been conducted on workplace bullying and health outcomes. Within the last few years, the field of workplace bullying has received more attention and many different themes have been investigated in this relation. In order to search the literature about workplace bullying and depression, a literature review was conducted in PubMed (1960 - ) on the 29th of March, 2014. To identify the relevant literature, the search was
done in four combinations: Workplace bullying AND Health, Workplace bullying AND Mental, Workplace bullying AND Depression, and Depression AND
Bullying AND Work. These search combinations produced 213 publications altogether (see Figure 1). Furthermore, the search strategy was reflected in the following inclusion criteria: 1) The study had to be cross-sectional or longitudinal, 2) The study had to include workplace bullying as exposure, (3) the study had to include depression or symptoms of depression as outcome, and 4) The study had to include a reference group. All four criteria had to be met for inclusion.
An overview of the literature search can be found in Figure 1. According to the figure, a majority of the publications were excluded as they did not meet the four criteria described above. The main explanation for this was that they used mental distress, common mental disorder, psychological distress, or similar as their outcome, which covers more than depression or symptoms of depression that are used as outcome in this thesis.
Furthermore, as illustrated in Figure 1, several of the included publications appeared in more than one search. Hence, after cross-checking for duplicates a total of 13 publications were included for the literature review of this thesis. Additionally, one publication by Nielsen and co-workers (2012), which was excluded after the first stage of the literature search, was re-included [53]. Nielsen and co-workers (2012) described their outcome as psychological distress, but since they used a validated scale: the HAD Scale, and defined a cut-off that reflects a depression where treatment is needed the publication was included.
Up until 2010, studies on Workplace Bullying and Depression and/or Depressive Symptoms were predominately conducted in cross-sectional designs. Quine (1999) found a significant relationship between exposure to bullying behavior and depression in a study conducted among 1100 employees in the public sector. Bullying behavior was measured with 20 items, followed by response categories of Yes and No, whereas depression was measured with the HAD Scale [54]. The study revealed that 22% of the participants had been exposed to bullying behavior during the past three months. Another study by Quine (2001) [55] was based on the same study population and used the same measurement for exposure and outcome. This study revealed that nurses were more likely to report exposure to bullying behavior than other occupational groups. Nurses who perceived one or more bullying behaviors were also more likely to report depressive symptoms. Bilgel et al. (2006) [56] revealed that employees who reported exposure to bullying behavior had an increased risk of depression. This study was conducted among 944 employees in Turkey, within the healthcare-, education- and security sector, and used the same measurements for exposure and outcome as Quine [54, 55]. The prevalence of being exposed to bullying behavior was 55% of the study sample. Another study accomplished in Turkey by Yildirim (2009) [57] was carried out among 286 nurses and revealed a significant association between being exposed to bullying behavior and depression status. This study used 33 items to determine bullying behavior and measured depression with the BDI. As in the studies above the exposure to bullying behavior was relatively high, as 21% perceived they had been directly exposed to bullying [57]. Niedhammer co-workers (2006) conducted a large cross-sectional study among 7770 employees in the general French working population. Exposure to workplace bullying was assessed by 1) The 45 items of the LIPT, and 2) By presenting a definition and asking about exposure to bullying at work by self-labeling. In this study, the prevalence of workplace bullying was 9% among men and 11% among women [14]. The prevalence in this study is lower compared to the studies above, and takes advantage of combining two ways of workplace bullying measurement. Depression was measured by the use of the CES-D and the study revealed that
Rodwell and Demir (2012) [58] conducted a study among 233 nurses in Australia, and in this study, the exposure to workplace bullying was measured by self-labeling prior to being presented with a definition. Depression was measured with the CES-D and the study indicated that exposure to workplace bullying had a significant effect on the association with depression.
Table 1 Cross-sectional studies on workplace bullying and depression/symptoms of depression Author
Year Country
n
Response rate Occupation Exposure assessment Response categories Outcome assessment Prevalence of Workplace Bullying (WB) /Bullying Behavior (BB) Results* Quine 1999 England 1100
70% Public sector Inventory of bullying 20 items
Yes or No
HAD Scale BB: 38% (< 1 year) WB: 22% (<3 months)
Significant association between exposure to bullying behavior and depression (p=<0,001 )
Quine 2001 England
1100
70% Public sector Inventory of bullying 20 items
Yes or No
HAD Scale BB: Nurses 44% Other staff 35% (<1 year)
Nurses who perceived one or more types of bullying behavior were more likely to suffer from clinical levels of depression (p=<0,001)
Bilgel 2006 Turkey
944
79% Health Education Security
Inventory of bullying 20 item
Yes or No
HAD Scale BB: 55% (<1 year)
Employees reporting exposure to bullying behavior had increased risk for
depression
(OR 1,70 (95 % CI 1,17-2,46), p=0,005) Niedhammer
2006 France
7770
40% General working population LIPT 45 items Definition Single item
Yes or No
CES-D
WB: Men 9% Women 11% (<1 year)
Workplace bullying increased the risk for depression for both men and women OR for men: 8.0 (95% CI 6.06-10.56) OR for women: 8.44 (95% CI 6.84-10.41) Yildirim
2009 Turkey
286
58% Nursing Bullying behavior 33 item 6 point scale
BDI BB: 21% (<1 year)
Correlation between nurses’ depression status and being exposed to bullying (p <0.00)
Rodwell 2012
Australia
233
29% Nursing Definition Single-item 6 point scale
CES-D WB:
Occasionally:16,3% Frequently: 3% (<6 months)
Bullying had a significant, main effect for depression (F (1,183) = 4,29, p=0,040 (95 % Ci -5,20 – 0,54))
During the last couple of years, several studies have been conducted with longitudinal designs in order to deal with the methodological issues that cross-sectional studies are limited by. Kiwimäki and co-workers (2003) studied hospital employees (n=5432) in a two year follow-up study, where exposure to workplace bullying was measured by self-labeling with response categories Yes and No at both baseline and follow-up [59]. Depression was measured with one question, where the respondents were asked if they had a physician diagnosed depression [59]. The study found an increased risk of depression after exposure to workplace bullying, and a dose-response relation was also indicated between the frequency of workplace bullying and the risk of depression. In 2012, Rugulies and co-workers (2012) [18] supported these findings in a study conducted among 5629 female, eldercare workers. In this study, workplace bullying was measured by self-labeling, and depression was measured by the MDI. Rugulies and co-workers (2012), as well as Kivimäki and co-workers (2003), indicated a similar dose-response relation between exposure to workplace bullying and the risk of depression. Furthermore, they supported Kivimäki and co-workers (2003) by stating that exposure to workplace bullying markedly increased the risk of depression two years later. Rugulies and co-workers (2012) also states that depression at baseline increases the risk of exposure to workplace bullying at follow-up. This reversed causality was confirmed by Nielsen and co-workers (2012) [53], who used the HSCL-25 among 1775 Norwegian employees to determine if depression (Psychological distress: measured as treatment needed depression) was a consequence of exposure to workplace bullying. Nielsen and colleagues (2012) used the NAQ and self-labeling to measure exposure to bullying at work, and revealed a prevalence of 4.8% self-labeled victims and 9.5% who were targets of bullying behavior at work [53]. The study confirmed earlier longitudinal studies with their findings of an increased risk of treated depression after both exposures to bullying behavior and as a self-labeled victim of bullying at work. A Spanish study among 327 employees from the public sector measured exposure to workplace bullying with 20 items based on the LIPT and the NAQ [60]. Figueiredo-Ferraz and co-workers (2013) used the ZSDS to determine depressive symptoms and found that symptoms of
exposure to workplace bullying. Emdad and co-workers (2013) examined the risk of symptoms of depression among bystanders to workplace bullying. Symptoms of depression were measured with the HAD Scale [61]. The study was conducted among 2563 industrial employees in Sweden and revealed that 11% of the participants reported having witnessed bullying at follow-up [61]. The study pointed at an increased risk of depression among witnesses after 18 months, when having witnessed workplace bullying. However, the study has been criticized by Nielsen and Einarsen (2013) [62] because Emdad and co-workers [61] neither controlled for depressive symptoms at baseline, nor measured the participants’ own perceptions of being a victim of bullying at work. In the paper by Nielsen and Einarsen (2013) [62], a similar analysis as used in Nielsen and co-workers (2012) was conducted among the study population. Having witnessed workplace bullying was determined by a single item with 6 response categories, which was dichotomized by 0=Not witness and 1-5=Yes, witness. Depression was, as in Nielsen and co-workers (2012), measured by the HSCL-25. The study revealed that having witnessed workplace bullying does not increase the risk of depression two years later. Reknes and co-workers (2013) studied 5400 nurses and exposure to bullying behaviors, in terms of acts such as excluding someone from the work environment and/or someone receiving persistent criticism for their work effort [63]. This was associated with depressive symptoms, and it was found that exposure to bullying behavior did not increase the risk of depressive symptoms one year later.
Table 2
Longitudinal studies on workplace bullying and depression/symptoms of depression
Author Year Country n Response rateOccupation Follow-up
time Exposure assessment Outcome assessment Prevalence of Workplace Bullying (WB)/Bullying Behavior (BB) Results Kivimäki 2003 Finland 5432
74% Hospital employees Two years Self-labeling Physician diagnosed depression (by self-report)
WB:
7.9% in one survey 1.7% in both surveys
Increased risk of depression WB at baseline:
OR 2.27 (CI 1.50-3.42) WB at baseline and follow-up: OR 4.81 (CI 2.46-9.40)
Dose-response relation between frequency of exposure to bullying and risk of depression
Rugulies 2012 Denmark
5629
- Eldercare workers Two years Self-labeling MDI WB: 10% Occasionally
1.9% Frequently
Increased risk of depression Occasionally: OR 2.48 (CI 1.09-5.65)
Frequently: OR 5.61 (CI 1.29-24.36) Dose-response relation between frequency of exposure to bullying and risk of depression
Nielsen 2012 Norway 1775 - Norwegian Central Employee Register
Two years NAQ-R Self-labeling both 5 point scales
HSCL-25 BB:
9.5% targets of bullying behavior WB:
4.8% Self-labeled victims
Increased risk of depression where a treatment is needed
BB: OR 1.68, 95% CI 1.07-2.62 WB: OR 2.47, 95% CI 1.17-5.22 Psychological distress increases the risk of bullying behavior two years later
(OR 2.49, 95 % CI 1.64-3.80) Psychological distress increases the risk of exposure to workplace bullying two years later (OR 2.51, 95 % CI 1.39-5.21)
Emdad 2013 Sweden
2563
60% Paper mills Steelwork Truckers
18 months Witnessing bullying: Single item
Yes or No
HAD Scale 11% reported being a witness to bullying in the workplace at follow-up
Risk of depression increased within 18 months after being a witness of workplace bullying
(OR: 1.69 (95 % CI 1.13-2.25)) Nielsen
2013 Norway
1775
57% Norwegian Central Employee Register
Two years Single item 6 point scale
HSCL-25 12.6% reported being a witness to bullying in the workplace at follow-up
Increased risk of anxiety/depression was not significant after controlling for symptoms at baseline and the witness own exposure to bullying (OR: 1.66 (95% CI 0.87-3.15)) Reknes
2013 Norway
5400
38% Nurses One year NAQ HAD Scale - Exposure to workplace bullying did not predict increased symptoms of depression (β=0,01, p=<0,47) Reciprocal relationship between symptoms of depression and exposure to workplace bullying (β=0,12, p=<0,01)
The literature on workplace bullying and cortisol is limited. Only five publications on workplace bullying and cortisol have been published during the last ten years (for an overview, see Table 3). In this review, four publications were included [64-67]. The fifth was excluded since it was conducted among patients [68].
The first publication conducted by Kudielka and Kern (2004) among sixteen persons was a pilot study, which investigated bullying and cortisol [64]. The participants were recruited over eight months and had experienced bullying according to the LIPT. Cortisol day profiles were measured with seven samples. The study showed a tendency towards an increased cortisol concentration in the morning, and a lower concentration in the evening among bullied persons [64]. However, there were no significant differences between a workday and a day off. Hansen and co-workers (2006) measured exposure to workplace bullying among Swedish employees from different occupations (n=437). The study used a single question to distribute respondents as
Exposed and Non-exposed to bullying by a dichotomized response category. In the group of Bullied persons it was revealed 30% (CI 1-50%) lower cortisol concentration in the morning and 7% (CI -2-82%) lower cortisol concentration eight hours after awakening (2 AM)bothcompared to the Non-bullied employees [65]. In their second (45 minutes after awakening) and last (8 PM) sample of cortisol, no significant difference was found. Another study by Hansen and and co-workers (2011) among 1944 Danish employees measured exposure to workplace bullying by a single item and included a reference group of 1783 persons [66]. Cortisol concentrations were measured three times during a workday: At awakening, 30 minutes after awakening and at 8 PM in the evening [66]. The study revealed that Frequently Bullied (1% of the sample, Weekly or more Frequent) had lower cortisol values at awakening, after 30 minutes and at 8 PM (24.8% (CI 0.62-0.91)) compared to Occasionally Bullied persons and the reference group [66]. However, no statistically significant differences were found in the cortisol awakening response, or in the decline during the day. Hogh and co-workers (2012) investigated exposure to bullying at work and cortisol concentrations in 684 employees from public and private workplaces in Denmark [67]. The NAQ was used to
study by Hansen and co-workers (2006) [67]. The study found significantly reduced levels of cortisol in relation to two out of four factors of negative acts. A significant reduction in cortisol was found in persons who were exposed to person-related negative acts as direct harassment (12.18%) and intimidating behavior (9.62%), but not in persons subjected to work related acts [67]. The study also revealed a significantly lower cortisol concentration among persons exposed to direct harassment and intimidating behavior. However, this group of respondents represents approximately 25% of the study population and could therefore be indicative of covering more than persons labeling themselves as Bullied. Furthermore, it is unclear what the cortisol reduction of 12% and 10% cover in this study.
Table 3
Studies on workplace bullying and cortisol
AuthorYear
Country n Occupation Exposure assessment Cortisol assessment Size of exposure groups Results
Kudielka & Kern 2004
Germany
16 - LIPT
(45 items) Workday and day off Seven samples;
Awakening, + 30 min, 8 AM, 11 AM, 3 PM, 8 PM, 10 PM
100%
(included just targets) All p’s were non-significant. No difference between a workday and a day off. Hansen
2006 Sweden
437 High school Telecommunication Insurance
Pharmaceutical Wood industry
Single item
Yes or No
Workday Seven samples;
Awakening, + 45 min, 8 h after awakening , 8 PM
Bullied n=22 (5%) Non bullied n=371 (84%)
Group of bullied persons 30% (CI 1-50%) lower cortisol in the morning and a 7 % (CI -2-82%) lower cortisol concentration 8 hours after awakening (8 PM); Hansen
2011 Denmark
1944 Public sector Transportation Industrial Construction Finance
Definition Single item 5 point scale
Work day Three samples;
Awakening, + 30 min, 8 PM
Reference group:
n=1783 (91%)
Occasionally Bullied: n=139 (7%)
Frequently Bullied: n=22 (1%)
Frequently Bullied had lower raw cortisol values at awakening, after 30 minutes and at 8 PM (24.8%) compared to
Occasionally Bullied and the reference group.
Hogh et al. 2012 Denmark
684 Public sector Transportation Industrial Construction Finance
NAQ 5 point scale
Workday Three samples;
Awakening, + 30 min, 8 PM
- Harassment and intimidating behavior had a lowered level of cortisol per score of negative behavior (12% (p=0.001) and 10% (p=0.030), respectively).
In both cross-sectional- and longitudinal studies, the literature review on workplace bullying, depression and depressive symptoms indicates that being exposed to bullying at work can be seen as a serious stressor, which can have negative consequences on the person being bullied. The cross-sectional studies (Table 1) show associations of depression and symptoms of depression. Only two studies [14, 56] have estimated and reports risk estimates. The four other studies [54, 55, 57, 58] only provide p-values and β-coefficients, which makes interpreting the results difficult. Among the longitudinal studies (Table 2) five out of seven studies [18, 53, 59-61] confirmed the cross-sectional studies, and pointed at an increased risk for depression and symptoms of depression after being exposed to bullying at work. Two out of seven longitudinal studies [62, 63] did not confirm that exposure to workplace bullying predicts depression or symptoms of depression. The studies on workplace bullying and cortisol [64-67] (Table 3) were able to discover associations between exposure to workplace bullying and changes in cortisol concentrations. However, the results are not entirely consistent, due to different exposure assessments.
Overall, all studies included in this literature review are based on self-report of both exposure- and outcome information. This designates a clear lack of independence between exposure- and outcome information. Additionally, some studies [53, 63] are pointing at reversed causality, which indicates that mental distress predicts exposure to workplace bullying. Furthermore, since the studies rely on self-report, mood and emotions may have affected the individual perception of being bullied and reporting of the work environment. This could indicate a major limitation of literature, which in these studies may have resulted in reporting bias [69]. In relation to studies on workplace bullying, independent measurements, such as non-self-reported measures of the bullying phenomenon, can be an opportunity to circumvent the markedly problem of reporting bias [69, 70]. To our knowledge, no studies within quantitative workplace bullying research uses other and more independent methods as exposure assessment. This thesis provided the opportunity to use independent information for both exposure and outcome, in terms of a witness approach at work-unit level, and furthermore the use of standardized
workplace bullying and health outcome have not been used before in a longitudinal perspective.
1) To examine the risk of depression according to workplace bullying measured by
(a) The self-labeling method.
(b) Witnesses’ reports to identify the occurrence and intensity of bullying at work-unit level.
2) To investigate changes in morning and evening cortisol concentrations (a) After exposure to workplace bullying.
(b) After a discontinuance of exposure to workplace bullying.
3) To investigate reactivity and recovery of the HPA-axis measured by saliva cortisol induced by a standardized bicycle exercise challenge test
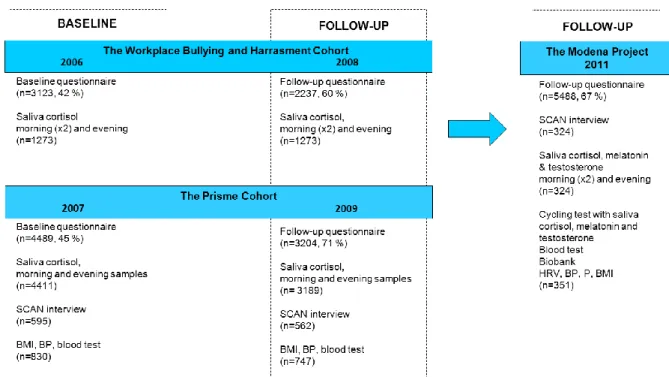
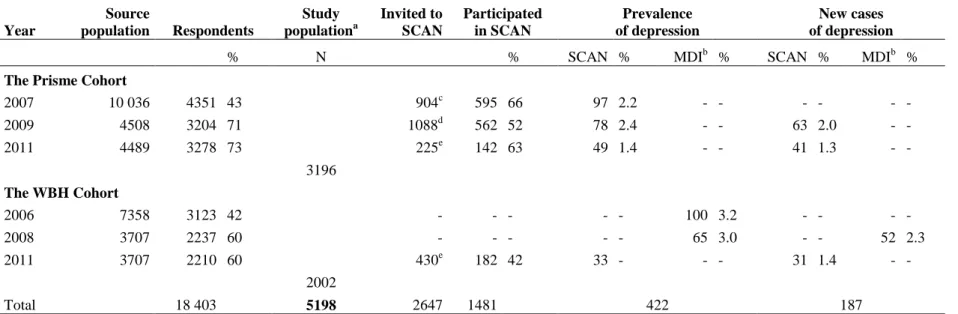
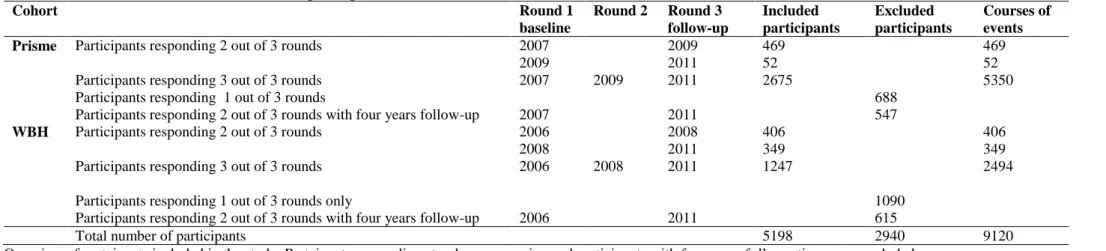
The papers are based on data from two Danish cohorts: The Workplace Bullying and Harassment Cohort (WBH) [71] and the PRISME Cohort [70]. The WBH Cohort was measured in 2006 (response rate 42%) with a follow-up in 2008 (response rate 60%). The PRISME Cohort was measured in 2007 (response rate 45%) with a follow-up in 2009 (response rate 71%). In 2010, the two cohorts were merged into the Modena Project, and in 2011 they were assessed a third time (Table 1, Paper I and Paper II). In 2011, a random sample was selected in order to complete a clinical examination and SCAN-interviews (described below in details in Screening criteria for SCAN-interview). Figure 2 gives an overview of the whole cohort material.
Workplace bullying was measured by the self-labeling method. Participants were presented with the definition by Einarsen (1996) followed by the question “Have you been exposed to bullying at your current workplace within the past 6 months?” [6]. The participants answered on a five-point scale of
Never, Now and again, Monthly, Weekly and Daily. In line with international research we created a three-level exposure variable with the following categories: Never Bullied, Occasional Bullied (comprising the response categories Now and again and Monthly) and Frequently Bullied (comprising the response categories Weekly and Daily) (Paper I, II, III).
Witnessing workplace bullying was measured by self-report. The participants were presented with the definition by Einarsen(1996)and asked whether or not they had witnessed a colleague being bullied at work during the past 6 months [6]. The participants answered on a five-point scale with the following categories: Never, Now and again, Monthly, Weekly and Daily. The responses were dichotomized between Now and again and Monthly. The proportion of witnesses per work-unit was then estimated and the value was assigned to all employees working at the work-unit (Paper I).
The participants were affiliated with one out of a total of 455 work-units. All work-units were organized into four groups according to the proportion of employees who witnessed workplace bullying: 0% witnesses (n=683), 1-20% witnesses (n= 2,274), 21-30% witnesses (n=1,353), and >30% witnesses (n=
Åstrand’s Standardized Method was used as physical activity to estimate aerobic fitness during a sub-maximal workload [72]. This was done with a bicycle ergometer. The initial workload was estimated based on each participant’s age and usual activity level. Heart-rates were measured using a heart-rate monitor. The goal was to achieve a heart-rate that would be 60% of maximal heart-rate reserve capacity, and at least 120 bpm. Subsequently, the workload and corresponding heart-rate were used to estimate VO2-max using the Åstrand-Rhyming Nomogram with a correction for age [72] (Paper III).
Depression was assessed by SCAN-interviews among respondents who satisfied the screening criteria (See Screening criteria for SCAN-Interview). The following sections of Part I were used: Section 3 (Worrying and Tension), Section 4 (Panic anxiety and Phobias), and Sections 6-8 (Depression). The interview focused on the previous 3-5 months and was computer aided and semi-structured [73, 74]. As illustrated in Figure 2, SCAN-interviews were conducted in the PRISME Cohort in 2007 and 2009, and again in 2011 in the merged Modena Project. At all occasions, the SCAN-interviews were conducted in the spring, three to six months after the main questionnaires had been completed. In line with the SCAN-interview clinical depression was assessed by MDI in the WBH Cohort in 2006 and 2008 (Paper I). The MDI is validated as a measure of depression in line with SCAN-interviews [75]. The MDI is a self-rated questionnaire with an algorithm that leads to ICD-10 categories of Moderate to Severe depression. The MDI consists of 10 items, where items 8 and 10 have an additional sub-item. The MDI assesses the ICD-10 symptoms of depression. Each item measures the presence of symptoms during the past two weeks on a scale ranging from 0 (the symptom has not been present at all) to 5 (the symptom is present all the time). The algorithm includes core and accompanying symptoms, and each symptom is dichotomized to indicate its presence (coded as 1) or absence (coded as
0).The questionnaire consists of 12 questions and it includes 2 algorithms, which classify participants with risk of unipolar depression (Mild, Moderate or Severe) according to the ICD-10 definition, dichotomized into depression or not by a cut-off ≥20 [75].
Symptoms of depression in the PRISME Cohort were assessed by the CMDQ [37], whereas in the WBH Cohort, symptoms of depression were measured with the MDI [75]. In the merged Modena Project, depressive symptoms were measured with the CMDQ. When assessing depressive symptoms with the CMDQ, the participants were asked six questions (27, 28, 29, 30, 31 and 32) about their experiences during the last four weeks, giving their answers on a five-point scale ranging from Not at all, Sometimes, Occasionally, Frequently to
Very often. The answers were dichotomized between Not at all and Sometimes
(coded as 0), and Occasionally, Frequently and Very often (coded as 1). Participants with a sum score of 3 or higher on the six items were classified as having symptoms of depression. The MDI algorithm for depressive symptoms is used as described above with an MDI sum score. Participants with an MDI score of > 10 were classified as having depressive symptoms (supplementary analysis) [75].
Saliva cortisol was provided by participants from both the WBH- and the PRISME Cohort at all occasions. The respondents were instructed to provide two saliva samples. The first sample was to be taken in the morning +30 minutes after awakening and the second sample in the evening at 8 PM (Paper II). Respondents who participated in the laboratory cycling test provided samples of saliva cortisol three times; at the start of the cycling test, at the end of the cycling test, and two hours after the cycling test. The sample of Bullied
was distributed into three groups according to their bullied status within the past 12 months (baseline) and on the test day (See Figure 1, Paper II). Three exposure groups were distributed as follows: group A: Bullied at baseline and
answering Never bullied on the test day (morning sample n=40/afternoon sample n=45), group B: Bullied at baseline and answering Sometimes- or
Monthly bullied on the test day (morning sample n=20/afternoon sample
n=21), group C: Bullied at baseline and answering Weekly- or Daily bullied on the test day (morning sample n=4/afternoon sample n=7). The random sample (morning sample n=68/afternoon sample n=105) was used as reference group (See Figure 1, Paper III).
In 2007, the following four screening criteria were used to select respondents for the SCAN-interviews (n=595): 1) symptoms of depression (point score of ≥3 on ≥3 of the six depressive symptoms items from the SCL-DEP6 [37],
n=311), 2) A random sample of people with symptoms of burnout (with a mean score of ≥4 on the Copenhagen Burn-out Inventory, n=80); 3) Stress symptoms (with a mean score of ≥2.5 on the Perceived Stress Scale, n=79); and 4) A random sample (n=434). The screening criteria from 2007 are also described in Kolstad et al. 2011 [70].
In 2009, the following four criteria for SCAN-interviews (n=562) were: 1) Depressive, stress or burnout symptoms based on the questionnaires from 2009 (n=599), 2) ICD-10 depression diagnosed with the SCAN interviews in 2007 (n=71), 3) A random sample of people from the random sample in 2007 (n=201), and 4) People who reported high psycho-social load (n=167).
In 2011, the screening criteria for SCAN-interviews were developed from the criteria from 2007 and 2009. The used screening criteria were (n=655): 1) Exposure to at least one out of 11 Negative Acts of bullying weekly or more frequently, or perceived workplace bullying monthly or more often during the past 12 months (n=207), 2) Depressive symptoms (n=246), 3) Anxiety symptoms (point score of >2 of the three anxiety symptoms items, n=186). The final criterion was: 4) A random sample (n=220). The four screenings groups were overlapping.
To utilize the cohort material, respondents were organized as courses of events. This was done in both Paper I and Paper II. This meant that those who participated at all three occasions could be included twice in our analysis. For example, a respondent who participated in 2007, 2009 and 2011 would be included with two courses; one course with baseline in 2007 and follow-up in 2009 and a second course with baseline in 2009 and follow-up in 2011. For
Paper I and Paper II the included courses are different with respect to the aims of the papers. The inclusion criteria are described in the papers.
In line with the different aims of the papers different confounders were included in the respective analyses. In Paper I we included the following confounders from the baseline questionnaire: Gender, age (≤34, 35-44, 45-54, ≥55), previous episodes of depression (Yes or No), family history of depression (Yes or No), years of education beyond primary or high school (<3/3-4/>4), weekly alcohol consumption (≤14 [for females] and ≤21 [for males]), depressive symptoms (rating of ≥3 on <2, ≥2 questions from the SCL-DEP6 [37] or MDI score of >10), and smoking (Never, Ex-smoker, Smoker). Among the respondents in the Prisme Cohort we controlled for personality traits based on the shortened version of the Eysenck Short-form Personality Questionnaire (EPQ-S) [76, 77] measuring extraversion and neuroticism. Among the respondents in the WBH Cohort we also controlled for personality traits with the scale Sense of Coherence (SOC) [78] based on Antonovsky's Concept [79]. In Paper II we included changes within respondents from baseline to follow-up in the following confounders: Smoking (Never, Ex-smoker, Smoker), weekly alcohol consumption (≤14 [for females] and ≤21 [for males]), BMI, and years of education beyond primary or high school (<3/3-4/>4). Furthermore, we included sample time + sample time2 and time of awakening. In Paper III all analyses were adjusted for age, gender and sample time of the day.
In Paper I logistic regression was used to examine risk of new-onset depression by self-labeling but also among the proportion of employees who witnessed bullying in their work-units at baseline. In Paper II we used self-labeling of workplace bullying as exposure and investigated if cortisol change was in line with the change of the self-labeling. This was done with a multi-level mixed-effects linear regression model. In Paper IIIapaired sample t-test was used to investigate changes between cortisol levels measured in the cycling test, within the random sample. A one-way ANOVA was conducted to investigate potential differences in the relation to the response between sub-groups in the random sample, and to investigate differences in cortisol reactivity and recovery between Bullied and Non-bullied people.
In the Modena Project the prevalence of workplace bullying (Table 4) decreased during the study period from the first round, in 2006-2007, to the third round in 2011. This was the case for both Occasionally Bullied and
Frequently Bullied.
Table 4
Prevalence of bullying in the Modena database
1st round 2nd round 3rd round
n % n % n %
Never Bullied 6802 90.7 4763 93.10 4736 94.7
Occasionally Bullied 611 8.1 317 6.2 232 4.6
Frequently Bullied 89 1.2 36 0.7 32 0.6
The prospective association between self-labeled workplace bullying and the risk of new-onset depression showed an increased risk for both Occasionally Bullied (OR 2.17 [95% CI: 1.11-4.23]) and Frequently Bullied (OR 9.63 [95% CI: 3.42–27.10]) (Table 5, Paper I).
The prospective association between the proportion of employees, who witnessed workplace bullying at baseline and the risk of new-onset depression after 2 years, showed not to support that witnessing bullying at work-unit level predicts new-onset depression. The risk of depression was estimated according to the exposure groups with 1-20% witnesses (OR 0.91 [95% CI: 0.51-1.64]), 21-30% (OR 0.81 [95% CI: 0.43-1.53]) and >30% (OR 0.89 [95% CI: 0.46-1.73]) (Table 6, Paper I).
The prospective association between self-labeled workplace bullying and the risk of symptoms of depression showed an increased risk of symptoms of depression among both Occasionally Bullied (OR 2.42 [95% CI: 1.92-3.04]) and
Table 5 Risk of symptoms of depression by self-labeled workplace bullying Perceived
workplace bullying
n
New cases of with depressive
symptoms % OR adj.OR a 95 % CI
Never Bullied 8868 1546 17.4 1.0 - -
Occasionally Bullied 551 176 31.9 2.29 2.42 1.92-3.04
Frequently Bullied 65 24 36.9 2.80 2.13 1.11-4.10
aAdjusted for age, gender, earlier depression, symptoms of depression, family history
of depression, higher education, alcohol, and smoking.
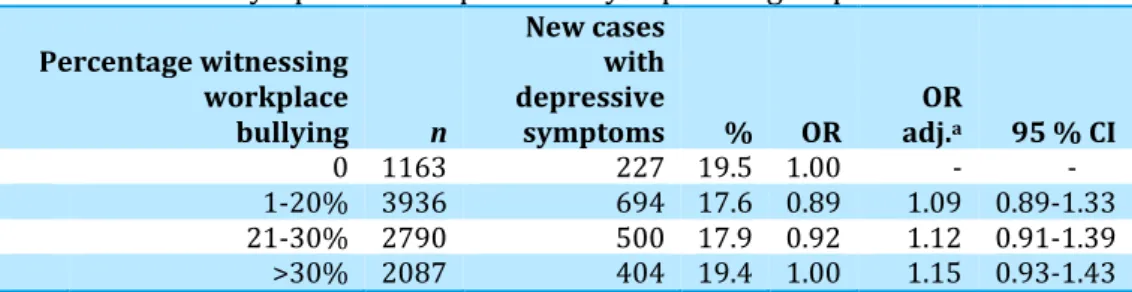
The prospective association between the proportion of employees who had witnessed workplace bullying at baseline, and the risk of symptoms of depression after two years did not show significant increased risk of depressive symptoms: 1-20% witnesses (OR 1.09 [95% CI 0.89-1.33]), 21-30% (OR 1.12 [95% CI 0.94-1.39]) and >21-30% (OR 1.15 [95% CI 0.93-1.43]) (See Table 6).
aAdjusted for age, gender, earlier depression, depressive symptoms, family history of
depression, higher education, alcohol, and smoking.
Table 6 Risk of symptoms of depression by exposure groups Percentage witnessing
workplace bullying n
New cases with depressive
symptoms % OR adj.OR a 95 % CI
0 1163 227 19.5 1.00 - - 1-20% 3936 694 17.6 0.89 1.09 0.89-1.33 21-30% 2790 500 17.9 0.92 1.12 0.91-1.39 >30% 2087 404 19.4 1.00 1.15 0.93-1.43
Exposure to workplace bullying showed no significant change in either morning or evening cortisol levels, when respondents changed their self-labeling from Never Bullied to Bullied after approximately two years (Table 3,
Paper II).
A discontinuance of workplace bullying showed a significant decrease in the cortisol morning sample among Occasionally Bullied in the PRISME Cohort. However, no significant changes were discovered in any of the samples (Table 5, Paper II).
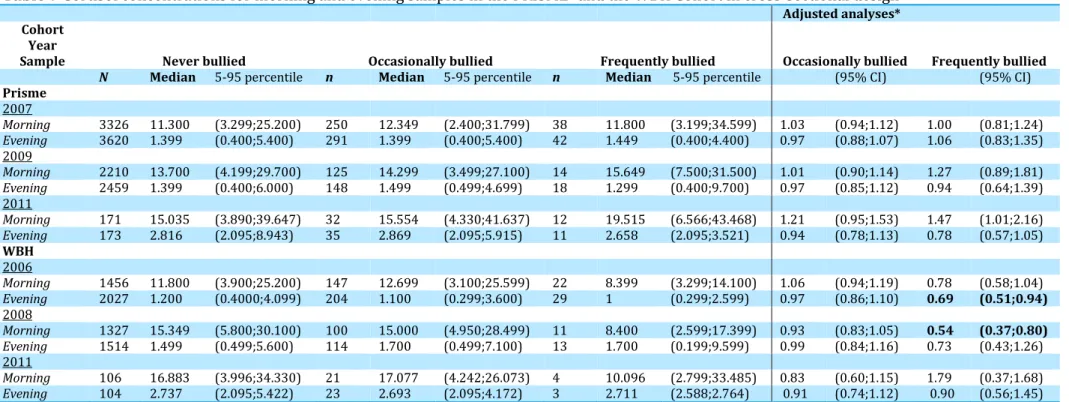
Table 7 presents cross-sectional analysis for morning and evening cortisol levels for participants in the PRISME- and the WBH Cohort. The adjusted values are log transformed cortisol values estimated by linear regression controlled for confounders. The adjusted estimates are differences in percent from the reference group. For the Occasionally Bullied no statistical significant results were found. However, a statistical significant difference was discovered among the Frequently bullied in the WBH Cohort for the evening values of 2006 (0.69 (95% CI 0.5-0.94) and the morning values of 2008 (0.54 (95% CI 0.37-0.80).
In the random sample the reactivity during the cycling test was 0.17 (±1.13 SD) and the mean recovery was 0.78 (±3.59 SD). The random sample was separated into the morning sample (n=68, 72% females) and the afternoon sample (n=105, 64% females). In the morning sample, there was no significant increase in cortisol reactivity (p=0.6645, 95% CI -0.346-0.222), whereas there was a significant decrease in cortisol recovery (p=0.0178, 95% CI 0.1818-1.8288). In the afternoon group, there was no significant increase in cortisol reactivity (p=0.0528, 95% CI -0.483-0.003) or in cortisol recovery (p=0.2022, 95% CI -0.341-1.5807).
In the morning, sample cortisol reactivity increased within the reference group (0.06, (Std.D 1.07)), whereas group A, B and C each had a decrease in the mean cortisol levels (group A: -0.12 (Std.D 1.20), group B: -0.07 (Std.D 1.31), and group C: -1.15 (Std.D 1.14)). There were no significant differences in reactivity between the reference group, group A and group B, whereas group C was significantly different from the reference group (p=0.029). Cortisol recovery mean values increased within all four groups (Reference group: 1.01 (Std.D 2.86), group A: 1.04 (Std.D 2.84), group B: 0.30 (Std.D 1.26), and group C: 0.72 (Std.D 2.04)) and no significant differences were found between the groups (Table 4, Paper III).
In the afternoon, cortisol reactivity increased within the reference group (0.24 (Std.D 1.17) and group C (0.27 (Std.D 0.55), whereas a decrease was found in group A (-0.31 (Std.D 0.71) and B (-0.15 (Std.D 0.50). There were no significant differences in reactivity between the reference group, group B and C, whereas group A was significantly different from the reference group (p=0.003). Cortisol recovery increased within all four groups (Reference group: 0.62 (Std.D 4.03), Group A: 0.82 (Std.D 2.66), Group B: 0.25 (Std.D 0.50), and Group C: 2.26 (Std.D 3.75)) and no significant differences were found between the groups (Table 5, Paper III).
Table 7 Cortisol concentrations for morning and evening samples in the PRISME- and the WBH Cohort in cross-sectional design Adjusted analyses* Cohort
Year
Sample Never bullied Occasionally bullied Frequently bullied Occasionally bullied Frequently bullied N Median 5-95 percentile n Median 5-95 percentile n Median 5-95 percentile (95% CI) (95% CI)
Prisme
2007
Morning 3326 11.300 (3.299;25.200) 250 12.349 (2.400;31.799) 38 11.800 (3.199;34.599) 1.03 (0.94;1.12) 1.00 (0.81;1.24)
Evening 3620 1.399 (0.400;5.400) 291 1.399 (0.400;5.400) 42 1.449 (0.400;4.400) 0.97 (0.88;1.07) 1.06 (0.83;1.35)
2009
Morning 2210 13.700 (4.199;29.700) 125 14.299 (3.499;27.100) 14 15.649 (7.500;31.500) 1.01 (0.90;1.14) 1.27 (0.89;1.81)
Evening 2459 1.399 (0.400;6.000) 148 1.499 (0.499;4.699) 18 1.299 (0.400;9.700) 0.97 (0.85;1.12) 0.94 (0.64;1.39)
2011
Morning 171 15.035 (3.890;39.647) 32 15.554 (4.330;41.637) 12 19.515 (6.566;43.468) 1.21 (0.95;1.53) 1.47 (1.01;2.16)
Evening 173 2.816 (2.095;8.943) 35 2.869 (2.095;5.915) 11 2.658 (2.095;3.521) 0.94 (0.78;1.13) 0.78 (0.57;1.05)
WBH
2006
Morning 1456 11.800 (3.900;25.200) 147 12.699 (3.100;25.599) 22 8.399 (3.299;14.100) 1.06 (0.94;1.19) 0.78 (0.58;1.04)
Evening 2027 1.200 (0.4000;4.099) 204 1.100 (0.299;3.600) 29 1 (0.299;2.599) 0.97 (0.86;1.10) 0.69 (0.51;0.94)
2008
Morning 1327 15.349 (5.800;30.100) 100 15.000 (4.950;28.499) 11 8.400 (2.599;17.399) 0.93 (0.83;1.05) 0.54 (0.37;0.80)
Evening 1514 1.499 (0.499;5.600) 114 1.700 (0.499;7.100) 13 1.700 (0.199;9.599) 0.99 (0.84;1.16) 0.73 (0.43;1.26)
2011
Morning 106 16.883 (3.996;34.330) 21 17.077 (4.242;26.073) 4 10.096 (2.799;33.485) 0.83 (0.60;1.15) 1.79 (0.37;1.68)
Evening 104 2.737 (2.095;5.422) 23 2.693 (2.095;4.172) 3 2.711 (2.588;2.764) 0.91 (0.74;1.12) 0.90 (0.56;1.45)
*Adjusted analysis of log transformed cortisol values are showing differences in percent from reference group. Included confounders gender, age, education, BMI, smoking, alcohol,