Abstract—Mathematics is a discipline that appears on the syllabus of many courses, including courses in engineering, where it is essential to the formation of all future engineers, whatever their field of study and work. Despite that, engineering students tend to reveal difficulties with course units based on mathematics. The factors that influence learning mathematics have been the subject of study for several researchers around the world. Researchers attempt to identify variables that explain mathematics achievement, but fail to address university students.
In this paper, an exploratory study based on engineering students of University of Minho, concerning their grades in statistics and numerical methods curricular units is presented. The aim of this study is to explore the mathematics achievement in the process of learning mathematical concepts. The preliminary results show that gender is an unexpected and significant factor.
Index Terms—Engineering university students, gender, mathematics achievement, mathematics learning factors, numerical methods unit.
I. INTRODUCTION
NGINEERING plays a significant role in the modern world since it is always presented in day to day activities concerning construction, computers, technology, energy, electronic devices, and manufacturing process. Many aspects of engineering activity comprehend the correct problem formulation and analysis, and the choice of the adequate method to solve it.
Engineering courses require the awareness of mathematical concepts. During the course, students learn and consolidate basic mathematical principles in order to solve practical problems. As part of their formal undergraduate training, engineering students should enhance knowledge in several mathematical based areas such as statistics, numerical methods, optimization and simulation, among many others. These are important techniques that engineering students need to know how to use.
Unfortunately, engineering students tend to struggle with their mathematical background and fail to recognize the
Manuscript received March 18, 2012; revised April 10, 2012. This work is supported by FEDER Funds through the Operational Programme Competitiveness Factors – COMPETE, and National Funds through FCT - Foundation for Science and Technology under the Project: FCOMP-01-0124-FEDER-022674.
M. Alves, C.S. Rodrigues and A.M.A.C. Rocha are with Algoritmi R&D Centre, Engineering School, University Minho, Campus Gualtar, 4710-057 Braga, Portugal (corresponding author e-mail: [email protected], [email protected], [email protected] ).
importance of these subjects. According to authors experience as statistics and numerical methods teachers, student grades’ reveals difficulties and motivational issues that go far beyond the required mathematical knowledge.
This paper is organized as follows. In Section II a literature review is presented, summarizing some of the factors that could influence the learning of mathematics. Following, in Section III, the obtained results of an exploratory study concerning statistics and numerical methods grades of engineering students from University of Minho are presented. Section IV, summarizes the most relevant conclusions and gives some ideas for the future work.
II. MATHEMATICS LEARNING FACTORS
Student performance is a concern for all educators and is an object of study that stands out in many research papers. Due the importance of mathematics, its achievement and performance gained educators attention and has been an increasing field of study. There have been several researchers who have discussed the issue of mathematics learning and the factors influencing it. The factors identified as influencing the learning of mathematics can be divided into two distinct groups: the demographic and psychographic factors [1].
In the demographic factors we remark the gender factor that could explain differences in academic performance. Since 1970s, gender has been investigated as a factor on which student performance and attitude toward mathematics differ [2]. It is a general perception that boys are better at math than girls. However, studies on gender and mathematics show that the advantage held by boys over girls in mathematics achievement has diminished markedly over the last 40 years and gender differences in mathematics achievement are no longer a relevant issue [3]. According to the same studies, research on gender and mathematics is often limited to the relationship between gender differences in attitudes toward mathematics and gender differences in mathematics achievement. However, the gender alone may not explain significant differences in performance when viewed in the context of multiple types of mathematical knowledge [2].
In the psychographic factors we point out the personality, socio-cognitive aspects, the motivation, and the anxiety towards mathematics. The learning of mathematics is related to personality traits and these are considered as predictors of students' mathematical ability [4]. The socio-cognitive aspects are considered to be the most important in the
Engineering Students and Mathematics
Achievement: a Portuguese Case Study
Manuela Alves, Cristina S. Rodrigues, and Ana Maria A. C. Rocha
process of teaching and learning. Related to these are also the emotional aspects [5]. There are several studies that show that self-efficacy is highly applicable to the educational context [6]. The self-efficacy is closely linked to motivation. Stronger self-efficacy beliefs of the individual, lead to a major motivation for performing tasks [7], [8]. Attitude towards mathematics can interfere with future self-esteem, identity formation and relationship with the utility of this discipline in the profession [9], [10].
The mathematical beliefs and the results obtained by university students, show there are several evidences that students’ beliefs about mathematics are crucial in the development of careers related to this discipline [11].
The motivation is the driving force behind these actions and affects the needs, desires and ambitions in life. Hence, there must be an effort by educators to stimulate the students' attitudes and motivation towards learning. This will lead them to achieve the best results [10].
Another factor that influences students' motivation for learning mathematics is the perception that parents have of mathematics [12].
The anxiety is another highlighted factor that influences the learning of mathematics. There are consequences of the fact that students are anxious about mathematics, and this interferes with their academic achievement. Students who suffer from math anxiety typically refuse to enroll in courses or attending mathematics courses with a strong mathematical component that will condition their future career options. The mathematical anxiety is the result of low self-esteem and fear of failure [13], [3]. Mathematics anxiety has also been associated to gender. Male students suffered less anxiety dealing with mathematic task than female and they are more confident and motivated at mathematic than female students [14]. Mathematics anxiety among engineering students is manifested into five dimensions, namely: (a) Fell mathematics is a difficult subject; (b) Always fail in mathematics; (c) Always writing down in a mathematics class; (d) Anxious if don’t understand; and (e) Lost of interest in the subjects of mathematics [14].
III. METHODOLOGY AND SAMPLE
A. Objectives
The purpose of this study is to explore the mathematics achievement of undergraduate engineer students in the complex process of learning mathematical concepts. We intend to use information related to grades of a mathematics based course unit and to examine outcomes focusing on students’ variables such gender and previous mathematics behavior.
B. Data Source
Data for the current study were obtained using students’ grades from the University of Minho. In order to choose the discipline, we defined a single condition: it had to be a based mathematics discipline of a curriculum of an engineering course. From the different available possibilities the numerical methods unit was selected in order to analyze
the student’s grades. Numerical methods unit is concerned with finding approximate numerical solutions to problems for which exist a lack sufficient data or have no analytic solution. It is a required unit for engineering programs, and besides its mathematical nature, the numerical techniques learned in this unit enable students to understand the type of problem and how to solve it with the appropriate numerical method and corresponding computational tool.
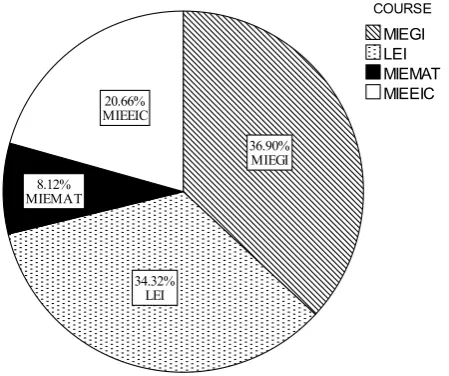
The subset of students used in this study was obtained from four different engineering degree courses: 1) integrated Master in Engineering and Industrial Management (MIEGI); 2) degree in Computer Engineering (LEI); 3) integrated Master in Materials Engineering (MIEMAT), and 4) integrated Masters in Industrial Electronics and Computers Engineering (MIEEIC).
From among those students, we choose only those who attended the numerical methods unit until the end, during years 2010 and 2011.
C. Student Variables
The student variables included in the study were determined on the basis of grade information:
1. Engineering degree course
2. Grade from numerical methods curricular unit 3. Duration: one semester or half semester 4. Student gender
In order to obtain a measure of past behavior, and since numerical methods unit at University of Minho are normally preceded by an applied statistics unit, a fifth variable was considered:
5. Grade from previous applied statistics discipline (past behavior)
D. Sample Characterization
[image:2.595.316.541.511.699.2]The final sample is N=271, of which 36.90% in MIEGI area, 34.32% in LEI, 8.12% in MIEMAT and 20.66% in MIEEIC (Fig. 1).
Fig. 1. Sample engineering degree courses.
Concerning the gender factor, from Fig. 2 we can see that the sample is mainly masculine: 75.28% against 24.72% female students.
the selected courses. Since Powell [15] explained, the less emphasis on heavy engineering and machinery, and more focus on computers, mathematical models and electronics combined with adequate guidance counseling prior to entering university contributed to attract women to engineering degree courses.
Fig. 2. Sample gender distribution.
The sample numerical methods grades have a mean of 10.82 values (using a 0-20 scale) and a standard deviation 4.504 (with a minimum of 1 and a maximum of 20).
[image:3.595.57.265.140.321.2] [image:3.595.313.558.329.389.2]The grade performance considering gender is distinct. Fig. 3 suggests two different patterns for female and male students, with grades from male students more disperse. The female boxplot identifies a group of outliers, i.e., a group of observations lower than the rest of the female data.
Fig. 3. Grades distribution by gender.
Posterior independent t tests confirmed differences between mean gender results (significance level of 1%).
Exploring grade mean differences, visual differences between engineering degree courses were identified (see Fig. 4).
Fig. 4. Mean grades by engineering degree courses.
An ANOVA procedure (Fig. 5) confirmed the significant mean differences between engineering degree courses (with a significance level of 1%).
Fig. 5. ANOVA.
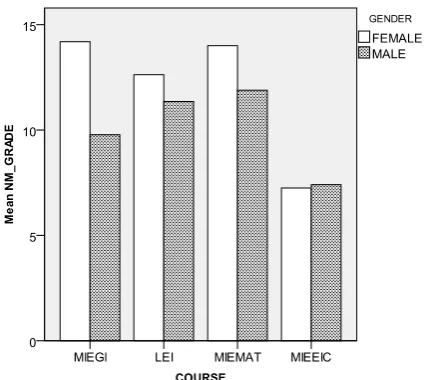
When considering gender differences, Fig. 6 show that female students present higher mean grades. The only exception is the MIEEIC degree course, with similar average for male and female students.
Fig. 6. Sample mean grades by course and gender
[image:3.595.51.282.456.638.2] [image:3.595.309.523.467.657.2]standard deviation of 4.421 (see Table I).
TABLE I
STUDENT OUTCOME STATISTICS BY DISCIPLINE DURATION
NM_DURATION N Mean S td.
Deviation Minimum Maximum
SEM ESTER 193 11,55 4,340 2 20
HALF SEM ESTER 78 9,01 4,421 1 17
Total 271 10,82 4,504 1 20
Report NM _GRADE
Independent t tests confirmed significant mean differences (with significance level of 1%). This result can be an important argument into the discussion of the appropriated duration of a numerical methods unit.
[image:4.595.50.284.277.459.2]Fig. 7 illustrates the grade performance considering duration of discipline. It is interesting to notice the visual differences between a semester unit and a half semester unit.
Fig. 7. Grade distribution by discipline duration.
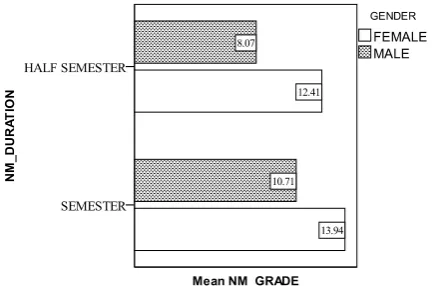
[image:4.595.51.271.521.664.2]The results presented in Fig. 8, also indicated a pattern of higher mean grades from female students.
Fig. 8. Sample mean grades by duration and gender.
IV. HYPOTHETICAL MODELS
This research intends to examine and predict numerical methods discipline outcomes. In order to accomplish that, we will use two procedures:
1. a linear regression to predict student’s grade in numerical methods unit
2. a logistic regression to predict student’s success or
failure in numerical methods unit A. Linear Regression
Since previous analyses indicated differences by duration, we decided to use the two different levels of analysis for the linear regression procedure: 1) one semester duration [N=193], and 2) half semester duration [N=78].
The linear regression procedure used as dependent variable the grade of numerical methods unit and as independent variables: gender (dummy variable 0=male, 1=female) and the grade of applied statistics unit (continuous variable).
Table II resumes the outputs for the linear regression considering a one semester unit.
TABLE II
PREDICTING NUMERICAL METHODS GRADE (SEMESTER)
Model
R NM_DURATION
= SEMESTER (Se lected)
R Square Adjuste d
R Square
Std. Error of the Estimate
1 0,604 0,364 0,358 3,478
a. Predictors: (Constant), EST_GRADE, FEMALE
Sum of Squares df
Mean
Square F Sig.
Regression 1317,950 2 658,975 54,488 ,000 Residual 2297,832 190 12,094
Total 3615,782 192
Standardized Coefficients
B Std.
Error Beta
(Constant) 4,365 ,779 5,602 ,000
FEMALE 1,344 ,610 ,136 2,202 ,029
EST_GRADE ,651 ,074 ,542 8,780 ,000
Dependent variable: MN_GRADE (A SEMESTER DURATION)
Model Summary
1
ANOVA Model
1
Coe fficie nts
Model
Unstandardize d Coe fficie nts
t Sig.
As it can be seen from Table II, the considered linear model may predict numerical methods unit grades with an adjusted R square of 0.358 and F=54.488 (significant to a significance level of 1%). The independent variables are both significant and present one positive increase in the grade of numerical methods: “being a female” has a positive effect of plus 1.344 values, and one value increase in the grade of applied statistics has a positive effect of plus 0.651 values.
From Table III, related to half semester, the results are also significant with an adjusted R square of 0.272 and F=15.370 (significance level of 1%). Both independent variables are significant, but the most key predictor is “being a female” with an impact on grades of 4.022 values.
TABLE III
PREDICTING NUMERICAL METHODS GRADE (HALF SEMESTER)
Model
R NM_DURATION
= HALF SEMESTER (Se lected) R Square Adjuste d R Square
Std. Error of the Estimate
1 0,539 0,291 0,272 3,773
a. Predictors: (Constant), EST_GRADE, FEMALE
Sum of Squares df
Mean
Square F Sig.
Regression 437,510 2 218,755 15,370 ,000 Residual 1067,478 75 14,233
Total 1504,987 77
Standardized Coefficients
B Std.
Error Beta
(Constant) 3,312 1,400 2,367 ,021
FEMALE 4,022 1,039 ,378 3,873 ,000
EST_GRADE ,419 ,116 ,353 3,619 ,001
Dependent variable: MN_GRADE (HALF SEMESTER DURATION)
Model Summary
1
ANOVA Model
1
Coe fficie nts
Model
Unstandardize d Coe fficie nts
t Sig.
Nevertheless, both models (semester and half semester) have a lower capacity, which suggests that we need to improve the linear model with the test of additional variables proposed on literature (i.e., psychographic variables).
B. Logistic Regression
Since our interesting variable is a dichotomous variable: student’s success or failure, it required the use of a regression technique suitable for analyzing data with categorical dependent variable.
The dependent variable, student’s success, resulted from converting the course grade into a multinomial variable involving two categories:
1. Less than 10 values (failure)
2. Equal or superior to 10 values (success)
The independent variables are gender (dummy variable 0=male, 1=female), curricular unit duration (dummy variable 0=half semester, 1=semester) and applied statistics grade’s (continuous variable).
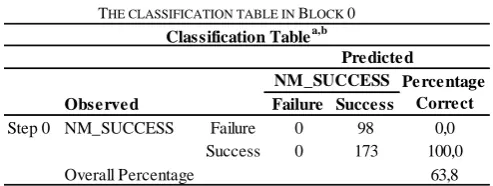
Table IV presents the results with only the constant included before any coefficients are entered into the equation. The table indicates an overall correct percentage of 63.8%.
TABLE IV
THE CLASSIFICATION TABLE IN BLOCK 0
Observe d Failure Success
NM_SUCCESS Failure 0 98 0,0
Success 0 173 100,0
Overall Percentage 63,8
a Constant is included in the model. b The cut value is .500.
NM_SUCCESS Predicte d
Pe rce ntage Correct Step 0
Classification Tablea,b
The results presented in Table V indicate that all independent variables are significant and will improve the model.
TABLE V
VARIABLES NOT IN THE EQUATION TABLE IN BLOCK 0
Score df. Sig.
Variables EST_GRADE 34,192 1 ,000
GENDER(1) 22,621 1 ,000
NM_DURATION(1) 14,836 1 ,000
Overall Statistics 64,223 3 ,000
Step 0
Variables not in the Equation
Table VI presents the results when the predictors are included. By adding the variables we can now predict with 73.4% accuracy. In this study, 52% were correctly classified for the Failure group and 85.5% for the Success group. This is an interesting improvement and suggests that the model is a better mode.
TABLE VI
CLASSIFICATION TABLE (ENTER METHOD)
Observe d Failure Success
NM_SUCCESS Failure 51 47 52,0
Success 25 148 85,5
Overall Percentage 73,4
a The cut value is .500.
Classification Tablea
Predicte d
NM_SUCCESS Pe rce ntage Correct Step 1
Results from Table VII suggest that all variables contributed significantly to the prediction (p < .01). Since all variables present an Exp(B) superior than 1, then the odds of an outcome occurring increase. For example, in a numerical methods unit of a semester the odds ratio is 4.684 times as large, and therefore students are 4.684 times likely to belong to the Success group. In addition to that, female students are 4.259 times more likely to belong to the Success group.
TABLE VII
VARIABLES IN THE EQUATION (ENTER METHOD)
B S.E. Wald df Sig. Exp(B)
EST_GRADE ,233 ,044 27,753 1 ,000 1,262
GENDER(1) 1,449 ,439 10,920 1 ,001 4,259
NM_DURATION(1) 1,544 ,331 21,712 1 ,000 4,684
Constant -3,197 ,586 29,758 1 ,000 ,041
a Variable(s) entered on step1: EST_GRADE, GENDER, NM_DURATION.
Variables in the Equation
Step 1a
The logistic coefficients can be used to create a predictive equation. In our study resulted the following equation
.233 1.449 1.544 3.197
1 197 . 3 544 . 1 449 . 1 233 . sem fem est e sem fem est e
P (1)
As an example, let us imagine a student attending a semester numerical methods discipline with 12 values from previous applied statistics unit. If the student is a girl, the probability that she will be approved is 93%. If the student is a boy the probability falls to 76%. Consider the
[image:5.595.314.561.545.621.2] [image:5.595.55.302.665.758.2]alternative of a half semester discipline. The probability of being approved is 74% for the girl, and just 40% for the boy. This is a very interesting prediction!
V. CONCLUSION
The present study aims to explore the mathematics achievement of graduate engineer students in the complex process of learning mathematical concepts, essentials to their future profession. First, a literature review was done in order to identify the factors that could influence the mathematics performance of general students. Then an investigation focused on mathematics achievements of statistics and numerical methods courses of the master of industrial engineer and management of University of Minho was carried out.
Numerical methods unit is a required curricular unit for engineering programs, and besides its mathematical nature, the numerical techniques learned enable students to understand the type of problem and how to solve it with a computational tool and a numerical method.
This paper examines the outcomes of numerical methods unit from four different engineering degree courses of University of Minho, Portugal, focusing on students’ variables such gender and previous mathematics behavior. Results suggest gender differences, with female students presenting higher scores than their male colleagues. The duration of the unit also presents an impact on students’ grades.
We explore a linear regression to predict student’s grade in numerical methods unit. The modest results of independent variables such gender and previous applied statistics class, suggest that the model should be improved with additional variables (for instance, psychographic variables). The logistic regression to predict student’s success or failure in numerical methods unit, confirms the gender effect and the influence of the discipline duration. We consider these results as preliminary results, which require future evidence with a bigger sample and a comparison with other engineering students.
REFERENCES
[1] V. Suthar, R. A. Tarmizi, C. Midi and M. B. Adam, “Students’ Beliefs on Mathematics and Achievement of University Students: Logistics Regression Analysis,” Procedia - Social and Behavioral Sciences, vol.8, pp. 525-531, 2010.
[2] M. Patterson, E. Perry, C. Decker, R. Eckert, S. Klaus, L. Wendling and E. Papanastasiou, “Factors associated with high school mathematics performance in the United States,” Studies in Educational Evaluation, vol.29, pp. 91-108, 2003.
[3] M. Meelissen and H. Luyten, “The Dutch gender gap in mathematics: Small for achievement, substantial for beliefs and attitudes,” Studies in Educational Evaluation, vol. 34, no. 2, pp.82-93, 2008.
[4] A. Homayouni, “Personality Traits And Emotional Intelligence As Predictors Of Learning English And Math,” Procedia - Social and Behavioral Sciences, vol.30, pp.839-843, 2011
[5] N. Sirmaci, “The relationship between the attitudes towards mathematics and learning styles,” Procedia - Social and Behavioral Sciences, vol. 9, pp. 644-648, 2010.
[6] A. Bandura, “A Teoria Social Cognitiva na Perspectiva da Agência” Teoria Social Cognitiva: conceitos básicos, pp.69-96, 2008. [7] E. M. Torisu and A.C. Ferreira, “A teoria social cognitiva e o
ensino-aprendizagem da matemática: considerações sobre as crenças de autoeficácia matemática,” Ciências & Cognição, vol. 14, no. 3, pp.168-177, 2009.
[8] J. G. Walter and J. Hart, “Understanding the complexities of student motivations in mathematics learning,” The Journal of Mathematical Behavior, vol. 2-3, no. 28, pp. 162-170, 2009.
[9] L. Neves, “Um estudo sobre as relações entre a percepção e as expectativas dos professores dos alunos e o desempenho em matemática,” M.S. thesis, Faculdade de Educação/UNICAMP, Brazil, 2002.
[10] W. Silveira, “Criando ambientes matemáticos com planilhas eletrónicas,” M.S. thesis, Centro Federal de Educação tecnológica Celso Suckow da Fonseca- CEFET/RJ, Rio de Janeiro, Brazil, 2007. [11] K. A. Bakar, R. A. Tarmizi, R. Mahyuddina, H. Eliasa, W.L. Luana
and A.F.M. Ayub, ”Relationships between university students’ achievement motivation, attitude and academic performance in Malaysia,” Procedia - Social and Behavioral Sciences, vol. 2, no. 2, pp. 4906-4910, 2010.
[12] T. Muir, ”Numeracy at Home: Involving Parents in Mathematics Education,” Primary Mathematics, 2009.
[13] M. Kargar, R. A. Tarmizi and S. Bayat, “Relationship between Mathematical Thinking, Mathematics Anxiety and Mathematics Attitudes among University Students,” Procedia - Social and Behavioral Sciences, vol.8, pp.537-542, 2010.
[14] P. Vitasari, T. Herawan, M. N. A. Wahab, A. Othman and S. K. Sinnadurai, ”Exploring Mathematics Anxiety among Engineering students,” Procedia - Social and Behavioral Sciences, vol. 8, pp. 482-489, 2010.