303
©IJRASET: All Rights are Reserved
A Study on Flexural Behaviour of Rectangular
GPC Slabs having Partially Restrained Supports
using ANSYS Software
Sandya S
1, Shivaraj G Nayak
2, Dr R Mourougane
31M.Tech Student, Computer Aided Design of Structures, Department of Civil Engineering, PES College of Engineering, Mandya,
Karnataka
2Assistant Professor, Department of Civil Engineering, PES College of Engineering, Mandya, Karnataka 3Associate Professor, Department of Civil Engineering, Ramaiah Institute of Technology, Bangalore, Karnataka
Abstract: In civil engineering practice reinforced concrete (RC) slabs are considered as an important structural element in enclosing a space with other elements. There were different methods introduced to calculate the ultimate loads that can be carried by a RC slab. Among these ultimate load methods, yield line theory has been widely adopted. Johensen’s yield line theory is used to determine the flexural capacity of a RC slab i.e. capacity of slab excluding membrane forces in the slab. Geopolymer concrete is one of the emerging construction materials as a substitute for conventional cement concrete as it eliminates the usage of ordinary Portland cement (OPC). It is said that production of one tonne of cement emits approximately one tonne of carbon dioxide (co2) into atmosphere. In order to minimize the liberation of CO2 to air, alternative materials have to be used to replace
the cement. Geopolymer concrete is one such material which replaces cement completely by waste materials such as GGBS, fly ash etc. which is also harmful to the atmosphere. This work is aimed to create analytical models of rectangular high strength traditionally vibrated concrete (HSTVC) and high strength geopolymer concrete (HSGPC) slabs with partially restrained support conditions and to carryout analysis in ANSYS software, the obtained results are then compared with that of experimental values. Totally eight slabs of dimensions 1500mm x 1000mm x 65mm are analysed by applying simulated uniformly distributed load. The slabs were divided into two categories, with each category containing four slabs each. First category contained HSTVC and the second category contained HSGPC of grade M60. Here ANSYS V 16.2 software was used to prepare and analyse non-linear finite element models of the test specimens. Load deflection behaviour, ultimate load enhancement beyond Johansen’s load were obtained and compared with that of experimentally obtained values. ANSYS results demonstrate a sensible concurrence with the test yield. From the considered analysis it can be concluded that the ultimate load carrying capacity obtained in ANSYS is more than the experiment.
Keywords: HSTVC, HSGPC, ANSYS, FEM analysis, load deflection behaviour, load enhancement, percentage of reinforcement
I. INTRODUCTION
RC slab is a horizontal structural element made of steel reinforced concrete which nearly consumes forty percent of concrete used for the whole building. The slab is required to carry the applied loads such as dead load, superimposed load, floor finishes etc. which acts directly on the slab. The loads which are acting on the slabs are then transferred to the surrounding supports. Usually the behaviour of slabs is mainly governed by the edge support conditions and slab length along both shorter and longer directions. In present day, construction practice is more dependent on concrete, where OPC is the main constituent. There is a change in the climate due to global warming, which occurs mainly due to the emission of greenhouse gases. Cement production itself contributes
approximately 7% of CO2 globally.In construction field cement is the highly demanded material. But the production of cement
causes the emission of harmful pollutants such as CO2. It is said that 1 tonne of cement production emits approximately 1 tonne of
CO2. Thus alternative materials have to be used to replace the conventional Portland cement in order to minimise the liberation of
CO2 into the atmosphere. Hence geopolymer concrete is one such material which completely replaces the cement by waste materials
304
©IJRASET: All Rights are Reserved
E. To find the load enhancement beyond Johensen’s yield line load.
F. To prove that the properties of GPC are similar to conventional concrete.
III.METHODOLOGY
Intension of the current study is to carryout FEM analysis on all these eight slabs and to compare the results with experimentally obtained results. A discrete model technique was employed to generate the finite element version. ANSYS V16.2 was utilised in the current study to check the overall behaviour of all the slabs.
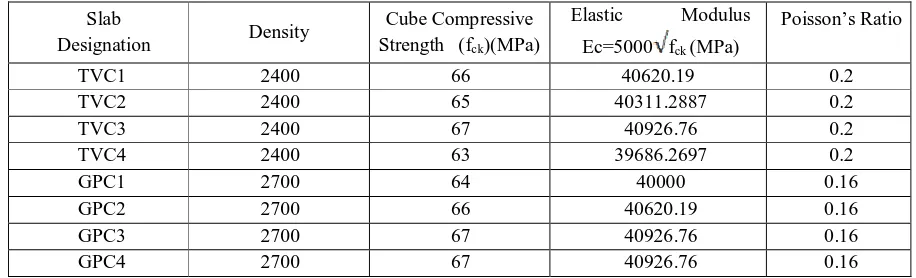
[image:2.595.68.526.355.494.2]A. FEM inputs for concrete
Table I
Density, Cube Compressive Strength, Young’s Modulus And Poisson’s Ratio For Concrete
Slab
Designation Density
Cube Compressive
Strength (fck)(MPa)
Elastic Modulus
Ec=5000 fck (MPa)
Poisson’s Ratio
TVC1 2400 66 40620.19 0.2
TVC2 2400 65 40311.2887 0.2
TVC3 2400 67 40926.76 0.2
TVC4 2400 63 39686.2697 0.2
GPC1 2700 64 40000 0.16
GPC2 2700 66 40620.19 0.16
GPC3 2700 67 40926.76 0.16
GPC4 2700 67 40926.76 0.16
.
B. Geometry of the Slabs
All the slabs used here were of size 1500mmX1000mmX65mm with partially restrained supports. An effective size of the slabs between the supports was taken as 1400x900x65mm. Slabs were reinforced with 6mm diameter Fe550 grade TOR-KARI bars. An effective cover of 20mm was given to the reinforcements. The reinforcement along longer direction is kept as 150mm and along shorter direction it is varied as shown in the table 2.
TABLE II Reinforcement Details
Sl. no Specimen designation Dia of Bar (mm)
Spacing of bars in (mm) Percentage of reinforcement (%)
Coefficient of Orthotropy Shorter Direction Longer direction Shorter Direction Longer direction
1 TVC-1 6 150 150 0.26 0.26 1.00
2 TVC-2 6 120 150 0.30 0.26 0.86
3 TVC-3 6 100 150 0.39 0.26 0.67
4 TVC-4 6 85 150 0.48 0.26 0.54
5 GPC-1 6 150 150 0.26 0.26 1.00
6 GPC-2 6 120 150 0.30 0.26 0.86
7 GPC-3 6 100 150 0.39 0.26 0.67
305
©IJRASET: All Rights are Reserved
Fig. 1 Combined model with varied reinforcement spacing along shorter direction
C. Connections
The connection between the concrete and steel element is given through No-separation which acts as bond between them.
D. Convergence Criterion
The convergence study was carried out on models to check the mesh density. For this study a finite element model is to be divided into a number of discrete elements, and hence the result will converge only if proper numbers of elements are used. In the present study also a convergence study was conducted to determine the mesh density of the element.
E. Loading and Boundary Conditions
All the slabs were subjected to uniformly distributed loading throughout the slab area. The boundary condition is provided in such a way that one longer edge is fixed (i.e. restrained along all the three directions x, y and z) and all other three edges are simply supported (i.e. restrained along y and z directions) so that the downward displacement is detained at the supports.
F. Nonlinear solution
To carry out the nonlinear analysis in ANSYS, the total applying load need to be divided into number of intervals, which are called as load steps. Stiffness of the matrix will be adjusted after the completion of each load step. The alterations done in the stiffness matrix reflects the non-linear changes in the stiffness of structure after the end of each load step. The ANSYS software application uses Newton-Raphson iteration technique to update the stiffness of models. This approach has tolerance limits, which could be assigned for the convergence of each iteration.
IV. RESULTS AND COMPARISON
Load v/s deflection behaviour of both high strength traditionally vibrated concrete and high strength geo polymer concrete slabs from the analytical studies is tabulated as follows. And comparative study of parameters such as ultimate loads, load-deflection behaviour was carried out.
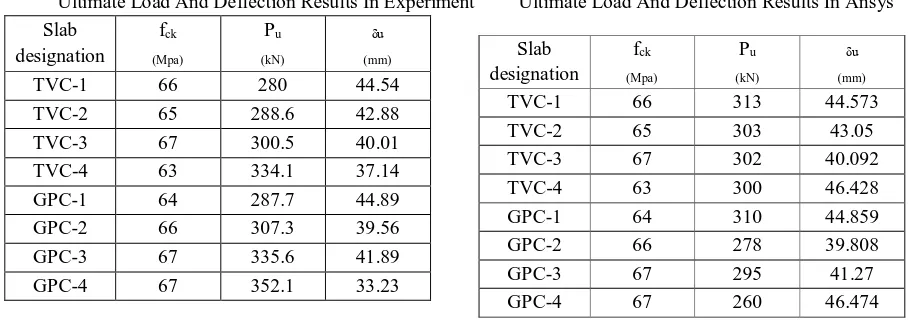
A. The maximum load and the corresponding deflection for different slabs in experimental work and in ANSYS showing nonlinear behaviour is as shown in the figure III & IV.
TABLE III TABLE IV
Ultimate Load And Deflection Results In Experiment Ultimate Load And Deflection Results In Ansys Slab designation fck (Mpa) Pu (kN) δu (mm)
TVC-1 66 280 44.54
TVC-2 65 288.6 42.88
TVC-3 67 300.5 40.01
TVC-4 63 334.1 37.14
GPC-1 64 287.7 44.89
GPC-2 66 307.3 39.56
GPC-3 67 335.6 41.89
GPC-4 67 352.1 33.23
Slab designation fck (Mpa) Pu (kN) δu (mm)
TVC-1 66 313 44.573
TVC-2 65 303 43.05
TVC-3 67 302 40.092
TVC-4 63 300 46.428
GPC-1 64 310 44.859
GPC-2 66 278 39.808
GPC-3 67 295 41.27
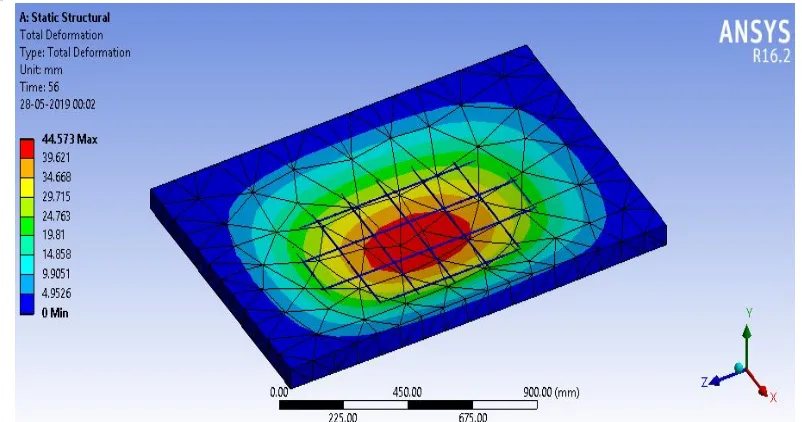
[image:3.595.60.514.592.756.2]306
©IJRASET: All Rights are Reserved
Fig. 2 Deflection behaviour of slab at ultimate load in ANSYS
[image:4.595.51.546.350.509.2]
Fig. 3 Load- deflection curve for TVC1 slabs with 0.26% steel reinforcement. Fig. 4 Load- deflection curve for TVC2 slabs with 0.3% steel reinforcement.
[image:4.595.46.551.552.712.2]
307
©IJRASET: All Rights are Reserved
Fig. 7 Load- deflection curve for GPC1 slabs with 0.26% steel reinforcement. Fig. 8 Load- deflection curve for GPC2 slabs with 0.3% steel reinforcement.
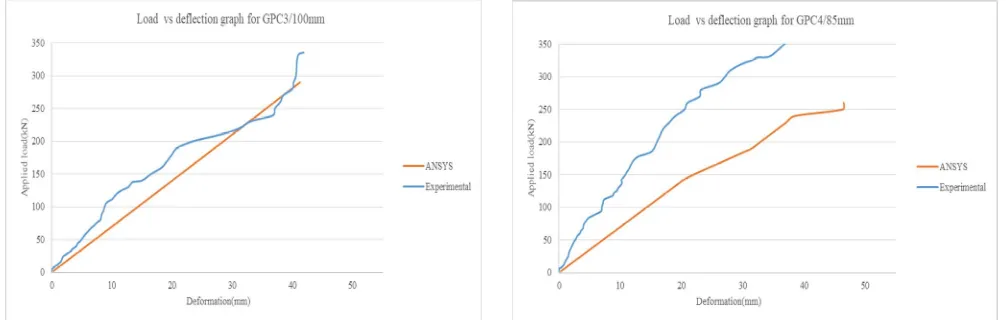
[image:5.595.40.547.86.271.2]
Fig. 9 Load- deflection curve for GPC3 slabs with 0.38% steel reinforcement. Fig. 10 Load- deflection curve for GPC4 slabs with 0.48% steel reinforcement
B. The maximum load and the corresponding deflection.
TABLE V TABLE VI Percentage Of Steel Vs Ultimate Load Relation For Percentage Of Steel Vs Ultimate Load Relation For
Tvc Slabs Gpc Slabs
Percentag
e of steel Slab
Ultimate load(KN)
EXP/A N Experimenta
l (EXP)
ANSYS (AN)
0.26 TVC
1 279.9 313 0.9
0.3 TVC
2 288.6 303 0.95
0.39 TVC
3 300.5 302 0.99
0.48 TVC
4 334.1 300 1.11
Percentage
of steel Slab
Ultimate load(KN)
EXP/AN Experimental
(EXP)
ANSYS (AN)
0.26 GPC1 287.7 310 0.92
0.30 GPC2 307.3 278 1.1
0.39 GPC3 335.6 295 1.13
[image:5.595.47.550.314.474.2]308
©IJRASET: All Rights are Reserved
0.26 TVC1 254.52 279.9 313 9.97% 22.97%
0.3 TVC2 263.42 288.6 303 9.56% 15.02%
0.39 TVC3 272.45 300.5 302 10.3% 9.78%
0.48 TVC4 278.13 334.1 300 20.12% 7.86%
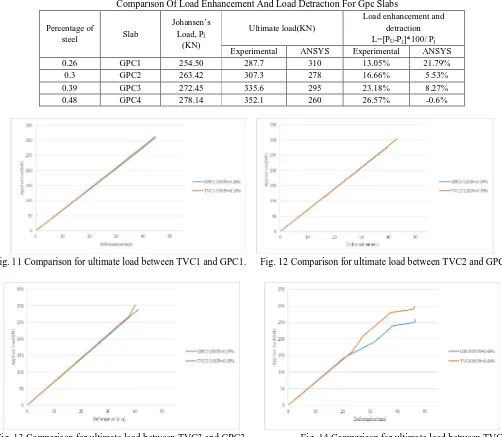
TABLE VIII
Comparison Of Load Enhancement And Load Detraction For Gpc Slabs
Percentage of
steel Slab
Johansen’s Load, Pj
(KN)
Ultimate load(KN)
Load enhancement and detraction L=[PU-Pj]*100/ Pj
Experimental ANSYS Experimental ANSYS
0.26 GPC1 254.50 287.7 310 13.05% 21.79%
0.3 GPC2 263.42 307.3 278 16.66% 5.53%
0.39 GPC3 272.45 335.6 295 23.18% 8.27%
0.48 GPC4 278.14 352.1 260 26.57% -0.6%
Fig. 11 Comparison for ultimate load between TVC1 and GPC1. Fig. 12 Comparison for ultimate load between TVC2 and GPC2
[image:6.595.46.548.288.725.2]
309
©IJRASET: All Rights are Reserved
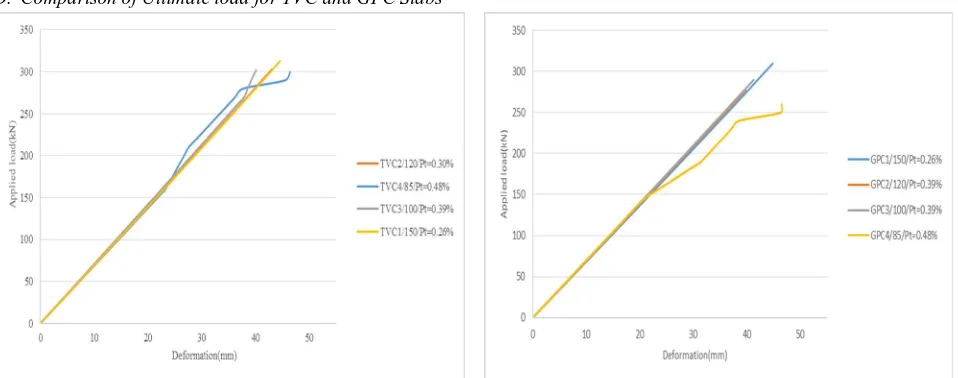
D. Comparison of Ultimate load for TVC and GPC Slabs
[image:7.595.43.522.118.307.2]
Fig. 15 Load vs deflection graph TVC slabs for various percentages of steel. Fig. 16 Load vs deflection graph GPC slabs for various percentages of steel.
V. CONCLUSIONS
An analytical study was performed on two groups of reinforced concrete slabs; one of traditionally vibrated concrete and the other of geopolymer concrete with varied percentage of steel reinforcement. The effective dimensions of slab taken was 1400mmx900mmx65mm. This research was aimed to compare analytically obtained result with available experimental outcomes. Load deflection behaviour, ultimate load, load enhancement beyond yield load etc. were studied and compared.
Following conclusions were drawn from current study
A. The ultimate loads obtained from ANSYS model for TVC slabs was varied from 0.5 to 11.33% higher than the experimental
work. And for GPC slabs it was varied from 7.09 to 26.13% higher than experimental work. This may be attributed to the assumptions of perfect bond between the reinforcement and concrete in ANSYS model.
B. It can be concluded that up to 30% of ultimate load the behaviour was linear and later nonlinear behaviour is observed due to
reduced stiffness.
C. The midspan deflections obtained from ANSYS have been lesser than that of experimental work for same magnitude of load.
This may be due to the bond slip between the steel and concrete is disregarded in ANSYS.
D. Deflection decreased as the percentage of reinforcement increased when compared to experimentally obtained result. In some
slabs it showed increase in deflection.
E. Ultimate load carrying capacity improved as reinforcement increased. This was consistent in both experimental and ANSYS as
it is a expected behaviour of structural members. But in ANSYS it showed decreased load carrying capacity.
F. Ultimate load carrying capacity was more in TVC slabs by 5% when compared to GPC slabs in ANSYS study, this is due to the
fact that stiffness of the member reduces after the cracking loads up to ultimate load.
G. Load enhancement beyond Johansen’s yield line load was decreasing as percentage of reinforcement increased due to increase
in load. This is due to the fact that stiffness of the member reduces after the cracking loads until ultimate load.
H. The converged solution for the structural element will be realised only when small load steps are given because after initial
cracking, the ANSYS results will not converge for greater load steps.
REFERENCES
[1] Vinay kumar B G and V Harish. “Experimental study on Deformation Behaviour of Partially Restrained steel Fibre Reinforced High Strength SCC Two Way Rectangular Slabs”. Jul-2015
[2] K Nehimiya and T Chandra Shekhar Rao.”Experimental Investigation on Studying The Flexural Behaviour Of Geopolymer Concrete Slabs Under Fixed Boundary Conditions”. Feb-2016
310
©IJRASET: All Rights are Reserved
[12] Laxminarayana R Naik, Prof Mahantesh N B and Dr Amarnath K., study on flexural behaviour of flyash based reinforced rectangular geopolymer concrete slabs. 2015