Geosci. Model Dev., 6, 429–443, 2013 www.geosci-model-dev.net/6/429/2013/ doi:10.5194/gmd-6-429-2013
© Author(s) 2013. CC Attribution 3.0 License.
EGU Journal Logos (RGB)
Advances in
Geosciences
Open Access
Natural Hazards
and Earth System
Sciences
Open AccessAnnales
Geophysicae
Open AccessNonlinear Processes
in Geophysics
Open AccessAtmospheric
Chemistry
and Physics
Open AccessAtmospheric
Chemistry
and Physics
Open Access DiscussionsAtmospheric
Measurement
Techniques
Open AccessAtmospheric
Measurement
Techniques
Open Access DiscussionsBiogeosciences
Open Access Open Access
Biogeosciences
Discussions
Climate
of the Past
Open Access Open Access
Climate
of the Past
Discussions
Earth System
Dynamics
Open Access Open Access
Earth System
Dynamics
DiscussionsGeoscientific
Instrumentation
Methods and
Data Systems
Open Access
Geoscientific
Instrumentation
Methods and
Data Systems
Open Access DiscussionsGeoscientific
Model Development
Open Access Open Access
Geoscientific
Model Development
DiscussionsHydrology and
Earth System
Sciences
Open AccessHydrology and
Earth System
Sciences
Open Access DiscussionsOcean Science
Open Access Open Access
Ocean Science
DiscussionsSolid Earth
Open Access Open Access
Solid Earth
Discussions
The Cryosphere
Open Access Open Access
The Cryosphere
DiscussionsNatural Hazards
and Earth System
Sciences
Open Access
Discussions
Evaluating a lightning parameterization based on cloud-top height
for mesoscale numerical model simulations
J. Wong1, M. C. Barth2, and D. Noone1
1Cooperative Institute for Research in Environmental Sciences, Department of Atmospheric and Oceanic Sciences, University
of Colorado, Boulder, CO 80309-0216, USA
2Atmospheric Chemistry Division, National Center for Atmospheric Research, Boulder, CO 80307-3000, USA Correspondence to: J. Wong ([email protected])
Received: 13 October 2012 – Published in Geosci. Model Dev. Discuss.: 2 November 2012 Revised: 1 March 2013 – Accepted: 11 March 2013 – Published: 3 April 2013
Abstract. The Price and Rind lightning parameterization based on cloud-top height is a commonly used method for predicting flash rate in global chemistry models. As mesoscale simulations begin to implement flash rate predic-tions at resolupredic-tions that partially resolve convection, it is nec-essary to validate and understand the behavior of this method within such a regime. In this study, we tested the flash rate parameterization, intra-cloud/cloud-to-ground (IC : CG) par-titioning parameterization, and the associated resolution de-pendency “calibration factor” by Price and Rind using the Weather Research and Forecasting (WRF) model running at 36 km, 12 km, and 4 km grid spacings within the continental United States. Our results show that while the integrated flash count is consistent with observations when model biases in convection are taken into account, an erroneous frequency distribution is simulated. When the spectral characteristics of lightning flash rate are a concern, we recommend the use of prescribed IC : CG values. In addition, using cloud-top from convective parameterization, the “calibration factor” is also shown to be insufficient in reconciling the resolution depen-dency at the tested grid spacing used in this study. We rec-ommend scaling by areal ratio relative to a base-case grid spacing determined by convective core density.
1 Introduction
Over the last decade, predictions of lightning flash statis-tics in numerical weather and climate models have gar-nered increasing interests. One of the likely drivers is the advances in online chemistry models, wherein chemistry is
simulated alongside of physics (e.g., Grell et al., 2005). Lightning-generated nitrogen oxides (LNOx) are predicted
to be very efficient in accelerating the production of tropo-spheric ozone, which is identified as a significant greenhouse gas in the upper troposphere (Lacis et al., 1990; Kiehl et al., 1999). Cooper et al. (2007), showing that during the summer-time North American Monsoon, lightning can contribute 25– 30 ppbv of upper tropospheric ozone. Choi et al. (2009) has remarked on the increasing importance of LNOx in
tropo-spheric ozone production as anthropogenic sources of NOx
are being reduced in the United States. Furthermore, the in-herent nonlinearity between NOx emission and commonly
validated quantities such as radiative balances and ozone concentration makes it challenging to quantify the skill of a LNOxparameterization through proxy or total NOx
measure-ments. Therefore, it is important to evaluate existing light-ning parameterizations by directly validating flash rate pre-dictions in order to more accurately interpret results from models that incorporate LNOxemission.
430 J. Wong et al.: Evaluating lightning parameterization based on cloud-top height
i.e., distance between freezing level and cloud-top, in Price and Rind (1993, hereafter PR93). Finally, the parameteriza-tion is generalized for different grid sizes with an extrapo-lated “calibration factor” in Price and Rind (1994, hereafter PR94).
Other bulk-scale or resolved-scale storm parameters may also be correlated with lightning flashes for the purpose of formulating alternative parameterization schemes. At param-eterized convection scales, Grewe et al. (2001) used a mass flux approach derived by correlating observations of mass flux and cloud-top heights. Similarly, Allen and Pickering (2002) and Allen et al. (2010) implemented a parameteriza-tion of flash rate to the square of deep convective mass flux. Zhao et al. (2009) and Choi et al. (2005) based their flash rate predictions on both the deep convective mass flux and the convectively available potential energy (CAPE). Allen et al. (2012) used a flash rate predictions scheme based on the convective precipitation rate. Hansen et al. (2012) pro-duced a lookup table for flash rate from convective precipi-tation and mixed phase layer depth by correlating data from observations. Appropriate for simulations with resolved con-vection, Petersen et al. (2005) gave a linear relation between flash rate and ice water path (IWP). Deierling and Petersen (2008) investigated a linear dependence of flash rate on up-draft volume forT <273 K and w >5 m s−1. Barthe et al. (2010) compared several of these methods, including PR92, through case studies, and showed that while the polynomial orders are lower in these formulations, the level of uncertain-ties may still be higher than PR92 due to a combination of errors from model biases in the parameters used, e.g., hy-drometeors, and observational biases in the datasets used for constructing the relationships. Futyan and Del Genio (2007) arrived at a similar conclusion about the reduced reliability of precipitation-based approaches in global climate simulations for predicting lightning flash rate.
As a way to provide lightning hazard forecasts for the public in a qualitative manner, Yair et al. (2010) developed the lightning potential index (LPI) based on ice fractions and super-cooled liquid water mixing ratios between freez-ing level and−20◦C, and it has been shown to correlate well with observed flash rates in the Mediterranean. While the LPI does not directly produce a flash rate and no relationship was given to convert one from another, one of the many underly-ing assumptions is that charge buildup should be proportional to the fourth power of the relative velocities of the charg-ing particles, strongly resemblcharg-ing the scalcharg-ing arguments by Williams (1985). Similarly, Bright et al. (2005) introduced the Cloud Physics Thunder Parameter (CPTP) based on con-vective available potential energy (CAPE) and temperature at the equilibrium level (EL). Like LPI, CPTP is a qualita-tive index that does not translate directly to flash probabil-ity or flash count. Instead, a CPTP≥1 is “considered favor-able” for cloud electrification. McCaul et al. (2009) proposed two additional approaches to threat indices calculation based on vertical hydrometeor mass flux within the mixed-phase
region and column integral of frozen hydrometeor, which are currently operationally used in NOAA High-resolution Rapid Refresh (HRRR) model, a version of WRF.
The goals of this study are to evaluate the cloud-top height based parameterization (PR92, PR93, and PR94) across the bridging resolutions between those commonly used by global chemistry models (1x∼O(1◦)) and cloud-resolving mod-els (1x <5 km), and report on statistics over time periods useful for studying upper tropospheric chemistry (O(month)) (Stevenson et al., 2006). It is, however, not the goal of this study to invalidate previous studies, but to draw attention to the need for careful implementation and validation of the use of these parameterizations. Here we report on experi-ments using PR92, PR93, and PR94 implemented into the Weather Research and Forecasting model (WRF; Skamarock et al., 2008), focusing on results from simulations performed at 36 km and 12 km grid-spacing. A simulation at 4 km grid spacing for 2 weeks in July and August 2006 is also ana-lyzed to demonstrate how PR92 behaves transitioning from cloud-parameterized to cloud-permitting resolutions and pro-vide insights on how or whether such transition can be done. Similar studies have been performed for global models (e.g., Tost et al., 2007), but previous regional-scale modeling studies utilizing PR92 at comparable horizontal grid spac-ings have not provided evaluations of the lightning param-eterization. Thus, there has been insufficient information to understand the behavior of PR92 in this regime. Even though these formulations were derived using near-instantaneous data at a cloud-permitting resolution (5 km), past applica-tions often utilize temporally and spatially averaged cloud-top height outputs or proxy parameters. While the effects of spatial averaging is addressed by the PR94 scaling factor, ef-fects of temporally averaging cloud-top heights are rarely ad-dressed and may lead to significant underestimation due to the fifth-power sensitivity (Allen and Pickering, 2002). Ad-dressing the potential issue of temporal averaging, instanta-neous cloud-top heights and updraft velocities at each time step are leveraged. Comparisons are then performed for tem-poral, spatial, and spectral features.
J. Wong et al.: Evaluating lightning parameterization based on cloud-top height 431
2 Methods
2.1 Parameterization overview
In PR92, a fifth-power relation between continental lightning flash rate (fc) and cloud-top height (ztop) is established with
observational data following the theoretical and empirical frameworks of Vonnegut (1963) and Williams (1985). As-suming a dipole structure with two equal but opposite charge volumes and a cloud aspect ratio of approximately one, it is first formulated, based on scaling arguments of Vonnegut (1963), that the flash rate would be proportional to maxi-mum vertical updraft velocity (wmax) and fourth-power of cloud dimension. Imposing a linear relation betweenwmax
and cloud dimension, the flash rate relationship can be re-duced to fifth power ofztop(Williams, 1985). It is empirically fit to radar and flash rate data from several measurements be-tween 1960–1981 to give the continental equation (Price and Rind, 1992):
fc(ztop)=3.44×10⁻⁵z4.9top. (1) PR92 also estimated that wmax=1.49z1.09top for continental
clouds, thus allowing a second formulation based on maxi-mum convective updraft:
fc(wmax)=5×10⁻⁶w4.54max. (2) A separate formulation of second-order, instead of fifth-order, is also derived by Price and Rind (1992) for marine clouds, for which updraft velocity is observed to be signifi-cantly slower:
fm(PR92)(ztop)=6.2×10⁻⁴z1.73top . (3) Taking into account effects from cloud condensation nuclei, Michalon et al. (1999) modified the marine equation to fifth-order:
fm(M99)(ztop)=6.57×10⁻⁶z4.9top. (4) The practical viability of the continental relation was proven by Ushio et al. (2001) and Yoshida et al. (2009) through sev-eral case studies. However, Boccippio (2002) showed that the marine equations are formally inconsistent with Vonnegut (1963), and that the marine equations cannot be inverted to produce cloud tops within the range of cloud-top observa-tions.
Price and Rind (1993) used the flash data from eleven states in the western United States, detected by wide-band magnetic direction finders, in combination with thunder-storm radar and radiosondes data to find a relation for the IC : CG ratio (Z) from cold-cloud depth (d), defined as the distance from freezing level to cloud-top.
Z=0.021d4−0.648d3+7.49d2−36.54d+63.09 (5)
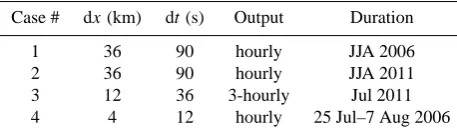
Table 1. WRF simulations performed in this study.
Case # dx(km) dt(s) Output Duration
1 36 90 hourly JJA 2006
2 36 90 hourly JJA 2011
3 12 36 3-hourly Jul 2011 4 4 12 hourly 25 Jul–7 Aug 2006
In Price and Rind (1994), a “calibration factor” (c) for the resolution dependency of PR92 is introduced by regrid-ding 5 km data between 1983 and 1990 from the International Satellite Cloud Climatology Project dataset (ISCCP; Rossow and Schiffler, 1991) to different horizontal grid sizes. The re-sulting equation is as follows:
c=0.97241 exp(0.048203R) (6)
whereRis the grid area in squared degrees. Price and Rind (1994) claim that there is no dependence ofc on latitude, longitude, or season. For the grid sizes used in this study, the values ofcare 0.9774 for 36 km, 0.973 for 12 km, and 0.9725 for 4 km.
2.2 Model setup and implementation
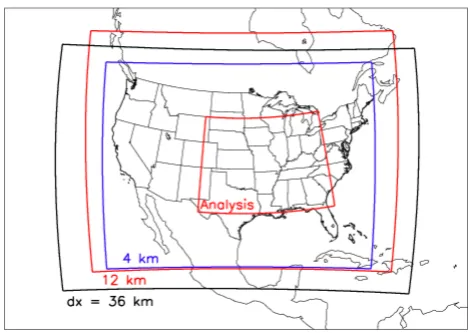
Simulations in this study are performed using the Weather Research and Forecasting (WRF) model version 3.2.1 (Ska-marock et al., 2008) over the contiguous United States (CONUS), including part of Mexico and Canada (Fig. 1). The simulations have slightly different model domains be-cause the simulations were developed and performed for ob-jectives independent of validating the lightning parameteri-zation. Meteorology is initialized and continuously nudged (horizontal winds, temperature, water vapor) with the Na-tional Center for Environmental Prediction (NCEP) Global Forecasting System (GFS) final (FNL) gridded analysis at 6 h intervals (00:00 UTC, 06:00 UTC, 12:00 UTC, 18:00 UTC). Four simulations are performed (Table 1), two at 36 km grid spacing, one at 12 km grid spacing, and one at 4 km grid spacing. All cases use the same vertical coordinates with 51 sigma levels up to 10 hPa. The Grell–Devenyi ensemble convective parameterization (Grell and Devenyi, 2002) with Thompson et al. (2008) microphysics is used for the simula-tions where grid-spacing1x >10 km, for which a convec-tive parameterization is needed. The implementation of the GD scheme employed in this study consists of 3×3×16=
144 ensemble members comprising of interactions between different dynamic control and static control/feedback clo-sures. The maximum moist static energy (MSE) is then used as input with entrainment to calculate the level neutral buoy-ancy (LNB), or cloud top. For further information about the convective parameterization, readers are encouraged to refer to Grell (1993).
432 J. Wong et al.: Evaluating lightning parameterization based on cloud-top height
Discussion
P
ap
er
|
Dis
cussion
P
ap
er
|
Discussion
P
ap
e
r
|
Discussion
P
ap
er
|
Fig. 1.Non-nested domains for WRF simulations and region for analysis. figure
29
Fig. 1. Non-nested domains for WRF simulations and region for
analysis.
boundary layer (PBL) parameterization is handled by the Yonsei University scheme (Hong et al., 2006) at 36 km and Mellon–Yamada–Janjic (MYJ) scheme (Janji´c, 1994) at 12 km and 4 km. At 36 km, the surface layer physics option used is based on Monin–Obukhov similarity theory. The sur-face layer option used at 12 km and 4 km is also based on Monin-Obukhov theory but includes Zilitinkevich thermal roughness length.
While theoretically the scaling argument of Vonnegut (1963) does not distinguish between definitions of cloud-top height, the data used to derive the PR92 relation are radar reflectivity cloud-top heights at a certain reflectivity thresh-old. In the WRF implementation of Grell–Devenyi convec-tive parameterization, the level of neutral buoyancy (LNB) is computed, with convective entrainment and detrainment accounted for within the calculation of cloud moist static en-ergy, and readily available as a proxy for sub-grid cloud-top height. Thus, instead of 20 dBZ reflectivity cloud top,ztop
is approximated by reducing LNB by 2 km, which will be shown to produce results within the range of the observed values. The choice of 2 km reduction is made independent of, but supported by, a recent study comparing different def-initions of LNB and found the traditional “parcel” method definition of LNB over estimates the level of maximum de-trainment by 3 km (Takahashi and Luo, 2012). Appendix A contains detailed discussions of the choice of 2 km cloud-top reduction and how it compares to offline computations of 20 dBZ cloud tops. Alternative methods for estimating the difference between the two heights can be formulated by di-rectly taking into account their respective definitions. How-ever, echoing Barthe et al. (2010), such addition of com-plexity increases the number of sources for uncertainty, es-pecially in the context of parameterized convection. Simi-larly, using modeled cloud particle variables would also add an additional level of sensitivity due to sub-grid variability in hydrometeor mixing ratios. Therefore, reflectivity
calcula-tions are only performed in the 4 km simulation and only for the purpose of redistributing lightning flashes horizontally as described below.
For case 4 (Table 1), convection is explicitly simulated with a modified Lin et al. (1983) microphysics scheme. Since no convective parameterization is used, the resolved max-imum vertical velocities (wmax) within the convective core
are utilized (Barth et al., 2012), and Eq. (2) is used instead of Eq. (1) for estimating flash rate. In addition, since a sin-gle storm may often cover multiple model grids, flashes are redistributed to within regions with a minimum reflectivity of 20 dBZ calculated using hydrometeor (rain, snow, grau-pel) information that is now better constrained at 4 km. The IC : CG ratio is prescribed using a coarse version of the Boc-cippio et al. (2001) 1995–1999 climatological mean, which was computed using data from the Optical Transient Detec-tor (OTD; Christian et al., 1996) and the National Lightning Detection Network (NLDN; Cummins and Murphy, 2009). Because PR92 developed Eq. (2) based on data at 5 km res-olution, no resolution scaling is done to this simulation. Be-cause this particular simulation was driven by the meteorol-ogy of its own WRF outer domains, it is restarted “cold” on 2 August to be consistent with the outer domain meteorology. Most of the implementations used in these simulations are arguably “untuned” and not scaled to climatology or obser-vations by any additional tuning factors, with the exceptions of the 2 km cloud-top height reduction used in the cases with parameterized convection and the prescribed climatological IC : CG ratios in case 4. Therefore, the correctness and pre-dictiveness of the flash rate parameterization are not guaran-teed at the time of the simulation given the lack of support-ing validations of PR92 at the tested grid spacsupport-ings. However, without feedback to the meteorology (except in case 4) and providing sufficient linearity in the biases of flash prediction, offline comparisons should reveal any tuning requirements for operational and research uses.
2.3 Data description
While desirable, event-by-event analysis would be techni-cally challenging because the simulation may not produce the same strength, timing, and location of each convective event. Furthermore, an event-by-event analysis is unneces-sary in the context of a mesoscale upper tropospheric chem-istry study, of which the meaningful timescales often average biases from many individual events. Therefore, a large area where thunderstorms commonly occur is selected. The “anal-ysis domain,” defined as 30◦– 45◦N, 80◦– 105◦W (Fig. 1), is used for time series and statistical comparisons.
J. Wong et al.: Evaluating lightning parameterization based on cloud-top height 433
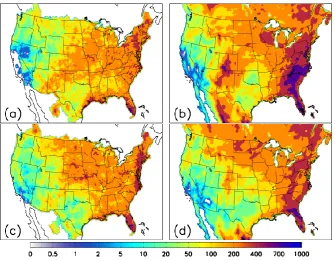
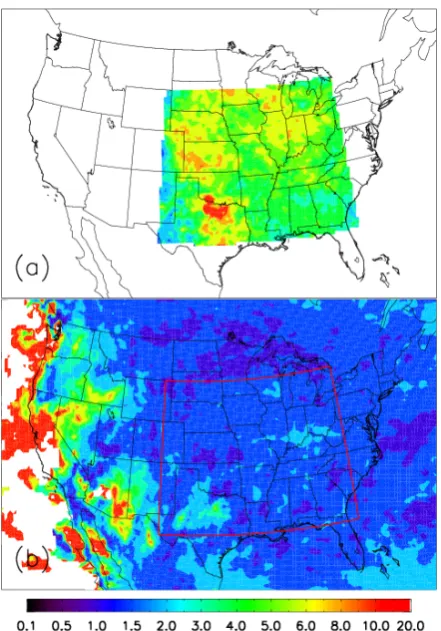
Fig. 2. Spatial distribution of 2006 and 2011 JJA total precipitation in millimeters. (a) and (c) are NWS precipitation degraded to 12 km
resolution. (b) and (d) are 36 km WRF-simulated total precipitation over the same periods with data above water surfaces masked out.
upon using a Multi-sensor Precipitation Estimator (MPE). Manual post-analyses are then performed by forecasters to identify systematic errors (http://www.srh.noaa.gov/abrfc/ ?n=pcpn methods). The final data products used here are mo-saic CONUS precipitation maps from 12 River Forecast Cen-ters (RFCs) during JJA 2006 and 2011. The data are gridded into 4 km resolution and are available as 24 h totals over a hydrological day beginning and ending at 12:00 UTC.
The simulated CG flash counts, computed online as pre-dicted total flashes×predicted CG fraction, are compared against data from the Vaisala US National Lightning Detec-tion Network (NLDN; Cummins and Murphy, 2009). The network provides continuous multiyear CONUS and Canada coverage of>90 % of all CG flashes with ongoing network-wide upgrades (Orville et al., 2002, 2010). The median loca-tion accuracy is 250 m, which is well within the resoluloca-tions employed in this study. Multiple strokes are aggregated into a single flash if they are within 1 s and no more than 10 km apart. Weak positive flashes with<15 kA have been filtered from all data. Finally, the flash data are binned into hourly flash counts for each model grid cell for comparison against model output.
Data from Earth Networks Total Lightning Network (ENTLN), previously WeatherBug Total Lightning Network (WTLN), are used to validate the model-produced IC : CG ratios. ENTLN employs a wide-band system that operates between 1 Hz to 12 MHz (Liu and Heckman, 2011). The theoretical detection efficiency (DE) for CG flashes across
CONUS is 90–99 %, while the IC DE falls between 50–95 % (50–85 % within the analysis domain). Since the mappings of the corresponding DEs are not available with the data, 95 % and 65 % are used for CG and IC DEs, respectively, in analyses for which a prescribed DE is required. To address the concern of the impact of this simplification, the range of possible flash counts, IC : CG ratios, and biases will be pro-vided when appropriate within the discussion in Sect. 3 to place bounds on the uncertainty. Due to the limited deploy-ment duration of the network, only the IC : CG ratios during JJA 2011 within the analysis domain (see Fig. 1) are esti-mated and compared. For consistency with the comparisons against NLDN CG flash counts, the stroke aggregation crite-ria used here are 10 km and 1 s as done by NLDN, instead of the 10 km and 700 ms window typically used by Earth Net-works to generate flash statistics.
3 Results and discussions
3.1 Precipitation
434 J. Wong et al.: Evaluating lightning parameterization based on cloud-top height
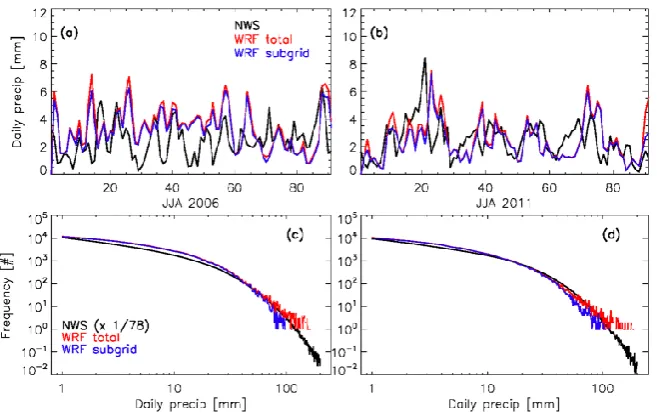
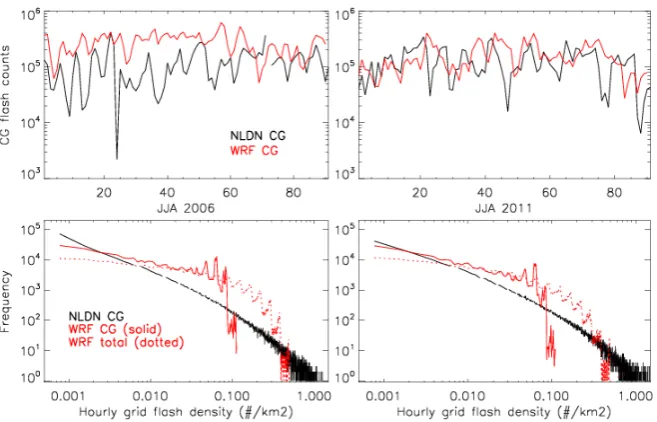
Fig. 3. Time series and frequency distributions for JJA 2006 and 2011 area-averaged daily precipitation within the analysis region (see Fig. 1).
Distributions for NWS are scaled by the ratios between total grid counts in WRF at 36 km and total grid counts in NWS within the analysis boundaries (∼1/78). WRF subgrid is the portion of precipitation from subgrid cumulus parameterization. Only grid points with more than 1 mm of precipitation are included.
observations and the large uncertainty in model calculations make it an inferior proxy for convective strength in this con-text.
Figure 2 shows the total precipitation during JJA 2006 and 2011 over the CONUS as simulated at 36 km grid spacings by WRF and observed by NWS. The gradients across the CONUS for both years are well captured by the model, but WRF has a high bias for 2006. WRF also simulates up to an order of magnitude more precipitation for coastal regions for both years but primarily for 2006. The time series for mean daily area-averaged precipitation and frequency distributions for JJA 2006 within the analysis domain (Fig. 3a and c) also reveal a median model bias of 37 %. In particular, WRF pre-dicted more than twice the precipitation between late-June and mid-July in 2006. In contrast, the median bias for 2011 is 4.9 % with almost equal occurrence of over- and under-predictions. The model frequency distribution for both years also closely track those observed (Fig. 3c and d) except at the high end of the distribution where limits of model grid resolution induces significant noise.
The simulated daily precipitation at 12 km is higher than the NWS observed precipitation by 24 % during July 2011. However, an anomalously strong diurnal cycle is simulated at 12 km grid spacing that is not present in the 36 km sim-ulation. Comparing the area-averaged 12 km nocturnal pre-cipitation over the entire analysis domain to that of 36 km output, nocturnal precipitation at 12 km is too low but the daytime precipitation is too high. One-day simulations were performed to evaluate the impact from the differences in model physics, but there remained significant unidentified
discrepancies between the precipitation amount in the two runs that cannot be explained by horizontal resolution differ-ences alone; thus, it is concluded that there is no value in re-doing the entire simulation. The identified causes for the dif-ferences between the two simulations are, in decreasing order for magnitude of influence, initial conditions for soil tem-perature and soil moisture, differences in planetary boundary layer scheme (Sect. 2.2), and the land surface model option. Such difference in diurnal behavior in the simulations is ex-pected to have significant impact on how the lightning pa-rameterization is evaluated, but the full impact can be mini-mized through incorporation of precipitation into the analy-sis.
Large scale meteorology and moisture inputs are unlikely the causes for the these biases due to nudging. In 2006, bi-ases mostly occurred in the low-to-mid end of the distribu-tion (i.e., light precipitadistribu-tion events, Fig. 3c), indicating that the problem lies in parameterizing subgrid events. Despite the differences in the eastern United States, convection over the central United States is reasonably represented. Finally, the goal of this study is not to evaluate the convective param-eterization nor specific model setup, but rather to evaluate the performance characteristics of the lightning parameteri-zation when implemented into a regional model with all the expected (and unexpected) defects.
3.2 CG flash rate
J. Wong et al.: Evaluating lightning parameterization based on cloud-top height 435
Discussion
P
ap
er
|
Dis
cussion
P
ap
er
|
Discussion
P
ap
e
r
|
Discussion
P
ap
er
|
Fig. 4.Total CG flashes in number perkm2per full-year during JJA 2006 (first row) and 2011 (second row). First column (aandc) shows the NLDN observed density gridded to WRF 36 model grid, and second column (bandd) shows the modeled flash density output by WRF at 36km.
32
Fig. 4. Total CG flashes in number per km2per full-year during JJA 2006 (first row) and 2011 (second row). First column (a and c) shows the NLDN observed density gridded to WRF 36 model grid, and second column (b and d) shows the modeled flash density output by WRF at 36 km.
Discussion
P
ap
er
|
Dis
cussion
P
ap
er
|
Discussion
P
ap
e
r
|
Discussion
P
ap
er
|
Fig. 5. Comparisons of time series and frequency distributions between NLDN CG flash counts (black)
and WRF predicted CG flash counts (red) at 36kmwithin the analysis domain defined in Figure 1. Total
flash counts predicted by WRF are shown as dotted red lines.
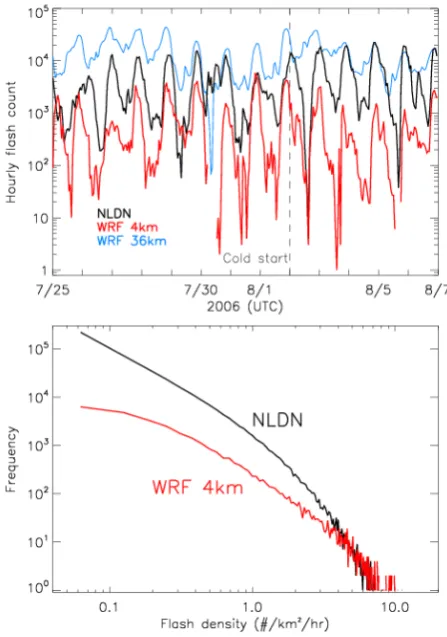
Fig. 5. Comparisons of time series and frequency distributions between NLDN CG flash counts (black) and WRF predicted CG flash counts
(red) at 36 km within the analysis domain defined in Fig. 1. Total flash counts predicted by WRF are shown as dotted red lines.
in the modeled precipitation, which is used as a proxy for quantifying the comparison of simulated convective strength against observations. Similarly, both flash rate and precip-itation are over-predicted in the Colorado and New Mexico region for 2006. On the other hand, the low precipitation bias
436 J. Wong et al.: Evaluating lightning parameterization based on cloud-top height
Discussion
P
ap
er
|
Dis
cussion
P
ap
er
|
Discussion
P
ap
e
r
|
Discussion
P
ap
er
|
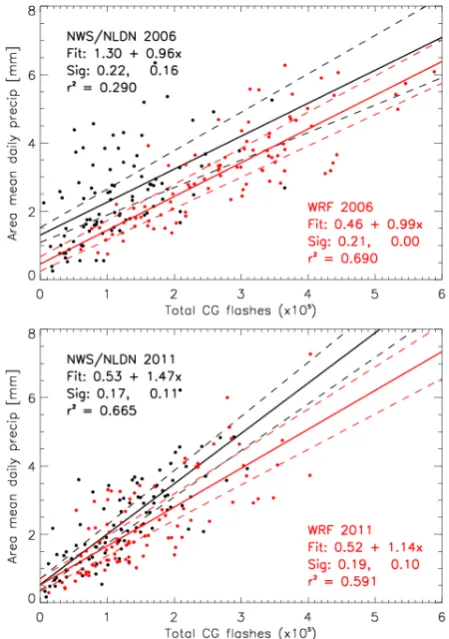
Fig. 6. Total CG flashes (#) versus area-mean daily precipitation (mm) within the analysis domain (Fig. 1). Solid line is the least-square linear fit and dashed lines are±1σfor both the constant terms and first-order coefficients. WRF is simualted at 36km.
34
Fig. 6. Total CG flashes (#) versus area-mean daily precipitation
(mm) within the analysis domain (Fig. 1). Solid line is the least-square linear fit and dashed lines are±1σ for both the constant terms and first-order coefficients. WRF is simualted at 36 km.
The over-prediction of CG flash density along the East Coast in 2006 dominates the regional mean and produces significantly high biases compared to 2011. Figure 5a and 5b show the time series of the total number of ground flashes predicted by WRF and observed by NLDN within the anal-ysis region (Fig. 1). The median daily CG bias is 140 % for 2006 and only 13 % for 2011. It should be noted that these values were obtained by sampling all 3 months. Sam-pling one month would produce varying results. For instance, while JJA 2011 produces an overall median bias of 13 %, July 2011 alone produces about twice as much lightning as ob-served but is offset by under-predictions in June and August. Because the lightning detection efficiency of NLDN varies spatially, the CG bias can vary over ranges of 116–154 % for 2006 and 1.7–20 % for 2011. The differences between the median biases for the two summers can be attributed largely to the differences in the total precipitation biases, as illus-trated in the previous section (Sect. 3.1), for which 2006 is 37 % too high while 2011 is only 5 % higher than observa-tions.
Discussion
P
ap
er
|
Dis
cussion
P
ap
er
|
Discussion
P
ap
e
r
|
Discussion
P
ap
er
|
Fig. 7.Total lightning and CG flash rates computed using PR92 and PR93 for various cloud-top heights and freezing levels, demonstrating the source of spectral cut-off in Figure 6.
35
Fig. 7. Total lightning and CG flash rates computed using PR92 and
PR93 for various cloud-top heights and freezing levels, demonstrat-ing the source of spectral cut-off in Fig. 6.
To take into account the bias in the simulated convective strength, area-averaged daily precipitation is correlated with total CG flash count. While the relation is likely nonlinear, the area averages over the analysis domain are roughly lin-ear in both WRF-simulated and observed data (Fig. 6). The slopes for the 2006 data are statistically the same, there is a constant positive bias for model produced flash counts over observed values. In contrast, 2011 results are close for small values but modeled and observed values diverge for more in-tense events. Such inconsistency between years demonstrates the potential for strong inter-annual variability in the correla-tion between flash rate and precipitacorrela-tion.
Figure 5c and d show the frequency distributions of the hourly grid flash density. From the spectra, it is apparent that the over-prediction observed in the time series occurs between flash densities of 0.003 to 0.1 CG flashes km−2h−1. However, the abrupt cutoff beyond∼0.11 in both 2006 and 2011 modeled distribution indicates that PR92 fails to repli-cate the observed distribution. The occurrence of this cutoff can be explained by the local maximum when combining the PR92 total flash rate parameterization and PR93 IC : CG ratio parameterization (Fig. 7). Together, the predicted CG flash rate is capped at a certain limit, depending on the freezing level regardless of the cloud-top height. In addition, the to-tal flash rate is also under-predicted for high flash rate events (dotted red lines in the figures), thus contributing to the trun-cated model frequency distribution.
J. Wong et al.: Evaluating lightning parameterization based on cloud-top height 437
Discussion
P
ap
er
|
Dis
cussion
P
ap
er
|
Discussion
P
ap
e
r
|
Discussion
P
ap
er
|
Fig. 8.IC : CG bulk ratios for JJA 2011 as(a)observed by ENTLN and(b)predicted by WRF at 36km grid spacing using PR93. The ENTLN detection efficiency used here are 0.65 for IC and 0.95 for CG.
36
Fig. 8. IC : CG bulk ratios for JJA 2011 as (a) observed by ENTLN
and (b) predicted by WRF at 36 km grid spacing using PR93. The ENTLN detection efficiency used here is 0.65 for IC and 0.95 for CG.
3.3 IC : CG ratio
The JJA 2011 IC : CG bulk ratios (≡
P
tIC(x, t )/
P
tCG(x, t )) are calculated within the analysis
domain (Fig. 8a) using constant detection efficiencies of 95 % and 65 % for CG and IC flashes, respectively. While WRF produced a median IC : CG ratio of 1.74 within the region, ENTLN observed a median of 5.24 with a possible range of 3.80 to 7.17 due to the spatial variability in both IC and CG DEs. Considering the ambiguity in the choice of cloud-top definition described in Sect. 2.2, a possible solution to increase the IC : CG ratio computed using Eq. (5), thus achieving better comparison against observations, is by eliminating the cloud-top height reduction, an option that maintains the conceptual interpretation of the param-eterization but has the potential of offsetting the bias. For consistency, the cloud-top height used in the total lightning parameterization needs to be un-adjusted as well.
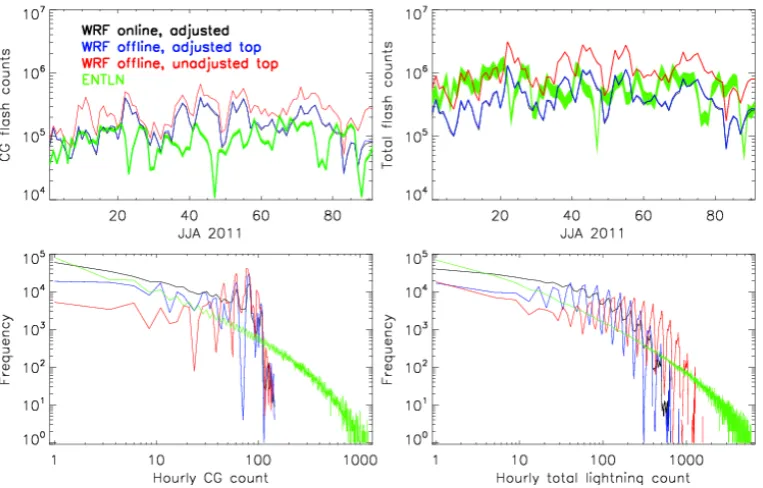
To learn whether reasonable lightning flash rates and IC : CG ratios can be estimated by using just the level of neu-tral buoyancy (LNB), an offline calculation is made of the
daily flash counts with the cloud-top height adjustment elim-inated. The offline calculation is performed using instanta-neous, hourly model output of LNBs and temperatures (for determining freezing levels). While the offline calculation is able to replicate almost precisely the online flash count pre-diction, which causes both time series to appear overlapping in Fig. 9, the CG flash rate frequency distribution is severely degraded because of vertical discretization of cloud tops to model levels and lowered temporal resolution to hourly out-puts. When LNB is used for the cloud-top height (with no adjustment), the prediction of both CG and total lightning flash rates increase, as expected. The CG median bias over ENTLN increases from 44 – 51 % to 158 – 172 %, and the total lightning median negative bias of 53 – 25 % becomes a positive bias of 23 – 95 % for the aforementioned range of DEs. Furthermore, even though the frequency distribution of total lightning is closer to the observed distribution, the CG distribution still experiences the truncation as described in Sect. 3.2.
4 Resolution dependency
A goal of this study is to evaluate the applicability of the PR92 parameterization to resolutions between fully param-eterized and partially resolved convection. Thus, it is use-ful to evaluate how the parameterization behaves as the grid size changes. To test the behavior of the PR94 calibration factor, a 12 km simulation for July 2011 is used. As grid sizes are reduced to allow convective parameterization to be turned off, the transition towmaxbased formulation of PR92 (Eq. 2) is tested with a 4 km simulation between 25 July– 7 August 2006. The domains for these simulations are shown in Fig. 1. Together, the results from these simulations will provide insights and recommendations on how to achieve resolution-awareness or independence while using PR92.
4.1 Sensitivity to grid size
At 12 km, the resolution dependency factor or “calibration factor” (c) from Price and Rind (1994) is 0.56 % smaller than that applied to 36 km. However, comparison against the 36 km simulation and observations shows that there is a fac-tor of∼10 high bias. While there are differences in the statis-tics of convective strengths between the two simulations, as quantified by precipitation in Sect. 3.1, they are too minor to fully reconcile the large bias at 12 km. Therefore, an areal ratio scaling factor (1/9=122/362) is applied offline to par-tially reconcile the differences on top ofc(∼1), which was applied online.
438 J. Wong et al.: Evaluating lightning parameterization based on cloud-top height
Discussion
P
ap
er
|
Dis
cussion
P
ap
er
|
Discussion
P
ap
e
r
|
Discussion
P
ap
er
|
Fig. 9.
Comparison of WRF predicted lightning flash counts generated online and offline with and
without
−
2 km
cloud-top height adjustments against ENTLN CG and total flash counts. Thicknesses of
the ENTLN bands in the time series are computed using the minimum and maximum theoretical IC and
CG detection efficiencies within the analysis domain. Noisiness of offline calculated distributions are
associated with using hourly outputs only rather than accumulating flashes at every model time step. It
should be noted that online (black) and offline (blue) WRF outputs with adjusted top appear coincident
in the time series, but are evidently different from the frequency distribution.
37
Fig. 9. Comparison of WRF predicted lightning flash counts generated online and offline with and without−2 km cloud-top height adjust-ments against ENTLN CG and total flash counts. Thicknesses of the ENTLN bands in the time series are computed using the minimum and maximum theoretical IC and CG detection efficiencies within the analysis domain. Noisiness of offline calculated distributions are associated with using hourly outputs only rather than accumulating flashes at every model time step. It should be noted that online (black) and offline (blue) WRF outputs with adjusted top appear coincident in the time series, but are evidently different from the frequency distribution.
original ISCCP 5 km resolution to 8◦×10◦. On the contrary, the LNBs from the convective parameterization are expected to change only slightly with grid resolution as long as the environmental parameters such as buoyancy remain similar.
The second reason addresses why the areal ratio is ex-pected to work for regional scales. PR92 produces flash counts in unit of number of flashes per storm; thus, when approaching almost convection-resolving resolutions, where major storm size is comparable to grid size, the appropri-ate scaling should be done according to the expected number of convective cores per grid. Since1x=36 km gives a rea-sonable flash rate compared to observations over 3 months, we assumed one storm per grid at this resolution and scaled the flash counts from1x=12 km as an areal ratio. However, the base case resolution may spatially vary because of the dy-namics controlling the minimum-permitted distance between convective cores. At coarse grid sizes, the area covered by the convective storm systems may only be a fraction of the grid cell area. Thus, the area scaling ratio may not be applicable when changing from base-case grid spacing (with approx-imately one storm per grid) to much coarser grid sizes. A possible solution is to include a cloud fraction estimate as part of the scaling factor between grid sizes.
After scaling by 1/9, WRF at 12 km predicts a median of 40 % more 3-hourly lightning flashes than observed by NLDN (Fig. 10). This is to be compared with 36 km, which
predicted double the 3-hourly lightning for the same period. Simulating an anomalously strong diurnal cycle in precipita-tion, the 12 km flash count also shows a much more preva-lent diurnal variation, associated with the poor simulation of the diurnal cycle of precipitation as previously noted. Much of the over-prediction is compensated by the negative biases in the nocturnal flash rates in the final statistics. Despite the differences in diurnal skill, the parameterization was able to produce the same drop-off in grid frequency distribution be-yond 200 flashes per grid per 3 h, for which the primary cause is discussed in Sect. 3.2.
4.2 Sensitivity to formulation
Comparing the 36 km simulation to the 4 km simulation pro-vides insight into how the predicted flash density changes be-tween resolutions usingf (ztop)for parameterized convection andf (wmax)for resolved convective systems. This is an im-portant factor to be considered if flash rate predictions are to be included in nested simulations or models permitting non-uniform grid-spacings such as Model for Prediction Across Scales-Atmosphere (MPAS-A; Skamarock et al., 2012).
J. Wong et al.: Evaluating lightning parameterization based on cloud-top height 439
Discussion
P
ap
er
|
Dis
cussion
P
ap
er
|
Discussion
P
ap
e
r
|
Discussion
P
ap
er
|
Fig. 10. Time series and frequency distributions of 3-hourly CG flash counts compared to NLDN at gridded to 12km. The WRF 36km distribution is adjusted by ×9 to account for the grid per area difference. The choice of computing the distributions for flash rate per grid as opposed to flash density is to demonstrate the consistency of the spectral drop-off at different resolutions.
38
Fig. 10. Time series and frequency distributions of 3-hourly CG
flash counts compared to NLDN at gridded to 12 km. The WRF 36 km distribution is adjusted by×9 to account for the grid per area difference. The choice of computing the distributions for flash rate per grid as opposed to flash density is to demonstrate the consis-tency of the spectral drop-off at different resolutions.
clouds) to be consistent with the re-initializations of the outer domain WRF simulations that drove this 4 km simulation de-scribed in Barth et al. (2012). The flash rate predicted by the 4 km simulation follows the precipitation trend. A 26 % de-crease in flash rate occurs between the period before 2 Au-gust and the period afterwards.
While the 36 km simulation over-predicted lightning flash rate for this period (25 July–7 August 2006), the 4 km sim-ulation under-predicted the flash rate, exhibiting a −83 % bias relative to the NLDN flash counts prior to the cold-start and a−95 % bias after (Fig. 11). Similar underestimation of thewmaxformulation has been noted for both tropical
(Hec-tor s(Hec-torm near Darwin, Australia) and US continental s(Hec-torms (Cummings et al., 2013). These results indicate that it is im-portant to evaluate the flash rate parameterizations with ob-servations. It is insufficient to use high resolution model re-sults as “truth” for coarse resolution simulations.
Despite the low bias in flash rate prediction, the 4 km WRF-Chem simulation matches the observed distribution of
Discussion
P
ap
er
|
Dis
cussion
P
ap
er
|
Discussion
P
ap
e
r
|
Discussion
P
ap
er
|
Fig. 11. Time series and frequency distributions of hourly CG flash counts within the analysis domain
as observed by NLDN and simulated by WRF at 4kmgrid spacing.
39
Fig. 11. Time series and frequency distributions of hourly CG flash
counts within the analysis domain as observed by NLDN and sim-ulated by WRF at 4 km grid spacing.
flashes for high flash rate events and placed the burden of underestimation on the low-end of the distribution, which causes the distribution to appear flatter than observed. Since we are using a constant IC : CG ratio based on Boccippio et al. (2001) climatology instead of the PR93 parameteriza-tion, the erroneous drop-off in the CG flash rate distribution found in the other cases using PR93 is not present. Such im-provement in spectral characteristics suggests that constant climatological IC : CG ratios may be a reasonable if not su-perior alternative to PR93.
5 Conclusions
440 J. Wong et al.: Evaluating lightning parameterization based on cloud-top height
lightning flash rate are evaluated for the simulations with 36 km, 12 km, and 4 km grid spacings over CONUS for JJA 2006 and 2011.
The first result is that, after a 2 km reduction, the use of LNB as a proxy for cloud-top simulated at 36 km grid spac-ing produces CG flash rates at the same order of magni-tude as NLDN observations. For models using other con-vective parameterizations, alternative choices of cloud-top proxies may be available and thus the appropriate methods of cloud-top adjustment should be determined on a case-by-case basis. Taking into account model biases in convection, as quantified by precipitation, the precipitation–lightning re-lation from the model and observations are statistically in-distinguishable. While there is up to a factor of 2.4 median bias in the flash counts from the 2006 36 km simulation, it is accompanied by a 37 % over-prediction in precipitation. In contrast, the 2011 36 km simulation has a precipitation bias of 5 %, which leads to a 13 % over-prediction in flash counts. For the 12 km simulation the lightning flash rate bias is linked to the anomalously strong diurnal cycle simulated for convection, indicated by precipitation. Such bias in the simulated convection may be caused by a number of other model components.
Second, despite the correct CG count, it is shown that PR92 is incapable of producing the correct frequency dis-tribution flash CG flashes, which are truncated at a much lower flash density than observed. The most likely cause is the function form of combining the PR92 total flash rate parameterization and the PR93 IC : CG ratio parameteriza-tion, which produces an upper-limit in the permitted max-imum CG flash rate. This brings into question the validity of PR93 in contexts where spectra characteristics are a con-cern. It is recommended that using constant bulk ratios such as the climatology presented in Boccippio et al. (2001) or one derived from total lightning measurements may produce equal, if not better, spectra. Considering that the observed JJA 2011 IC : CG ratio also displays significant departure from the Boccippio et al. (2001) climatology for certain ar-eas, it would be useful to revisit the subject of IC : CG clima-tology in future studies, taking advantage of the advances in continuous wide-area lightning detections over the past two decades.
Third, due to the use of LNB from the convective param-eterization instead of area-averaged cloud-top heights, us-ing the PR94 factor to adjust for different horizontal reso-lutions is not applicable and an areal ratio factor should be used instead to reconcile the resolution dependencies. Since the 36 km base cases produced relatively satisfying results, the 12 km simulation is scaled with an areal ratio relative to 36 km. However, it may be argued that the outcome from the 36 km simulations is only a corollary of the probability of having exactly one convective core within a single model grid. Therefore, other choices of “base case” grid spacings near 36 km may also produce similar results for CONUS, specifically within the analysis domain (Fig. 1), and other
ar-eas with different storm density may require a different base-case resolution for scaling. On the other hand, area ratios may not be appropriate at coarser resolution as convective core number density is highly non-uniform.
Finally, at 4 km, we used a theoretically similar formula-tion of PR92 based on wmaxwithin convective cores
iden-tified as regions with 20 dBZ or greater radar reflectiv-ity. While the parameterization includes the high flash rate storms, thereby giving a frequency distribution shaped simi-lar to that observed without the erroneous drop-off, the flash count is under-predicted by up to a factor of 10. From this experiment, we see the need to evaluate flash rate param-eterizations with observations for the locations and periods specific to the simulations. It is insufficient to use high reso-lution model results as “truth” for coarse resoreso-lution simula-tions. Hence, validation and tuning prior to further usage of
f (wmax)from Eq. (2) is encouraged. Furthermore, parame-terizing flash rate in cloud-resolving models based on other storm parameters (Barthe et al., 2010) should also be tested. To summarize, we recommend the following when apply-ing the Prince and Rind parameterizations for lightnapply-ing flash rates:
1. Proper adjustment to cloud top should be made to match the expected 20 dBZ radar reflectivity top when apply-ing PR92;
2. PR93 for IC : CG partitioning should be used only if it is unnecessary to get information on the frequency dis-tribution of flashes;
3. Scaling for resolution dependency may be performed by areal ratio against a base-case resolution, defined as that producing 1 storm per grid within the domain of interest (36 km grid spacing in this study).
To further the confidence of the lightning flash rate param-eterizations and IC : CG partitioning, long-term wide-area to-tal lightning detection and data archiving should be accompa-nied by coincident observations of cloud-top or other convec-tive properties with well-defined error characteristics in ob-servations and quantifiable predictability in numerical mod-els.
Appendix A
Comments on cloud-top height reduction
J. Wong et al.: Evaluating lightning parameterization based on cloud-top height 441
method produces an integrated flash count consistent with that observed after taking into account model biases in con-vective precipitation, we acknowledge that storm-to-storm variability cannot be captured by such a simple approach. Presented in this section are offline calculations of both 20 dBZ cloud tops and LNB cloud tops from a 13-day sim-ulation at 4 km grid spacing to understand the margin of po-tential errors.
Radar reflectivity is estimated by using rain, snow, and graupel particle information from hourly outputs. For con-sistency, the offline calculation of reflectivity uses the same modified equations from Smith et al. (1975) and criteria as those used in the 4 km simulation. The highest model level with more than 20 dBZ is then defined as the 20 dBZ top.
LNB is estimated by a simple “parcel method,” rather than emulating the full algorithm in the parameterization as imple-mented in WRF. Therefore, the result may differ from what would be produced within the model. First, the dew point depression at the surface model level is determined, which is then used to seek the lifting condensation level (LCL) as-suming adiabatic ascent. From the LCL, the moist adiabatic lapse rate (0m) is calculated and the level of free
convec-tion (LFC) is determined by linearly extrapolating the moist adiabat using the lower level’s0mto the model level
imme-diately above. From the LFC, a search is performed at incre-mental model levels until the LNB is exceeded. Grid points with LFCs<500 m or above-freezing temperature at LNBs are discarded.
In total, 1.34×10⁶columns with sufficient reflectivity and cloud-top heights greater than 5 km AGL are found. The dis-tribution of the differencehhLNB−hdBZiindicates that LNB is higher than the 20 dBZ top 62 % of the time with a mean of 1.1 km and a standard deviation of 2.3 km. Other metrics for defining the required offsets between the two heights can produce different results. For example, to minimize the bias after applying PR92 withh(hLNB−δh)5/ h5dBZi −1
, the re-ductionδh evaluates to 3.27 km. While the 2 km reduction used in this study differs from the two computed here, it is within the calculated range and thus can still be considered a median representation, especially when the uncertainties in the methods used for the offline LNB and radar reflectivity computations are taken into account.
Finally, it is essential to re-emphasize that the choice of cloud-top reduction is specific to the use of the Grell– Devenyi convective parameterization in WRF or other mod-els producing LNB as the best-available proxy for sub-grid cloud-tops. In other models, cloud-top proxies other than LNB may be present. In those cases, an adjustment specific to those proxies should be used if PR92 is the preferred method for parameterization. An alternative would be to reformulate PR92 to be based on LNB, which lies beyond the scope of this paper and may be attempted in the future as needed.
Acknowledgements. This work was supported by the NASA At-mospheric Composition program (grant number NNH07AM47G). We thank Vaisala for providing NLDN data and Earth Networks for providing and preparing ENTLN data for strictly academic research purposes. The computing resources used in this study were provided by NCAR CISL. NCAR is supported by the National Science Foundation. The assistance from Georg Grell (NOAA/ESRL) with the convective parameterization is also greatly appreciated.
Edited by: P. J¨ockel
References
Allen, D., Pickering, K., Duncan, B., and Damon, M.: Impact of lightning NO emissions on North American photochemistry as determined using the Global Modeling Initiative (GMI) model, J. Geophys. Res., 115, doi:10.1029/2010JD014062, http://dx.doi. org/10.1029/2010JD014062, 2010.
Allen, D. J. and Pickering, K. E.: Evaluation of lightning flash rate parameterizations for use in a global chemical transport model, J. Geophys. Res., 107, http://dx.doi.org/10.1029/2002JD002066, 2002.
Allen, D. J., Pickering, K. E., Pinder, R. W., Henderson, B. H., Appel, K. W., and Prados, A.: Impact of lightning-NO on east-ern United States photochemistry during the summer of 2006 as determined using the CMAQ model, Atmos. Chem. Phys., 12, 1737–1758, doi:10.5194/acp-12-1737-2012, 2012.
Barth, M. C., Lee, J., Hodzic, A., Pfister, G., Skamarock, W. C., Worden, J., Wong, J., and Noone, D.: Thunderstorms and upper troposphere chemistry during the early stages of the 2006 North American Monsoon, Atmos. Chem. Phys., 12, 11003–11026, doi:10.5194/acp-12-11003-2012, 2012.
Barthe, C., Deierling, W., and Barth, M. C.: Estimation of to-tal lightning from various storm parameters: A cloud-resolving model study, J. Geophys. Res., 115, doi:10.1029/2010JD014405, http://dx.doi.org/10.1029/2010JD014405, 2010.
Boccippio, D. J.: Lightning scaling relations revis-ited, J. Atmos. Sci., 59, 1086–1104, doi:10.1175/1520-0469(2002)059<1086:LSRR>2.0.CO;2, 2002.
Boccippio, D. J., Cummins, K. L., Christian, H. J., and Goodman, S. J.: Combined Satellite- and Surface-Based Estimation of the Intracloud–Cloud-to-Ground Lightning Ratio over the Continen-tal United States, Mon. Weather Rev., 129, 108–122, 2001. Bright, D., Wandishin, M., Jewell, R. E., and Weiss, S. J.: A
Phys-ically Based Parameter for Lightning Prediction and its Calibra-tion in Ensemble Forecasts, in: Preprints, Conf. on Meteor. Appl. of Lightning Data, Amer. Meteor. Soc., San Diego, CA, 2005. Choi, Y., Wang, Y., Zeng, T., Martin, R. V., Kurosu, T. P., and
Chance, K.: Evidence of lightning NOxand convective
trans-port of pollutants in satellite observations over North America, Geophys. Res. Lett., 32, L02805, doi:10.1029/2004GL021436, 2005.
Choi, Y., Kim, J., Eldering, A., Osterman, G., Yung, Y. L., Gu, Y., and Liou, K. N.: Lightning and anthropogenic NOxsources over
442 J. Wong et al.: Evaluating lightning parameterization based on cloud-top height
Christian, H. J., Driscoll, K. T., Goodman, S. J., Blakeslee, R. J., Mach, D. A., and Buechler, D. E.: The Optical Transient Detector (OTD), in: Proceedings of the 10th International Conference on Atmospheric Electricity, Osaka, Japan, 368–371, 1996. Cooper, O. R., Trainer, M., Thompson, A. M., Oltmans, S. J.,
Tara-sick, D. W., Witte, J. C., Stohl, A., Eckhardt, S., Lelieveld, J., Newchurch, M. J., Johnson, B. J., Portmann, R. W., Kalnajs, L., Dubey, M. K., Leblanc, T., McDermid, I. S., Forbes, G., Wolfe, D., Carey-Smith, T., Morris, G. A., Lefer, B., Rap-pengl¨uck, B., Joseph, E., Schmidlin, F., Meagher, J., Fehsen-feld, F. C., Keating, T. J., Van Curen, R. A., and Min-schwaner, K.: Evidence for a recurring Eastern North America upper tropospheric ozone maximum during summer, J. Geophys. Res., 112, D23304, doi:10.1029/2007JD008710, 2007.
Cummings, K. A., Huntemann, T. L., Pickering, K. E., Barth, M. C., Skamarock, W. C., H¨oller, H., Betz, H.-D., Volz-Thomas, A., and Schlager, H.: Cloud-resolving chemistry simulation of a Hector thunderstorm, Atmos. Chem. Phys., 13, 2757–2777, doi:10.5194/acp-13-2757-2013, 2013.
Cummins, K. and Murphy, M.: An overview of lightning locat-ing systems: history, techniques, and data uses, with an in-depth look at the US, NLDN, IEEE T. Electromagn. C., 51, 499–518, doi:10.1109/TEMC.2009.2023450, 2009.
Deierling, W. and Petersen, W. A.: Total lightning activity as an in-dicator of updraft characteristics, J. Geophys. Res., 113, D16210, doi:10.1029/2007JD009598, 2008.
Emmons, L. K., Walters, S., Hess, P. G., Lamarque, J.-F., Pfis-ter, G. G., Fillmore, D., Granier, C., Guenther, A., Kinnison, D., Laepple, T., Orlando, J., Tie, X., Tyndall, G., Wiedinmyer, C., Baughcum, S. L., and Kloster, S.: Description and evaluation of the Model for Ozone and Related chemical Tracers, version 4 (MOZART-4), Geosci. Model Dev., 3, 43–67, doi:10.5194/gmd-3-43-2010, 2010.
Futyan, J. M. and Del Genio, A. D.: Relationships between light-ning and properties of convective cloud clusters, Geophys. Res. Lett., 34, L15705, doi:10.1029/2007GL030227, 2007.
Grell, G. A. and Devenyi, D.: A generalized approach to parameterizing convection combining ensemble and data assimilation techniques, Geophys. Res. Lett., 29, 1693, doi:10.1029/2002GL015311, 2002.
Grell, G. A. and Devenyi, D.: A generalized approach to parame-terizing convection combining ensemble and data assimilation techniques, Geophys. Res. Lett., 29, http://dx.doi.org/10.1029/ 2002GL015311, 2002.
Grell, G. A., Peckham, S. E., Schmitz, R., McKeen, S. A., Frost, G., Skamarock, W. C., and Eder, B.: Fully coupled “online” chem-istry within the WRF model, Atmos. Environ., 39, 6957–6975, 2005.
Grewe, V., Brunner, D., Dameris, M., Grenfell, J. L., Hein, R., Shin-dell, D., and Staehelin, J.: Origin and variability of upper tro-pospheric nitrogen oxides and ozone at northern mid-latitudes, Atmos. Environ., 35, 3421–3433, 2001.
Hansen, A. E., Fuelberg, H. E., Pickering, K. E., Peckham, S. E., and Hart, R. E.: Lightning NOxparameterization for WRF-Chem
at the regional scale, in: 92nd Amer. Meteor. Soc. Annual Meet-ing, New Orleans, Louisiana, 2012.
Hong, S.-Y., Noh, Y., and Dudhia, J.: A new vertical diffusion pack-age with an explicit treatment of entrainment processes, Mon. Weather Rev., 134, 2318–2341, doi:10.1175/MWR3199.1, 2006.
Hudman, R. C., Jacob, D. J., Turquety, S., Leibensperger, E. M., Murray, L. T., Wu, S., Gilliland, A. B., Avery, M., Bertram, T. H., Brune, W., Cohen, R. C., Dibb, J. E., Flocke, F. M., Fried, A., Holloway, J., Neuman, J. A., Orville, R., Perring, A., Ren, X., Sachse, G. W., Singh, H. B., Swanson, A., and Wooldridge, P. J.: Surface and lightning sources of nitrogen oxides over the United States: magnitudes, chemical evolution, and outflow, J. Geophys. Res., 112, D12S05, doi:10.1029/2006JD007912, 2007. Janji´c, Z. I.: The step-mountain eta coordinate model: further
developments of the convection, viscous sublayer, and tur-bulence closure schemes, Mon. Weather Rev., 122, 927–945, doi:10.1175/1520-0493(1994)122¡0927:TSMECM¿2.0.CO;2, 1994.
Kiehl, J. T., Schneider, T. L., Portmann, R. W., and Solomon, S.: Climate forcing due to tropospheric and stratospheric ozone, J. Geophys. Res., 104, 31239–31254, doi:10.1029/1999JD900991, 1999.
Lacis, A. A., Wuebbles, D. J., and Logan, J. A.: Radia-tive forcing of climate by changes in the vertical distri-bution of ozone, J. Geophys. Res. Atmos., 95, 9971–9981, doi:10.1029/JD095iD07p09971, 1990.
Lamarque, J.-F., Emmons, L. K., Hess, P. G., Kinnison, D. E., Tilmes, S., Vitt, F., Heald, C. L., Holland, E. A., Lauritzen, P. H., Neu, J., Orlando, J. J., Rasch, P. J., and Tyndall, G. K.: CAM-chem: description and evaluation of interactive atmospheric chemistry in the Community Earth System Model, Geosci. Model Dev., 5, 369–411, doi:10.5194/gmd-5-369-2012, 2012. Lin, Y.-L., Farley, R. D., and Orville, H. D.: Bulk
pa-rameterization of the snow field in a cloud model, J. Clim. Appl. Meteorol., 22, 1065–1092, doi:10.1175/1520-0450(1983)022¡1065:BPOTSF¿2.0.CO;2, 1983.
Liu, C. and Heckman, S.: Using total lightning data in severe storm prediction: global case study analysis from north America, Brazil and Australia, in: 2011 International Symposium on Lightning Protection (XI SIPDA), 20–24, 2011.
McCaul, E. W., Goodman, S. J., LaCasse, K. M., and Cecil, D. J.: Forecasting Lightning Threat Using Cloud-Resolving Model Simulations, Weather Forecast., 24, 709–729, doi:10.1175/2008WAF2222152.1, 2009.
Michalon, N., Nassif, A., Saouri, T., Royer, J. F., and Pon-tikis, C. A.: Contribution to the climatological study of lightning, Geophys. Res. Lett., 26, 3097–3100, doi:10.1029/1999GL010837, 1999.
Orville, R. E., Huffines, G. R., Burrows, W. R., Holle, R. L., and Cummins, K. L.: The North American lightning de-tection network (NALDN) – first results: 1998–2000, Mon. Weather Rev., 130, 2098–2109, doi:10.1175/1520-0493(2002)130<2098:TNALDN>2.0.CO;2, 2002.
Orville, R. E., Huffines, G. R., Burrows, W. R., and Cummins, K. L.: The North American lightning detection network (NALDN) – analysis of flash data: 2001–09, Mon. Weather Rev., 139, 1305– 1322, doi:10.1175/2010MWR3452.1, 2010.
Petersen, W. A., Christian, H. J., and Rutledge, S. A.: TRMM observations of the global relationship between ice water content and lightning, Geophys. Res. Lett., 32, L14819, doi:10.1029/2005GL023236, 2005.
J. Wong et al.: Evaluating lightning parameterization based on cloud-top height 443
Price, C. and Rind, D.: What determines the cloud-to-ground light-ning fraction in thunderstorms?, Geophys. Res. Lett., 20, 463– 466, doi:10.1029/93GL00226, 1993.
Price, C. and Rind, D.: Modeling global lightning distributions in a general circulation model, Mon. Weather Rev., 122, 1930–1939, 1994.
Rossow, W. and Schiffler, R.: ISCCP cloud data products, Bull. Amer. Meteorol. Soc., 71, 2–20, 1991.
Skamarock, W. C., Klemp, J. B., Dudhia, J., Gill, D. O., Barker, D. M., Duda, M. G., Huang, X.-Y., Wang, W., and Pow-ers, J. G.: A description of the Advanced Research WRF Version 3, NCAR Tech. Note, NCAR/TN-475+STR, 2008.
Skamarock, W. C., Klemp, J. B., Duda, M. G., Fowler, L., Park, S.-H., and Ringler, T.: A multi-scale nonhydrostatic atmospheric model using centroidal voronoi tesselations and c-grid stagger-ing, Mon. Weather Rev., 9, 3090–3105, doi:10.1175/MWR-D-11-00215.1, 2012.
Smith, P. L., Myers, C. G., and Orville, H. D.: Radar reflectivity factor calculations in numerical cloud models using bulk param-eterization of precipitation, J. Appl. Meteorol., 14, 1156–1165, doi:10.1175/1520-0450(1975)014<1156:RRFCIN>2.0.CO;2, 1975.
Stevenson, D. S., Dentener, F. J., Schultz, M. G., Ellingsen, K., van Noije, T. P. C., Wild, O., Zeng, G., Amann, M., Ather-ton, C. S., Bell, N., Bergmann, D. J., Bey, I., Butler, T., Co-fala, J., Collins, W. J., Derwent, R. G., Doherty, R. M., Drevet, J., Eskes, H. J., Fiore, A. M., Gauss, M., Hauglustaine, D. A., Horowitz, L. W., Isaksen, I. S. A., Krol, M. C., Lamarque, J. F., Lawrence, M. G., Montanaro, V., M¨uller, J. F., Pitari, G., Prather, M. J., Pyle, J. A., Rast, S., Rodriguez, J. M., Sander-son, M. G., Savage, N. H., Shindell, D. T., Strahan, S. E., Sudo, K., and Szopa, S.: Multimodel ensemble simulations of present-day and near-future tropospheric ozone, J. Geophys. Res., 111, D08301, doi:10.1029/2005JD006338, 2006.
Takahashi, H. and Luo, Z.: Where is the level of neutral buoy-ancy for deep convection, Geophys. Res. Lett., 39, L15809, doi:10.1029/2012GL052638, 2012.
Thompson, G., Field, P. R., Rasmussen, R. M., and Hall, W. D.: Explicit forecasts of winter precipitation using an improved bulk microphysics scheme. Part 2: implementation of a new snow parameterization, Mon. Weather Rev., 136, 5095–5115, doi:10.1175/2008MWR2387.1, 2008.
Tost, H., J¨ockel, P., and Lelieveld, J.: Lightning and convec-tion parameterisaconvec-tions – uncertainties in global modelling, At-mos. Chem. Phys., 7, 4553–4568, doi:10.5194/acp-7-4553-2007, 2007.
Ushio, T., Heckman, S. J., Boccippio, D. J., Christian, H. J., and Kawasaki, Z.-I.: A survey of thunderstorm flash rates compared to cloud top height using TRMM satellite data, J. Geophys. Res., 106, 24089–24095, doi:10.1029/2001JD900233, 2001.
Vonnegut, B.: Some facts and speculation concerning the origin and role of thunderstorm electricity, in: Severe Local Storms, Meteor. Monogr., 27, American Meteorological Society, 224–241, 1963. Williams, E. R.: Large-scale charge separation in thunderclouds, J. Geophys. Res., 90, 6013–6025, doi:10.1029/JD090iD04p06013, 1985.
Yair, Y., Lynn, B., Price, C., Kotroni, V., Lagouvardos, K., Morin, E., Mugnai, A., and Llasat, M. D. C.: Predicting the potential for lightning activity in Mediterranean storms based on the weather research and forecasting (WRF) model dy-namic and microphysical fields, J. Geophys. Res., 115, D04205, doi:10.1029/2008JD010868, 2010.
Yoshida, S., Morimoto, T., Ushio, T., and Kawasaki, Z.: A fifth-power relationship for lightning activity from tropical rainfall measuring mission satellite observations, J. Geophys. Res., 114, D09104, doi:10.1029/2008JD010370, 2009.
Zhao, C., Wang, Y., Choi, Y., and Zeng, T.: Summertime impact of convective transport and lightning NOxproduction over North