Munich Personal RePEc Archive
“Every cloud has a silver lining”; to what
extent does the Arab Spring accelerate
the integration among Arab monarchies?
Bouoiyour, Jamal and Selmi, Refk and Miftah, Amal
December 2015
Online at
https://mpra.ub.uni-muenchen.de/70942/
1
“Every cloud has a silver lining”; to what extent does the Arab Spring
accelerate the integration among Arab monarchies?
Jamal BOUOIYOUR1
Refk SELMI2*
Amal MIFTAH3
Abstract: This study fleshes out the role that may play the Arab revolution in strengthening
regional integration. It rigorously assesses the extent of change in the degree of financial
interdependence among Arab Monarchies (i.e., Arab Gulf countries, Jordan and Morocco)
with the onset of the Arab Spring events. Our results reveal a significant time-varying volatility spillover effects, highlighting a greater interdependency across the focal Arab stock markets. It is also well shown that compared to the Morocco, there is a higher degree of financial integration of Jordan vis-à-vis the Gulf countries. Notably, a different integration patterns arises when accounting for the aftermath of revolution. Under the post-uprisings period, the stock market correlation between Morocco and Gulf countries increase substantially to values as high as the ones of Jordan. This implies that the Arab Spring has changed the nature of shock transmission between these countries, and thus may be perceived as a revival of integration.
Keywords: Arab Spring; Arab stock markets; financial integration.
JEL Codes: C11;C58; F36; G11; G15.
1
CATT, University of Pau, France; E-mail: [email protected]
2
Tunis Business School, Tunisia; E-mail: [email protected].
3
2
1.
Introduction
On December 2010, vegetable vendor Mohamed Bouazizi set himself in Sidi Bouzid in central Tunisia. His suicide has served as an ultimate act of massive protests throughout the
country. To some extent, Bouazizi‟s self-immolation has sparked a dramatic political
upheaval among many Middle East and North African countries where the political leaders grew cocky and distant over time from their own populations. This event, often known as the
“Arab Spring”, seems a historic crisis that hits especially the Arab world. With the resounding slogans “the people want to bring down the regime” and “leave”, the popular revolution that
started in Tunisia has spread rapidly like a virus to Egypt, Libya, Yemen and Syria, and has
led to the fall of leaders in these countries (except Syria). A real revolution has occurred in
people's minds, through a shift in consciousness: the air of desperation in the past has given way to a ray of hopefulness, debunking the idea that freedom and democracy do not suit the Arabs. It has morphed then into a contagion that widely affects monarchical systems in Bahrain, Jordan and Morocco. Revolts and protest movements had taken place also in almost
all Gulf Council Cooperation (GCC)4 states. More precisely, Bahrain and Oman have
witnessed public protests, whereas the rest of GCC countries have experienced short-lived popular movements (especially in Kuwait). With the severe protests worthy observed in Syria, Libya, Yemen and Bahrain, the GCC countries have pursued a policy of counter-revolution inside the Gulf area and pro-revolution outside it. The central policy objective of the GCC was to effectively manage the profound turbulence inside by raising its clout, and to shore up heavy friendly regimes outside. In fact, the Arab Spring events of 2011 shook the Middle East and North Africa (MENA) region as a whole and brought in its wake unintended consequences. If the Gulf and North Africa (excluding Libya and Tunisia) have weathered the implications of the Arab uprisings, some new geopolitical risks are emerged resulted in very active and careful risk response. Clearly, the GCC countries have demonstrated an apparent attachment to maintain the Arab monarchical system of power that serves the interests of regional stability and pre-empts Arab spring unrest at home. Specifically, they are increased their influence and protection over the monarchical regimes in Bahrain, Jordan, Morocco and Oman, which are undergoing periods of profound political and economic transition, through an official financial assistance or varied investment channels and via a formal invitation of Morocco and Jordan to join the GCC in 2011.
Creating a “club of monarchies” may have a powerful role in accelerating the financial integration across the Arab monarchies. The study of stock market integration which has recently received much interest in a variety of literatures, especially in international finance, documented that one significant benefit of capital markets integration is that it generally diversifies regionally/internationally the country-specific risk and thus improves risk sharing across borders (Joost and Luc 2007; Bekaert and Urias 1995; Sorensen et al. 2007; Driessen and Laeven 2007). Further, a deeper integration is believed (i) to appropriately respond to the challenges that may stem from the uncertain environment and to mitigate potential vulnerabilities, (ii) to have benefits in achieving an effective allocation of capital (Heathcote and Perri 2004), (iii) to help better share financial risk by lessening the adverse volatility
4
3
spillover effects, (iv) to enhance the transparency of risk recognition in the financial system, and (v) to reach a sound economic dimension of cooperation.
Note that the study of financial integration has lacked analysis within MENA region and GCC area frameworks. Very few studies have focused on MENA stock markets and exclusively on the GCC stock markets by investigating for example their efficiency (Dahel and Laabas 1999) or their interactions with oil prices (Maghyereh and Al-Kandari 2007). Our
research is a first attempt to empirically examine the issue of financial integration across Gulf
countries, Jordan and Morocco while taking into account the aftermath of the “Arab Spring”
events. It discusses the implications of these events in term of increasing correlation between national financial markets of Arab monarchies (i.e., GCC, Morocco and Jordan) and thus improving the opportunities for the Gulf States to boost and diversify their engagement in the MENA region and to limit the impact of an unexpected political change. For Jordan and Morocco, the current political changes give them the opportunity to tackle their socioeconomic structural problems and pave the way for their economic and financial integration into Golf countries. Certainly, they have latterly received generous financial aid packages from GCC states given that evidence for these two countries suggests that they have benefitted from a strong growth in incoming investments (in particular from the Saudi Arabia,
Kuwait and the UAE) and financial aid5 from GCC states. The GCC membership may offer
potentially extensive aid and more: trade, investment and oil. Further, expanding GCC membership can deepen military cooperation. So, the relationship is perhaps not as one-side as it might otherwise appear.
The current research attempts to examine the extent of change in the degree of financial interdependence among Arab Monarchies since the start of the Arab uprisings. In
other words, we assess whether a “forced” integration for typically political reasons may
make sense from an economic point of view. For this purpose, we consider two different models. The first one is the DCC-GARCH. In order to incorporate regime shifts into the DCC-GARCH model, we also introduce a dynamic correlation -switching Markov model (the second model). The Bayesian quantile regression was carried out to ensure the robustness of our results (the third model). This is what constitutes the originality of our approach. In the last case, we address the endogeneity problem and include relevant control variables to estimate the linkage between stock markets of the countries studied. Specifically, the paper will seek answers to the following questions: (i) Can the stock markets of the Arab monarchies club be safely served as a diversification opportunity for investors? (ii) To what extent has the Arab Spring spark high degree of financial market integration in the countries studied (i.e., Jordan and Morocco and the GCC members)? (iii) Does the joining the Gulf Cooperation Council pose a threat to Morocco, given its strong links with Europe and its attempts to set up constitutional reforms, which are far concerns of Gulf countries? (iv) Are the newly accessed countries -Jordan and Morocco- having different characteristics (during the integration period)? This paper seeks to answer these questions in the broader context of the burgeoning literature on the financial integration in developing countries. Providing clearer answers to the above questions is crucial to better understanding how the Arab stock markets are becoming interdependent and how this integration has been affected by the 2011
5
4
uprisings. As such, the article proceeds as follows: Section 2 gives a brief survey of the focal stock markets. Section 3 presents the empirical strategy. Section 4 reports the main obtained findings and discusses them. Section 5 deals with conclusions and some implications.
2.
Stock markets in the countries in question: A Brief Survey
Despite considerable diversity among MENA countries, some broad generalisations can be made and explained by their relatively common economic, institutional, political and cultural links. First, MENA region is marked by a low level of financial development. While the ratio of broad money (M2) to GDP - measure of the financial depth- has increased in the MENA region from 56% of GDP in 1990 to 58% in 2006 (pre-crisis level) and 69% in 2013, and the domestic credit to private sector from 30 % to 40% of GDP and 35% in 2013, these rates remain at less than half their corresponding levels in East Asia. In 2013, bank assets accounted for 58% of financial assets in the MENA countries, compared to 66% in emerging Asian countries, and 39% in Latin America (IMF 2010, 2014). Second, MENA capital markets are small compared to other developing regions and until recently financial systems of MENA countries are more dominated by bank system. However, in the recent decade, we have noted a certain stock market emergence. Total market capitalization has increased by 71% between 2008 and 2013 while Bank assets have increased by only 18%. Intuitively, although the GCC economies remain dependent on hydrocarbon extraction implying heightened vulnerability to the fluctuations of oil and gas prices, they have continued to attract foreign investors and are doing relatively better in the financial crisis compared to other emerging economies. In fact, despite the GCC financial markets were shaken by the
financial crisis in Europe and America6 since the latter half of 2008, the GCC economies have
emerged stable from the events of the past years. This can be explained by the fact that all GCC member states have sufficient savings to cushion a sizeable shock (IMF 2012) and a large Sovereign Wealth Funds who are investing abroad and at home and certainly using as political and economical instruments by the GCC states. In the case of Bahrain and Oman (Ramady 2013), which have channelled these funds to local projects in order to stimulate their domestic economies and generate jobs. Other GCC countries (notably Kuwait, Qatar and UAE) use these funds mostly to hedge against domestic economic slowdowns and political risks.
Against the backdrop of an uncertain oil market and the Spring Arab events of 2011, the GCC countries are undergoing far-reaching changes on several fronts. First, on the economic side, they are forced to achieve sustainable growth by diversifying their non-oil tradable sectors and finding other sources of economic growth and export revenues. Within this framework, they must be able to deal with the lack of skills and the workforce skill set.
Second, in term of Gulf States‟ regional and foreign policy, in the 2000s the oil-rich Gulf countries (Saudi Arabia, Kuwait, Qatar, and UAE) have opted for a model based on the diversification of geopolitical and geo-economic interests and the integration into South-South frameworks (Ulrichsen 2013). Nevertheless, further actions are still needed to minimize possible harmful vulnerabilities and better diversify their economies.
6
5
Most remarkably, oil-rich Gulf States have deployed larger amounts of aid to
appropriately respond to the political and economic changes triggered by the onset of “Arab spring”. Despite the GCC region remains politically stable, except Bahrain and Oman which are the two GCC countries most threatened by uprisings events, the non-GCC
Arabic-speaking countries7 are affecting directly or indirectly by regional tensions. It is likely that,
given the volatility of political regimes in the transition states like Egypt and the prevalence of regimes that are not necessarily favourably inclined towards some GCC States, this may have been a reason for this trend. These geopolitical risks seem the ever-present peril of GCC states (Kern 2012). The 2011 uprisings were sudden, exceptional and youthful. The spontaneity and the speed characterizing these events have created bafflement and exceeded expectations. In response, in 2011 the Saudi Arabia has offered GCC membership to Jordan and Morocco and
has announced the implementation of „Gulf Union‟, a step to accelerate the inter-sub-regional integration between the GCC and these two monarchical regimes and eventually to prepare the future intra-regional trade, bringing wider economic diversification. This is a scenario that is very likely to emerge in the short-run. The common market in the region may be a desirable way to inter-sub-regional financial integration.
Looking at the characteristics of the stock markets in these countries, it is clearly noticeable that they tended to be strongly differentiated in terms of their size, degree of liquidity and stage of liberalization which is mainly due to the institutional framework for capital markets and national legislation. It bears to mention that in recent years restructuring the ownership and the legal form of Arab exchanges has grown (like the privatisation of the
Kuwait Stock Exchange and the demutualisation8 of the Moroccan Stock Exchange). But,
currently, the level of institutional investment in Arab capital markets is relatively low,
reflecting the low level of development of local pension, insurance and mutual funds. Likewise, foreign institutional capital (pension funds or insurance companies for example) is low in most markets of the Arab region and especially in Saudi Arabia and Qatar due to investment restrictions (OECD 2014). Similarly, there is a limited access for foreign investors in the GCC region in particular where the opening up to financial flows from overseas has remained concentrated in the three dominant financial markets, the UAE, Qatar, and Saudi Arabia (Kern 2012). However, in the case of Morocco and Jordan, the massive privatization plans and the open access to foreign investors have contributed significantly to the growth performance of their stock markets. For the case of Morocco for example, the foreign investments to market capitalization represent almost 26.5% in 2012 and 30.37% in 2013 and the analysis of the distribution of foreign equity investments by region of origin shows that European investors remain the main holders with 80.55% of total foreign investment volume in 2013, in second place come the Middle Eastern investors (from the Emirate essentially) with 10.47%, North America with 3.98%, Asia with 2.66% and Africa with 2.34% (CDVM report 2014).
7
These countries are Egypt, Iraq, Jordan, Lebanon, Libya, Morocco, Syria, Tunisia, and Yemen. There are also the non-GCC oil exporters, i.e., Iraq, Iran and Libya which are affecting by other events as the military intervention or the international sanctions. Only Algeria has maintained a steady growth trajectory.
8
6
With regard to a number of other salient features, the stock markets in the countries studied are still very small compared to other emerging markets (especially in Asia and Latin
America). In addition, the overall volume of assets managed by institutional investors9 and
wealthy families is very important in the GCC region. The total capitalization of the eight Arab bourses has reached $780 billion at the end of 2012 which accounts for 67.7% of the
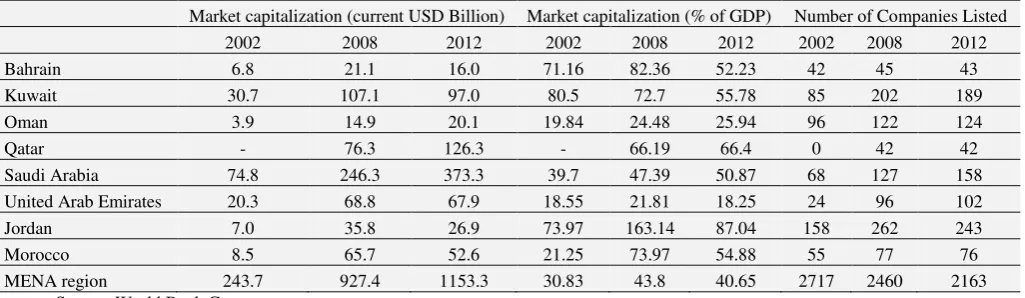
[image:7.595.43.556.287.436.2]MENA countries‟ markets. Table 1 worthy depicts that the Saudi stock market is the largest of the eight and also of all Arab stock markets in term of capitalization, accounting for one half of the total market capitalization of the stocks studied in 2012 followed by the Qatar market with a capitalization accounting for 16 per cent. Morocco and Jordan experienced a decline in stock market capitalization between 2008 and 2012 after its improvement in the early 2000s before the current financial crisis.
Table 1. Some characteristics of the stock markets studied
Market capitalization (current USD Billion) Market capitalization (% of GDP) Number of Companies Listed 2002 2008 2012 2002 2008 2012 2002 2008 2012 Bahrain 6.8 21.1 16.0 71.16 82.36 52.23 42 45 43 Kuwait 30.7 107.1 97.0 80.5 72.7 55.78 85 202 189 Oman 3.9 14.9 20.1 19.84 24.48 25.94 96 122 124
Qatar - 76.3 126.3 - 66.19 66.4 0 42 42
Saudi Arabia 74.8 246.3 373.3 39.7 47.39 50.87 68 127 158 United Arab Emirates 20.3 68.8 67.9 18.55 21.81 18.25 24 96 102 Jordan 7.0 35.8 26.9 73.97 163.14 87.04 158 262 243 Morocco 8.5 65.7 52.6 21.25 73.97 54.88 55 77 76 MENA region 243.7 927.4 1153.3 30.83 43.8 40.65 2717 2460 2163
Source: World Bank Group;
Notes: A market capitalization to GDP ratio greater than 100% shows that the market is overvalued, while a value of around 50% shows undervaluation.
3.
Empirical strategy
The methodological framework consists on applying DCC-GARCH and smoothed probabilities (SM-DCC-GARCH) on the one hand, and Bayesian quantile regression on the other hand. While the DCC-GARCH may allow us to have a full picture regarding the financial volatility spillovers across different Arab monarchies (i.e., GCC, Jordan and Morocco), the method of smoothed probabilities describes the time series that exhibit breaks in their volatile behaviors. The Bayesian method for quantile regression may help us to reach better paths, since it enables to assess how interact the different quantiles involved of Stock markets of Jordan and Morocco vis-à-vis those of GCC, while avoiding the limits of linear quantile regression analysis where optimization and inference are awkward (Benoit and Poel 2012). Potential control variables were incorporated to see whether they play a powerful role in explaining the stock market performance and also the correlation between markets, while controlling for possible endogeneity bias. These variables are inflation (INF) and industrial production (IP) used as real shock proxies and real interest rate (IR) as indicator of monetary
9
7
shock10. Real returns are computed as nominal returns less the expected inflation rate, which
is determined through a one-step-ahead forecast based on the VAR-system considered with a constant and four optimal lags. Specifically, the expected inflation rate is estimated from an autoregressive integrated moving average (ARIMA) model of the actual inflation rate while controlling for possible seasonal components.
The sample consists of six GCC countries (i.e., Bahrain, Qatar, Oman, Saudi Arabia, UAE and Kuwait) and two other Middle East North African countries (i.e., Jordan and Morocco). The stock market indices are: BSE for Bahrain, QSE for Qatar, MSM30 for Oman, TASI for Saudi Arabia, ADX for UAE, KSE for Kuwait, ASE for Jordan and MASI for Morocco. To estimate DCC-GARCH model and smoothed probabilities, we have used daily frequency data from 01/01/2008 to 31/12/2014 collected from quandl website. For Bayesian quantile regression model, we have regressed separately for Jordan and Morocco their stock market returns on GCC stock market returns. As mentioned earlier, some control variables
that may have “pulling” role for explaining the connection between stock markets were
included. These variables are unfortunately unavailable in daily frequency and thus we use quarterly data in this case spanning between the first quarter of 1990 and the third quarter of
2014. The data have been collected from EconstatsTM.
3.1. DCC-GARCH and smoothed probabilities
The accurate identification of interdependencies between financial assets is one of the most important ingredients in financial applications. Recent years have witnessed a remarkable interest in risk management, portfolio hedging and phenomena involving stock markets such as spillovers and co-movements. The present research strives to contribute to this strand of empirical works that focus on the dependence patterns exhibited by markets. Although the volatility spillovers and time-varying correlations are both of utmost importance, the existing empirical literature has dealt more considerably with the performance of volatility spillover models. The multivariate GARCH models are desirable since they allow finding better decision tools in various areas including asset pricing, portfolio selection, etc. From 1990, several new techniques were successively developed such as the constant conditional correlation (CCC)-GARCH model introduced by Bollerslev et al. (1993), and the principal component GARCH model applied by Ding (1994). At the beginning of the 2000s, Ding and Engle (2001) and Engle (2002) have presented a time-varying model named the dynamic conditional correlation (DCC)-GARCH model that can be considered as CCC-GARCH model extension. This latter can properly and appropriately determine the conditional covariance and correlation between several markets. It may be useful and helpful for policymakers, practitioners and asset managers to better understand how the volatility of each market yields to the volatilities of other markets.
In the current research, we employ the dynamic conditional correlation based on Ling and McAleer (2003):
10
8 t t t t i t p i i t z D R R
1 0 (1)where Dt is the vector of the conditional volatility terms ; The conditional mean of the return
vector Rt is specified as a vector autoregressive process of order p with parameter matrices i,
i=1,2,...,p. The unexplained componentt follows a GARCH specification described as
) , 0 (
/ t 1 t
t ID P
where Ptis the time-varying variance-covariance matrix.
Denoting the conditional variance matrix as Ht, we impose the specification which
enables to properly depict the volatility spillover in the following model:
1 1
t t
t w A BH
H
(2)
where w is a (2x1) vector of constants, A and B are the matrices (2x2) for the ARCH and
GARCH effects.
Based on Engle (2002)‟s study, the conditional correlation can vary over time by
specifying the variance-covariance matrix Pt Dtt with t specified as the conditional
correlation matrix. In order to incorporate regime shifts into the DCC-GARCH model, we refer to Billio and Caporin (2005) and Billio et al. (2006) and introduce a Markov -switching dynamic correlation model (MS-DCC-GARCH). By doing so, the obtained correlations are both time-varying and regime-switching. The main focus of this econometric method is to describe the time series that exhibit breaks in their volatile behaviors. This method allows us to capture discrete regime shifts that can govern each conditional variance process. In other words, within a probabilistic fashion, the parameters of each process may change over time. The switching mechanism between the states is Markovian and is assumed to be governed by an unobserved (latent) random variable. The underlying processes, though, do not have to be Markovian, but are often assumed to be independent from each other. In the simplest case of a
two-state model, the volatility can be assumed to display either high in regime one (S(1))or
low in regime two (S(2)). Hence, we have the probability of the transition from one state to
another. The transition matrix P contains the probabilities pi j of switching from regime i at
time t to regime j at time t + 1:
21 12 21 12 22 12 21 11 1 1 p p p p p p p p p P ij (3)
Concentrating on the dependence structure, the combination between dynamic conditional correlation and Markov-switching model seems to provide a useful supplement
and new insights into a “complex phenomenon” as financial integration. This mixture is a
succinct representation of the dependencies between underlying variables, allowing us to find both volatility spillover and regime-switching dynamic correlation. The dynamic correlation
is described as a Markov chain, where probability P denotes the probability of state one being
9
3.2. A Bayesian quantile regression model
Although there is a rapidly expanding empirical literature on quantile regression (QR) in economics, the studies on Bayesian quantile regression (BQR) seem relatively limited. The conventional techniques describe how the mean of y changes with the vector of covariates. The error is assumed to have the same distribution whatever values may be taken by the components of the vector x. The latter affects only the location of the conditional distribution of y, but not its scale. As the mean gives an incomplete picture of a single distribution, the regression gives also incomplete picture for a set of distributions. Consequently, Quantile regression has emerged as a good supplement to ordinary mean regression, since it is likely to provide an accurate description of changes rather than focusing solely on the mean. The upper or lower quantiles of the response variable may depend on the covariates very differently
from the center11. However, this technique seems restrictive because it involves minimal
assumptions (i.e., the error distribution) that may lead to non-normal errors. A satisfactory inference procedure is difficult to be tackled, since the asymptotic covariance matrix of quantile estimates normally make us an unknown error density function, which cannot be estimated reliably. Recent researches have opened the way to a new Bayesian treatment of quantile regression, highlighting that BQR performs well in avoiding the restrictive parametric assumption. Given this, the current study relies on quantile inference approach via Bayesian modeling. The latter possesses considerable advantages compared to the usual quantile regression estimates. First, Markov Chain Monte Carlo (MCMC) method can be
easily carried out to obtain the posterior distributions even in “complex” situations. Second, it
performs appropriately when the conditional distribution is not symmetric. Even though the QR restriction may be avoided by minimizing the objective function, the BQR must specify precise likelihood. The Asymmetric Laplace (ASL) distribution that prompts equivalence between posterior mode and simple quantile regression estimates has been carried out to construct Bayesian quantile regression model (Yu and Moyeed 2001). Given this, a specific distributional assumption for the error terms has been defined (Yue and Rue 2011):
n i
x
yi i' i , 1,...,
(4)
For the τ th conditional quantile function, 0 < τ < 1, the ˆ() is called the τth regression
quantile and defined as a solution to the following problem:
) (
) ( ˆ
1
min
arg
i
n i
i x
y
(5)
where ρτ is a weight calculated by(y) y( I(y0)), I (.) is the indicator function and
0< τ <1.
Following the ASL distribution, errors are independent and identically distributed, i.e.,
(
i
2 ) i.i.d ASL (0,
2,
), with the following density:
2 2
2
) 0 , ( exp ) 1
( i
i i
p (6)
11
10
Then, the error distributions yield yi ,2 ~ASL(x'i ,) such that the density of
the responses is expressed as follows:
2 2 2 ' ) ' , ( exp ) 1 (, i i i
i x y x y y
p (7)
While the asymmetric Laplace distribution enables to properly express quantile regression within Bayesian framework, it may lead to more complicated inference based on Markov Chain Monte Carlo simulation. To avoid this apparent complexity, the ASL can be represented as a scale mixture of normal distributions, as following:
( , , )~N(x'i , 2/ )
2
i i
i
i z z
y (8)
where 1 2 , 1 , ) 1 ( 2 1 2 2 i
Ultimately, Bayesian inference can be effectively applied while imputing the scale
variables zi as supplementary unknowns (Fahrmeir et al. 2013). Then, the evolution of
estimator may be sharply observed by setting τ = 0.500 (median regression). The first and the
last quantiles are obtained by setting τ = 0.100 and τ = 0.900, respectively.
4.
Main findings
4.1. MS-DCC-GARCH and smoothed probabilities
4.1.1. The whole period
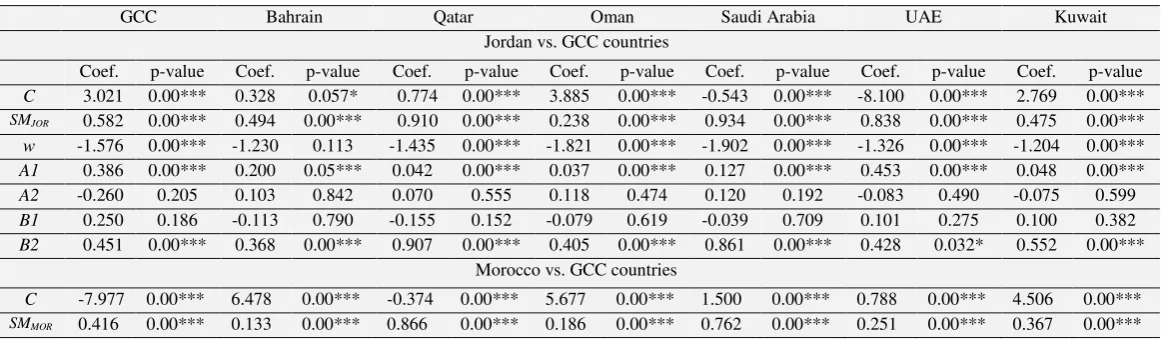
As stated at the outset, we estimate the regime-specific and time-varying correlations MS-DCC-GARCH model specified in Equations (1) and (2). Table 2 summarizes the parameter estimates of this model for the stock markets of the GCC countries vis-à-vis those of Jordan and Morocco (for the whole period, i.e., from 01/01/2008 to 31/12/2014). Our results clearly reveal that returns on market portfolios in these countries are sharply connected, i.e., their movements affect one another. More precisely, the GCC stock markets appear more interdependent with Jordan than Morocco. In fact, judging from the stock market
coefficients (SMJOR :is related to the Jordan‟s stock market and SMMOR to the Morocco‟s stock
market), we worthy notice that there is a great interdependence between Jordan and GCC (58.6%) compared to that between Morocco and GCC (41.6%). Specifically, there are strong interconnections between Jordan and three GCC countries, with Saudi Arabia, Qatar and UAE having 93.4%, 91% and 83.8% respectively. This means that the existence of an exact interdependence between Jordan and GCC stock markets on one hand, and Morocco and GCC in other hand, cannot be ruled out. This can be interpreted as perfect integration between these stock markets in the sense that the returns provided by any of them can be totally determined
by the overall performance in the other markets. The Jordan‟s stock market appears less
connected to Kuwait (57.5%), Bahrain (49.4%) and Oman (23.8%). For the sake of comparison, Morocco is likely to be interdependent with Qatar (86.6%) and Saudi Arabia (76.2%) rather than with Kuwait (36.7%), UAE (25.1%), Oman (18.6%) and Bahrain (13.3%). In sum, Jordan appears more interdependent to GCC countries than Morocco. It was
11
application to join the club, which can be explained by both geopolitical and geographic
proximity reasons.Nevertheless, the GCC decision to invite Morocco to join the organization
was profoundly surprising, because the country has only the geopolitical perspective in its
favor, and hence Morocco‟s membership in the GCC must be followed by several steps to be
successfully achieved. Further, being more interdependent to Saudi Arabia and Qatar than the rest of GCC members seems not surprising, since these countries are recently well positioned to respond effectively to the challenges that may stem from the uncertain environment with
their policy buffers largely eroded, bearing in mind that the Saudi Arabia and Qatar‟s stock
markets are the largest of Arab stock markets in term of stock market capitalization. Larger is the market capitalization, less sizable will be the volatility of stock prices. This implies that the stock markets of Saudi Arabia and Qatar may offer more opportunities to foreign investors and thus the cooperation with them may be more beneficial for both Jordan and Morocco. Furthermore, the parameters of volatility spillover from GCC to Jordan and from GCC
to Morocco (Ai or ARCH effects and Bi or GARCH effects) vary remarkably across the Gulf
countries studied. From the results reported in Table 2, we clearly notice that only A1 and B2 are statistically significant. By considering these coefficients, we provide significant risk transmission from GCC to Jordan and from GCC to Morocco. For Jordan, the volatility spillover from Saudi Arabia, Qatar and UAE appears more persistent than from the rest of GCC countries, reaching respectively 0.94, 0.98 and 0.88 (Table 2). In the case of Morocco, a great volatility spillover was found from Qatar (0.90) and from Saudi Arabia (0.84). Now, what we need to remember about the volatility spillovers from GCC to Jordan and GCC to Morocco? At all cases reported in Table 2, the volatility spillover from GCC to Jordan is stronger than that from GCC to Morocco. We can attribute this outcome to the substantial
interest of Jordan to join the “Gulf club” running high revenues. While Morocco has never
[image:12.595.9.590.592.762.2]shown any particular interest in joining the rich oil Gulf countries, Jordan applied twice, in particular in the 1980 and 1996. Besides, the international portfolio diversification is less effective across the integrated markets (GCC and Jordan), as investment risk cannot be reduced, and portfolio returns can exhibit similar behavior to internal and external shocks. Nevertheless and despite the great risk that may occur when Morocco becomes more integrated with Arab Gulf countries, the low correlation between the two clearly indicates that Morocco can be a good diversification opportunity for investors.
Table 2.Estimates of the MS-DCC-GARCH model
GCC Bahrain Qatar Oman Saudi Arabia UAE Kuwait
Jordan vs. GCC countries
Coef. p-value Coef. p-value Coef. p-value Coef. p-value Coef. p-value Coef. p-value Coef. p-value
C 3.021 0.00*** 0.328 0.057* 0.774 0.00*** 3.885 0.00*** -0.543 0.00*** -8.100 0.00*** 2.769 0.00***
SMJOR 0.582 0.00*** 0.494 0.00*** 0.910 0.00*** 0.238 0.00*** 0.934 0.00*** 0.838 0.00*** 0.475 0.00***
w -1.576 0.00*** -1.230 0.113 -1.435 0.00*** -1.821 0.00*** -1.902 0.00*** -1.326 0.00*** -1.204 0.00***
A1 0.386 0.00*** 0.200 0.05*** 0.042 0.00*** 0.037 0.00*** 0.127 0.00*** 0.453 0.00*** 0.048 0.00***
A2 -0.260 0.205 0.103 0.842 0.070 0.555 0.118 0.474 0.120 0.192 -0.083 0.490 -0.075 0.599
B1 0.250 0.186 -0.113 0.790 -0.155 0.152 -0.079 0.619 -0.039 0.709 0.101 0.275 0.100 0.382
B2 0.451 0.00*** 0.368 0.00*** 0.907 0.00*** 0.405 0.00*** 0.861 0.00*** 0.428 0.032* 0.552 0.00*** Morocco vs. GCC countries
C -7.977 0.00*** 6.478 0.00*** -0.374 0.00*** 5.677 0.00*** 1.500 0.00*** 0.788 0.00*** 4.506 0.00***
12
w -1.324 0.00*** -1.290 0.00*** -1.285 0.00*** -1.445 0.00*** -1.779 0.00*** -3.325 0.00*** -3.942 0.00***
A1 0.004 0.00*** 0.090 0.00*** 0.362 0.00*** 0.155 0.00*** 0.438 0.00*** 0.078 0.00*** 0.039 0.00***
A2 0.025 0.87 0.075 0.43 -0.018 0.820 0.053 0.559 0.107 0.316 0.005 0.996 0.222 0.029*
B1 0.015 0.92 -0.105 0.21 -0.009 0.901 -0.019 0.826 -0.096 0.252 0.016 0.882 -0.165 0.00***
B2 0.543 0.00*** 0.245 0.00*** 0.549 0.00** 0.436 0.00*** 0.412 0.00*** 0.476 0.00*** 0.410 0.00*** Notes: The table reports the estimates of the MS-DCC-GARCH model given in Equations (1)-(3). The GARCH part of the
model is specified as a GARCH (1, 1); ***, ** and * represent significance at the 1%, 5%, and 10% levels, respectively; C: Intercept; A1: ARCH effect at state 1 (low volatility regime); A2: ARCH effect at state 2 (high volatility regime); B1:
GARCH effect at state 1 (low volatility regime); B2: GARCH effect at state 2 (high volatility regime).
To reinforce our findings, a formal volatility spillover tests based on Wald tests
involving two zero restrictions on the potential elements of matrices A and B (i.e., associated
relatively to the ARCH and the GARCH effects) has been applied for the considered countries. More accurately, the null hypothesis of no volatility spillover from the GCC stock markets to the markets of Jordan and Morocco was tested by imposing the restriction
A1i=B1i=0 (where i=2). The test outcomes reported in Table 3 reject the no volatility spillover
[image:13.595.10.587.72.134.2]hypothesis from GCC to Jordan, from GCC to Morocco, from Qatar to Jordan, from Saudi Arabia to Jordan, from UAE to Jordan, from Qatar to Morocco, and then from Saudi Arabia to Morocco. Interestingly, these results suggest and confirm the occurrence of powerful volatility spillover effect from some GCC stock markets to Jordan and Morocco, sustaining the importance of effective cross-border supervision in order to lessen harmful effects of volatility transmission across different stock markets.
Table 3. Volatility spillover tests
Jordan vs. GCC
Jordan vs. Bahrain
Jordan vs. Qatar
Jordan vs. Oman
Jordan vs. Saudi Arabia
Jordan vs. UAE
Jordan vs. Kuwait H0: No volatility spillover from GCC countries to Jordan
9.7654*** (0.0002)
0.6986 (0.1078)
8.0755** (0.0061)
1.0123 (0.8782)
11.2457*** (0.0000)
7.6543** (0.0061)
0.3451 (0.2567) Morocco vs.
GCC
Morocco vs. Bahrain
Morocco vs. Qatar
Morocco vs. Oman
Morocco vs. Saudi Arabia
Morocco vs. UAE
Morocco vs. Kuwait H0: No volatility spillover from GCC countries to Morocco
10.7651** (0.0013)
0.8802 (0.3567)
9.0129*** (0.0001)
0.5643 (0.2678)
8.9777*** (0.0004)
0.6134 (0.7219)
0.8543 (0.1510) Notes: The table reports the Wald tests for testing the no volatility spillover restrictions imposed on Equation (1). The tests report no volatility spillover from GCC countries to Jordan and then to Morocco. The tests are distributed as Chi-square with 2 degrees of freedom. ***, ** and * represent significance at the 1%, 5%, and 10% levels, respectively.
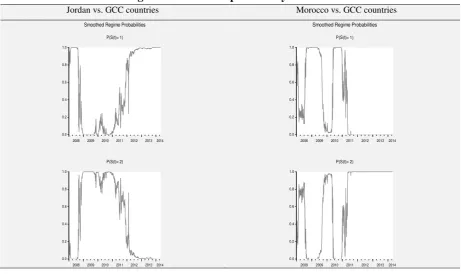
Figure 1 plots the smoothed probability estimates of the low volatility regime (state 1) and the high volatility regime (state 2). The shaded regions sharply observable correspond to the periods where the smoothed probabilities of the regime either lower or higher risk is in its maximum. We worthy depict significant features regarding the dependence between GCC
stock markets and those of Jordan and Morocco. For the correlation between Jordan‟s stock
market and GCC markets, almost 75% of observations fall into low volatility regime, while 25% fall into high volatility regime. The Moroccan and GCC markets seem characterized by high volatility regime period (85%), with almost 15% falling into low volatility state. Given
these observations, the interdependence between GCC and Morocco‟s stock market seems
[image:13.595.63.537.410.533.2]13
exposures in the short-run, it must be done with great care to limit the risks of “forced”
integration. In the long term, sound policies and good institutions are needed to avoid possible painful consequences.
Remarkably, since the end of 2010, a difference in behavior of the two countries is observed. At this period, we note the predominance of low volatility regime in the case of
Jordan and high volatility period for Morocco (Figure 1)12. These results are not surprising
[image:14.595.65.527.289.563.2]because since 2011 the political and geostrategic imponderability has led to a shift to more uncertain financial markets. The popular political movements across Gulf Cooperation Council (GCC) countries have certainly not overlooked since almost all GCC states have confronted some protests. This can explain the sharp switching regime from low volatility regime to high volatility period since 2011. We will see in the following whether these results are solid, by dividing the study period into pre-crisis (2008-2010) and post-crisis (2011-2014).
Figure 1. Smoothed probability estimates
Jordan vs. GCC countries Morocco vs. GCC countries
0.0 0.2 0.4 0.6 0.8 1.0
2008 2009 2010 2011 2012 2013 2014
P(S(t)= 1)
0.0 0.2 0.4 0.6 0.8 1.0
2008 2009 2010 2011 2012 2013 2014
P(S(t)= 2)
Smoothed Regime Probabilities
0.0 0.2 0.4 0.6 0.8 1.0
2008 2009 2010 2011 2012 2013 2014
P(S(t)= 1)
0.0 0.2 0.4 0.6 0.8 1.0
2008 2009 2010 2011 2012 2013 2014
P(S(t)= 2)
Smoothed Regime Probabilities
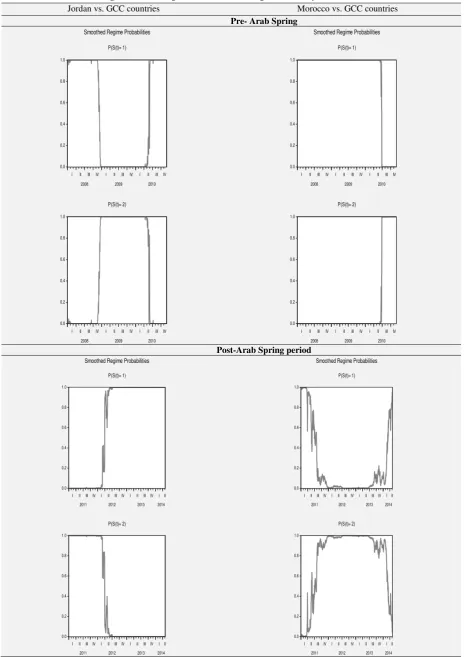
4.1.2. Results by sub-periods
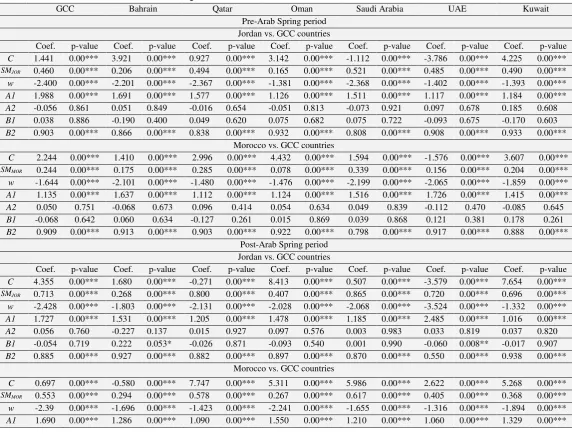
To reinforce the evidence that the Arab Spring may be perceived as a potential revival of financial integration among Gulf Arab countries, Jordan and Morocco, the study period has been divided into two sub-periods, i.e., the period spanning between 01/01/2008 and 31/11/2010 (pre-Arab Spring) and the period from 01/01/2011 to 31/12/2014 (post-Arab Spring). The results obtained with MS-DCC-GARCH are reported in Table 4. These determine whether there is a sharp change in the relations among capital markets in the countries studied and their interdependence over each study periods. These findings may be summarized as follows:
(i) For Jordan, there is a great change in terms of interdependence between its stock
market and the GCC markets. Specifically, we worthy note that the correlation between
12
14
Jordan‟s stock market and Gulf Arab stock markets moves from 46% for the period before
Arab Spring to 71% in the post-uprisings period. There is an increase by more than half (54.34%).
(ii)For Morocco, a remarkable change is observed when moving from the first sub-period
to the second one. For instance, the interconnection between Moroccan stock market and GCC markets increases intensely from 24% to 55% under the post-uprisings. The correlation expands more than doubled (120.83%).
Despite the role that may play revolts and massive protests in threatening and
decaying the economy in the whole, it may also play as a “wake-up call” for deepening the
stock market interdependence between GCC and Jordan and GCC and Morocco13. This result
[image:15.595.13.586.306.741.2]seems fruitful and promising. This interdependency can enhance the tax and financial systems and loosely bring the financial legislations of these countries in the hope of producing a sound environment for the conditions of merger across Arab monarchical systems.
Table 4.Sub-periods Estimates of the MS-DCC-GARCH model
GCC Bahrain Qatar Oman Saudi Arabia UAE Kuwait
Pre-Arab Spring period Jordan vs. GCC countries
Coef. p-value Coef. p-value Coef. p-value Coef. p-value Coef. p-value Coef. p-value Coef. p-value
C 1.441 0.00*** 3.921 0.00*** 0.927 0.00*** 3.142 0.00*** -1.112 0.00*** -3.786 0.00*** 4.225 0.00***
SMJOR 0.460 0.00*** 0.206 0.00*** 0.494 0.00*** 0.165 0.00*** 0.521 0.00*** 0.485 0.00*** 0.490 0.00***
w -2.400 0.00*** -2.201 0.00*** -2.367 0.00*** -1.381 0.00*** -2.368 0.00*** -1.402 0.00*** -1.393 0.00***
A1 1.988 0.00*** 1.691 0.00*** 1.577 0.00*** 1.126 0.00*** 1.511 0.00*** 1.117 0.00*** 1.184 0.00***
A2 -0.056 0.861 0.051 0.849 -0.016 0.654 -0.051 0.813 -0.073 0.921 0.097 0.678 0.185 0.608
B1 0.038 0.886 -0.190 0.400 0.049 0.620 0.075 0.682 0.075 0.722 -0.093 0.675 -0.170 0.603
B2 0.903 0.00*** 0.866 0.00*** 0.838 0.00*** 0.932 0.00*** 0.808 0.00*** 0.908 0.00*** 0.933 0.00*** Morocco vs. GCC countries
C 2.244 0.00*** 1.410 0.00*** 2.996 0.00*** 4.432 0.00*** 1.594 0.00*** -1.576 0.00*** 3.607 0.00***
SMMOR 0.244 0.00*** 0.175 0.00*** 0.285 0.00*** 0.078 0.00*** 0.339 0.00*** 0.156 0.00*** 0.204 0.00***
w -1.644 0.00*** -2.101 0.00*** -1.480 0.00*** -1.476 0.00*** -2.199 0.00*** -2.065 0.00*** -1.859 0.00***
A1 1.135 0.00*** 1.637 0.00*** 1.112 0.00*** 1.124 0.00*** 1.516 0.00*** 1.726 0.00*** 1.415 0.00***
A2 0.050 0.751 -0.068 0.673 0.096 0.414 0.054 0.634 0.049 0.839 -0.112 0.470 -0.085 0.645
B1 -0.068 0.642 0.060 0.634 -0.127 0.261 0.015 0.869 0.039 0.868 0.121 0.381 0.178 0.261
B2 0.909 0.00*** 0.913 0.00*** 0.903 0.00*** 0.922 0.00*** 0.798 0.00*** 0.917 0.00*** 0.888 0.00*** Post-Arab Spring period
Jordan vs. GCC countries
Coef. p-value Coef. p-value Coef. p-value Coef. p-value Coef. p-value Coef. p-value Coef. p-value
C 4.355 0.00*** 1.680 0.00*** -0.271 0.00*** 8.413 0.00*** 0.507 0.00*** -3.579 0.00*** 7.654 0.00***
SMJOR 0.713 0.00*** 0.268 0.00*** 0.800 0.00*** 0.407 0.00*** 0.865 0.00*** 0.720 0.00*** 0.696 0.00***
w -2.428 0.00*** -1.803 0.00*** -2.131 0.00*** -2.028 0.00*** -2.068 0.00*** -3.524 0.00*** -1.332 0.00***
A1 1.727 0.00*** 1.531 0.00*** 1.205 0.00*** 1.478 0.00*** 1.185 0.00*** 2.485 0.00*** 1.016 0.00***
A2 0.056 0.760 -0.227 0.137 0.015 0.927 0.097 0.576 0.003 0.983 0.033 0.819 0.037 0.820
B1 -0.054 0.719 0.222 0.053* -0.026 0.871 -0.093 0.540 0.001 0.990 -0.060 0.008** -0.017 0.907
B2 0.885 0.00*** 0.927 0.00*** 0.882 0.00*** 0.897 0.00*** 0.870 0.00*** 0.550 0.00*** 0.938 0.00*** Morocco vs. GCC countries
C 0.697 0.00*** -0.580 0.00*** 7.747 0.00*** 5.311 0.00*** 5.986 0.00*** 2.622 0.00*** 5.268 0.00***
SMMOR 0.553 0.00*** 0.294 0.00*** 0.578 0.00*** 0.267 0.00*** 0.617 0.00*** 0.405 0.00*** 0.368 0.00***
w -2.39 0.00*** -1.696 0.00*** -1.423 0.00*** -2.241 0.00*** -1.655 0.00*** -1.316 0.00*** -1.894 0.00***
A1 1.690 0.00*** 1.286 0.00*** 1.090 0.00*** 1.550 0.00*** 1.210 0.00*** 1.060 0.00*** 1.329 0.00***
13
15
A2 0.081 0.762 0.013 0.960 0.020 0.910 0.052 0.842 -0.064 0.689 -0.065 0.6598 -0.014 0.934
B1 -0.03 0.880 -0.177 0.468 0.010 0.938 -0.029 0.894 0.109 0.488 0.119 0.4057 0.065 0.662
B2 0.893 0.00*** 0.899 0.00*** 0.928 0.00*** 0.874 0.00*** 0.909 0.00*** 0.939 0.00*** 0.898 0.00*** Notes: The table reports the estimates of the MS-DCC-GARCH model given in Equations (1)-(3). The GARCH part of the
model is specified as a GARCH (1, 1); ***, ** and * represent significance at the 1%, 5%, and 10% levels, respectively; C: Intercept; A1: ARCH effect at state 1 (low volatility regime); A2: ARCH effect at state 2 (high volatility regime); B1:
GARCH effect at state 1 (low volatility regime); B2: GARCH effect at state 2 (high volatility regime).
Moreover, by dividing the whole period into two sub-periods, we confirm the above obtained evidence that the Arab Spring accentuates the volatility spillovers among Arab stock markets considered. More precisely, our results reported in Table 5 reveal that:
(i) Before the Arab Spring, we accept the no volatility spillover hypothesis for almost all
the studied cases with the exception of the linkages running from Saudi Arabia to Jordan, Qatar to Jordan and Saudi Arabia to Morocco.
(ii)In post-Arab spring period, we reject the no volatility spillover hypothesis for the
[image:16.595.12.590.72.109.2]majority of GCC countries to Jordan and then to Morocco, except the spillovers from Bahrain to Morocco and that from Oman to Morocco. This means that the Arab Spring has succeeded to revive interconnections among these Arab monarchies.
Table 5. Sub-period volatility spillover tests Pre-Arab Spring period
Jordan vs. GCC Jordan vs. Bahrain Jordan vs. Qatar Jordan vs. Oman
Jordan vs. Saudi Arabia
Jordan vs. UAE
Jordan vs. Kuwait H0: No volatility spillover from GCC countries to Jordan
0.7893 (0.2345) 0.4387 (0.2108) 6.1354*** (0.0000) 0.9312 (0.7655) 7.1345** (0.0059) 0.6123 (0.5517) 1.1345 (0.8250) Morocco vs. GCC Morocco vs. Bahrain Morocco vs. Qatar Morocco vs. Oman Morocco vs. Saudi Arabia Morocco vs. UAE Morocco vs. Kuwait H0: No volatility spillover from GCC countries to Morocco
0.9412 (0.1000) 0.5688 (0.1926) 0.7144 (0.1569) 1.0012 (0.9516) 8.1139* (0.0122) 0.6052 (0.2531) 0.3894 (0.2267)
Post-Arab Spring period
Jordan vs. GCC Jordan vs. Bahrain Jordan vs. Qatar Jordan vs. Oman
Jordan vs. Saudi Arabia
Jordan vs. UAE
Jordan vs. Kuwait H0: No volatility spillover from GCC countries to Jordan
11.7618** (0.0023) 5.9123*** (0.0001) 7.0215** (0.0068) 8.2543** (0.0062) 7.0126*** (0.0000) 10.2356* (0.0112) 8.2514*** (0.0000) Morocco vs. GCC Morocco vs. Bahrain Morocco vs. Qatar Morocco vs. Oman Morocco vs. Saudi Arabia Morocco vs. UAE Morocco vs. Kuwait H0: No volatility spillover from GCC countries to Morocco
7.0913*** (0.0001) 0.8713 (0.2530) 6.1857*** (0.0000) 1.1173 (0.7927) 8.9210*** (0.0006) 6.9215*** (0.0000) 7.1256** (0.0092) Notes: The table reports the Wald tests for testing the no volatility spillover restrictions imposed on Equation (1). The tests report no volatility spillover from GCC countries to Jordan and then to Morocco. The tests are distributed as Chi-square with 2 degrees of freedom. ***, ** and * represent significance at the 1%, 5%, and 10% levels, respectively.
[image:16.595.68.531.359.631.2]16
compared to 32% for Morocco vs. GCC, whereas 65% of them fall into high volatility regime for the first interdependency and 68% for the second one. So, we can say at this stage that the behaviors of the two countries are close. Under post-revolution period, the interconnection
between Jordan‟s and GCC stock markets is characterized by low volatility regime (58%),
while the interdependence between Moroccan and GCC markets seems distinguished during high volatility regime (90%). By pursuing country-by-country analysis, we notice that this result seems unambiguous, i.e., the low volatility remains dominant for Jordan, while state 2 (i.e., high volatility regime) appears predominant for Morocco. For instance, the linkage between Kuwait and Morocco is mainly driven by high volatility process (81%), while the dependence between Jordan and UAE seems more influenced by low volatility state (69%) (Figure A.3, Appendices).
The obtained findings clearly reveal a different integration patterns over the post-uprisings period compared to the previous period. As Jordan is already linked to GCC, it was able to effectively mitigate the detrimental impacts of crisis. Intuitively, the shift/ switch
between the studied states can be mainly associated to the so-called “loss of interdependence”
(Billio and Caporin 2005). This last phenomenon occurs when the interdependence across the markets investigated falls under crisis. Specifically, during a period of turbulence and short-run disturbance in a market, the other markets may be greatly threatened. However, if they succeed to filter the detrimental effects of shock out, the correlation with the turbulent area
obviously lessens. In that view and according to our results, this phenomenon of “loss of
interdependence” does not occur in the case of Jordan and Morocco as the interdependence
has instead increased after the crisis. But the probabilities‟ outcomes show a difference in
behavior between the two countries (predominantly high volatility for Morocco and low volatility for Jordan after Arab spring). Morocco may suffer more than Jordan from the volatility spillover running from GCC countries. As Jordan is already linked to GGC, it was able to effectively digest the detrimental impacts of crisis by filtering informations and
especially bad news, by contrast, the inclusion of Morocco in the “GCC club” seems more
17
Figure 2. Sub-period smoothed probability estimates
Jordan vs. GCC countries Morocco vs. GCC countries
Pre- Arab Spring
0.0 0.2 0.4 0.6 0.8 1.0
I II III IV I II III IV I II III IV 2008 2009 2010
P(S(t)= 1)
0.0 0.2 0.4 0.6 0.8 1.0
I II III IV I II III IV I II III IV 2008 2009 2010
P(S(t)= 2) Smoothed Regime Probabilities
0.0 0.2 0.4 0.6 0.8 1.0
I II III IV I II III IV I II III IV 2008 2009 2010
P(S(t)= 1)
0.0 0.2 0.4 0.6 0.8 1.0
I II III IV I II III IV I II III IV 2008 2009 2010
P(S(t)= 2) Smoothed Regime Probabilities
Post-Arab Spring period
0.0 0.2 0.4 0.6 0.8 1.0
I II III IV I II III IV I II III IV I II 2011 2012 2013 2014
P(S(t)= 1)
0.0 0.2 0.4 0.6 0.8 1.0
I II III IV I II III IV I II III IV I II 2011 2012 2013 2014
P(S(t)= 2)
Smoothed Regime Probabilities
0.0 0.2 0.4 0.6 0.8 1.0
I II III IV I II III IV I II III IV I II 2011 2012 2013 2014
P(S(t)= 1)
0.0 0.2 0.4 0.6 0.8 1.0
I II III IV I II III IV I II III IV I II 2011 2012 2013 2014
P(S(t)= 2)
18
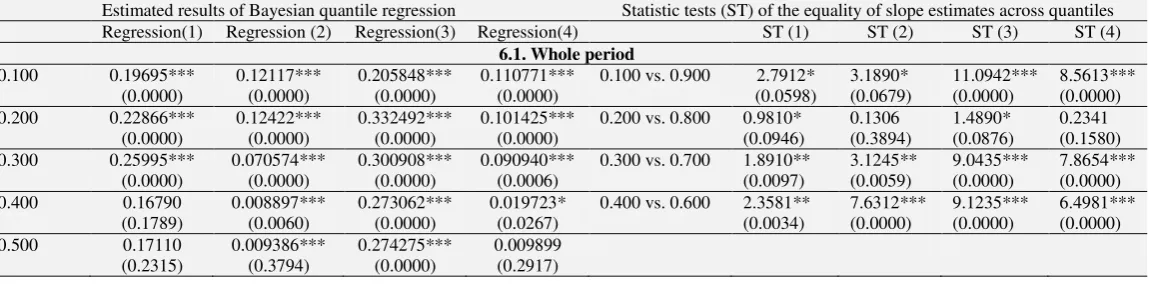
4.2. Bayesian quantile regression findings
The use of BQR in gauging the focal link may help us to effectively address whether Arab Spring may accelerate the stock market integration of Jordan vis-à-vis GCC and Morocco vis-à-vis GCC among different quantile levels. To this end, we regress the stock market returns of Jordan and then that of Morocco on GCC stock market returns. The regression analysis is applied, using both the traditional (unconditional) test procedure and the conditional approach.
4.2.1. Unconditional analysis
a. Baseline model
BQR results are reported in Table 6. Sharp differences across the first markets were found. We worthy notice that Jordan appears increasingly integrated to GCC stock markets among the distinct quantiles involved. Accurately, the stock market dependence between Jordan and GCC expands from 0.19 at quantile level 0.100 to 0.32 at level 0.900 (Regressions (1) and (2) in Panel 6.1 of Table 6). In addition, at the higher quantiles, the association between GCC stock returns and those of Jordan is found to be strong and statistically significant. We find that the slope parameters, estimated between the medians and the upper quantiles, consistently increase in magnitude confirming the evidence of asymmetry. This seems less obvious for Moroccan case. Specifically, the integration of Morocco vis-à-vis GCC seems more important at lower quantiles (0.100 and 0.200, in particular) than higher quantiles. Koenker and Xiao (2002) test is performed here to examine if the estimated quantile regression relationships are conform to the location shift hypothesis, which assumes
the same slope parameters for all of the conditional quantile functions14. The null hypothesis
of equal slope is rejected at the conventional significance levels, indicating that the slope coefficient of the GCC stock market returns differs at all the different parts of the return distribution in the case of Jordanian market return. The slope coefficient of the GCC stock market returns variable differs at 10th against 90th quantiles, 30th against 70th quantiles and 40th against 60th quantiles in the case of Moroccan market return (ST(1) and ST(2) in Panel 6.1 of Table 6). As with the results from above, these findings further indicate that the
Jordanian and Moroccan stock markets returns‟ response to GCC stock market returns is
state-dependent and conditional upon where the return is located on the distribution.
Here, we can already draw the first conclusions from these estimates. First the Jordanian stock market returns seems more close to GCC stock market returns that the Moroccan ones. The coefficients in the different quantiles are more important in Jordan than in Morocco, although in the latter case all coefficients are significant (but still low). For Morocco, unlike Jordan, as more the quantiles increase (i.e., the higher the yield), the more
the coefficients decrease. This indicates that the Jordan‟s stock market is likely to be more
connected to GCC markets than the Moroccan market. Not surprisingly, the Gulf investors
14
The Koenker and Xiao (2002) test computes that all the covariate effects satisfy the null hypothesis of equality
of the slope coefficients across quantiles. In particular, the difference between slope estimates at the and
(1- ) quantiles is examined. A rejection of the null hypothesis would suggest that the magnitude of the slope
19
better mastered the Jordanian market given the geographical proximity and the strong economic and political relationship between these countries (unlike Morocco). These first results confirm those found previously when we analyzed the interdependencies across the DCC-GARCH model and transition probabilities.
b. The issue of endogeneity
Endogeneity problem is often a concern in empirical testing. It may occur for example
when the dependent variable causes at least one of the covariates (“reverse causation”). To
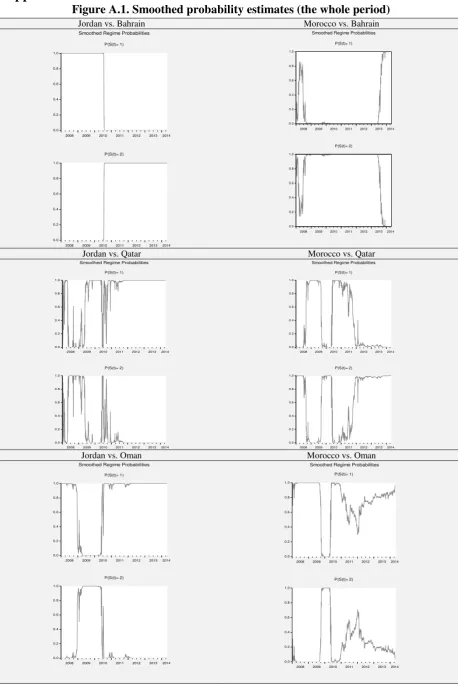
deal with this problem, the methods of instrumental variable (IV), generalized method of moments (GMM) and two-stage least squares (2SLS) and can be used. In this subsection, we re-explore the relationship between real stock returns of GCC and Jordan on the one hand and those of GCC and Morocco on the other hand, by using 2SLS method for at least two main reasons: First, GMM requires differentiability of the moment functions, while quantile regression consists on non-differentiable sample moments. Hence, combining these two methods seems inappropriate. Second, for instrumental quantile regression, it turns out very difficult to find proper instruments with regard to the focal issue. Indeed, to control for endogeneity, we attempt to employ a two-stage least squares (2SLS) to the different level of quantiles. In particular, in the first stage, we use all the exogenous and the lagged endogenous variables to calculate the estimated values of the GCC stock market returns variable. In the second stage, the estimated values from the first stage are used in place of the actual values of the GCC stock market returns variable. By comparing the BQR (Regressions (1) and (2) of Panel 6.1 in Table 6) and the BQR taking into account the endogeneity findings (Regressions (3) and (4) of Panel 6.1 in Table 6), we show that the results remain solid for most quantile levels involved. The stock market integration Jordan vs. GCC remains stronger (between 0.20 and 0.32) than Morocco vs. GCC (between 0.019 and 0.11). Koenker and Xiao (2002) test shows that the magnitude of the slope coefficient estimated, at the different parts of the return distribution, is different and that the difference is statistically significant strengthening our findings. Interestingly, we find a continuous increase in the stock market dependence of Jordan vis-à-vis Saudi Arabia (between 0.30 and 0.51) across the majority of quantiles levels, while a weaker dependence between the stock market return of Saudi Arabia and that of Morocco (from 0.07 to 0.18) was found among few quantiles (see Table A.1, Panel A.1.1 in Appendices). A deeper link between Qatar and Jordan was also shown among the majority of quantiles (between 0.14 and 0.34), whereas the interconnection between Qatar and Morocco
remains minor (between 0.03 and 0.13 (see Table A.2, Panel A.2.1 in Appendices)15. This
sustains the fact that Jordan, unlike Morocco, has a heavy historical relation with GCC countries and particularly Saudi Arabia. .
c. Results by sub-periods
In the pre-revolution period, the dependence between Jordan and GCC seems to some extent substantial at the different quantiles moving from 0.14 to 0.21. Nevertheless, Morocco appears much less integrated with GCC under distinct quantiles with correlation fluctuating between 0.006 and 0.014 (Regressions (1) and (2) of Panel 6.2 in Table 6). When we take into
15
20
account the endogeneity problem, the results are more significant and reinforce our findings (Regressions (3) and (4) of Panel 6.2 in Table 6). Concerning the results of Koenker and Xiao (2002) test, we found in the baseline model (i.e., BQR) that the slope coefficient of the GCC market return variable differs only at 10th against 90th quantiles for Jordan, and 30th against 70th quantilles and 40th against 60th quantiles for Morocco (ST(1) and ST(2) respectively, Panel 6.2, Table 6). Likewise, the interdependence between Saudi Arabia and Jordan appears much more important (fluctuates between 0.26 and 0.33) than that between Saudi Arabia and Morocco (does not exceed 0.11, see Table A.1, Panel A.1.2 in Appendices). Likewise, the stock market dependence with Qatar appears stronger for Jordan (between 0.11 at lowest quantile and 0.21 at highest quantile) than Morocco (between 0.02 and 0.11) at the different quantiles involved (see Table A.2, Panel A.2.2 in Appendices).
It is well shown from Table 6 (Panels 6.2 and 6.3) that there is a substantial change in the degree of stock market integration of Jordan vis-à-vis GCC and Morocco vis-à-vis GCC when moving from the pre-Arab Spring to the post-Arab Spring. Under pre-revolution period, a greater connection increasing sharply from one quantile to another is found for the
dependence Jordan-GCC, while a weaker relationship between the Morocco‟s stock market
and GCC is observed at lower quantiles (i.e., this dependence does not exceed 0.09). In the post-Arab Spring period, we notice a clearer change in the degree of integration. The dependence between Jordan and GCC seems between 0.33 and 0.62, and it expands intensely for Morocco vs. GCC, reaching 0.59. This reinforces the greater stock market integration of Jordan vs. GCC compared to Morocco vs. GCC under 2011 uprisings. These results remain unambiguous among the different methods used (BQR and BQR when controlling for
endogeneity). This confirms that “Arab Spring” has succeeded to deeply accelerate the
integration between Morocco and Arab Gulf countries. Differences across distinct quantiles depicted via statistic tests of the equality of slope estimates are significant at different levels. The previous steps show clearly that our results are robust. The study-by-study investigation confirms also the robustness of our results. We find a strong connection between Saudi Arabia and Jordan (between 0.45 and 0.55, see Table A.1., Panel A.1.3 in Appendices) and Qatar and Jordan (between 0.27 and 0.51, see Table A.2., Panel A.2.3 in Appendices) under revolution. For Morocco, we show that the interdependency increases potentially in the
[image:21.595.14.589.625.767.2]post-Arab Spring, reinforcing the occurrence of “forced” integration of Saudi Arabia vs. Morocco (exceeds 0.50) and Qatar vs. Morocco (almost equals to 0.50) mainly owing the fear of massive political instability among Arab countries.
Table 6. Bayesian quantile regression estimates
Estimated results of Bayesian quantile regression Statistic tests (ST) of the equality of slope estimates across quantiles Regression(1) Regression (2) Regression(3) Regression(4) ST (1) ST (2) ST (3) ST (4)
6.1. Whole period
0.100 0.19695*** (0.0000) 0.12117*** (0.0000) 0.205848*** (0.0000) 0.110771*** (0.0000)
0.100 vs. 0.900 2.7912* (0.0598) 3.1890* (0.0679) 11.0942*** (0.0000) 8.5613*** (0.0000) 0.200 0.22866***
(0.0000) 0.12422*** (0.0000) 0.332492*** (0.0000) 0.101425*** (0.0000)
0.200 vs. 0.800 0.9810* (0.0946) 0.1306 (0.3894) 1.4890* (0.0876) 0.2341 (0.1580) 0.300 0.25995***
(0.0000) 0.070574*** (0.0000) 0.300908*** (0.0000) 0.090940*** (0.0006)
0.300 vs. 0.700 1.8910** (0.0097) 3.1245** (0.0059) 9.0435*** (0.0000) 7.8654*** (0.0000) 0.400 0.16790
(0.1789) 0.008897*** (0.0060) 0.273062*** (0.0000) 0.019723* (0.0267)
0.400 vs. 0.600 2.3581** (0.0034) 7.6312*** (0.0000) 9.1235*** (0.0000) 6.4981*** (0.0000) 0.500 0.17110