Multi-Phase-Field Model to Simulate Microstructure Evolutions
during Dynamic Recrystallization
Tomohiro Takaki
1, Tomoyuki Hirouchi
2;*, Yousuke Hisakuni
2;*,
Akinori Yamanaka
3;*and Yoshihiro Tomita
21Graduate School of Science and Technology, Kyoto Institute of Technology, Kyoto 606-8585, Japan 2Graduate School of Engineering, Kobe University, Kobe 657-8501, Japan
3Graduate School of Science and Technology, Kobe University, Kobe 657-8501, Japan
A numerical model to simulate microstructure evolution and macroscopic mechanical behavior during hot working was developed. In this model, we employed a multi-phase-field model to simulate the growth of dynamically recrystallized grains with high accuracy and the Kocks-Meching model to calculate the evolution of dislocation density due to plastic deformation and dynamic recovery. Furthermore, an efficient computational algorithm was introduced to perform the multi-phase-field simulation efficiently. The accuracy of the developed model was confirmed by comparing the migration rate of grain boundaries with the theoretical value. Also, the numerical results for a polycrystalline material are compared with those obtained from a cellular automaton simulation. Furthermore, the effects of the initial grain size, grain boundary mobility and nucleation rate on the dynamic recrystallization behavior were investigated using the developed model.
[doi:10.2320/matertrans.MB200805]
(Received April 28, 2008; Accepted June 6, 2008; Published July 16, 2008)
Keywords: phase-field method, dynamic recrystallization, microstructure, mechanical behavior, numerical scheme
1. Introduction
During the hot working of metallic materials, hardening caused by the accumulation of dislocations and softening due to dynamic recovery (DRV) and dynamic recrystallization
(DRX) occur simultaneously.1)In particular, for metals with
low to medium stacking fault energy, DRX is marked and the characteristic stress–strain curves are observed to depend on
the temperature, strain rate and initial grain size.2,3)Single–
peak curves occur at a low temperature and high strain rate and multiple–peak curves occur at a high temperature and low strain rate. It is well–known that such characteristic mechanical behavior is strongly related to the microstructure evolution, or the nucleation and growth of DRX grains. Therefore, for the optimum design of the working process and the accurate prediction of material microstructures formed during hot working, it is essential to develop a numerical model that can be used to investigate the macro-scopic mechanical behavior resulting from the microstructure evolution. However, since the modeling of DRX requires a simulation that couples the mechanical behaviors and the microstructure evolution, the number of reported numerical studies on DRX is much fewer than that for static recrystallization (SRX) occurring during post–deformation
annealing.4–11)
The cellular automaton (CA) method12–18) and Monte
Carlo (MC) method19,20) have been employed to simulate
microstructure evolution during the DRX process. Because of its methodological flexibility, the CA method is used more
frequently than the MC method. Ding and Guo13)developed a
model that simulates the microstructural evolution and plastic flow behavior during DRX by coupling the evolution equation of dislocation density, or the Kocks-Meching (KM)
model,21)with the CA method.7)Althought the DRX model
is relatively simple and intuitive, it is possible to simulate
the macroscopic mechanical behavior based on the micro-structure. Therefore, the model is very useful as a multiscale method. However, it has been pointed out that the CA and MC methods lead to problems when modeling the absolute timescale and the curvature–driven growth of the grain
boundary.4)
In this study, we develop a phase-field (PF) model to simulate microstructure evolution during DRX. Since the PF model can simulate the grain boundary migration by curvature driving with a real timescale, the grain growth
is accurately reproduced.22–29) Here, the multi-phase-field
(MPF) model proposed by Steinbach and Pezzolla26) is
employed to represent polycrystalline material, because the
MPF model has merits compared with other MPF models27,28)
in that the phase field parameters can be perfectly related to the material parameters and the chemical driving force can be treated. Furthermore, the introduction of an algorithm
developed by Kimet al.29)enables efficient MPF
computa-tion during DRX. Here, we call the developed model the multi-phase-field dynamic recrystallization (MPF-DRX) model. Subsequently, by performing a single–grain growth simulation, the accuracy of the MPF-DRX model is con-firmed by comparison with theoretical results. Then, the results of polycrystalline grain growth are compared with those obtained by the CA method and we discuss the interrelationship between the microstructure and the me-chanical behavior. Finally, the effects of the grain boundary mobility and nucleation rate on the DRX performance are investigated.
2. DRX Model
We develop the MPF-DRX model in which the grain growth driven by stored energy is simulated by the MPF
method26)using an efficient computational algorithm29)and
the dislocation density evolution due to plastic deformation
and DRV is expressed by the KM model.21)A macroscopic
*Graduate Student, Kobe University
Special Issue on Advances in Computational Materials Science and Engineering V
stress–strain curve is obtained from the Bailey–Hirsch
relation30)using the average dislocation density.
2.1 Multi-phase-field model
Let us consider a polycrystalline system including N
grains. Theth grain is indicated by the phase field, where
takes a value of 1 inside theth grain, 0 inside the other
grains and 0< <1 at the grain boundary. The are
not independent and must satisfy
XN
¼1
¼1: ð1Þ
Here, we use the free energy functional
F¼ Z V XN ¼1 XN
¼þ1
a
2
2 r r
þW
þfe
dV; ð2Þ
whereais the gradient coefficient,Wis the height of the
energy barrier and feis the free energy density in the grains.
Here, the number of grains, N, in eqs. (1) and (2) can be
replaced withn¼PN¼1, where¼1when0< 1
and 0 otherwise.
The evolution equation of the phase field i is derived
as26)
_
i¼
Xn
j¼1
2Mij
n F i F j
; ð3Þ
where Mij is the phase field mobility. The functional
derivativeF=iis calculated as
F
i
¼X
n
k¼1
Wikkþ
a2 ik 2 r 2 k
þ@fe
@i
: ð4Þ
Here, by selecting the driving term as @fe=@i@fe=@j¼
8 ffiffiffiffiffiffiffiffiij p
Eij, whereEijis the difference in stored energy
between grains i and j and 8= is obtained from
R1 0
ffiffiffiffiffiffiffiffiffiffi
12
p
d¼R01pffiffiffiffiffiffiffiffiffiffiffiffiffiffiffiffiffið1Þd¼8, the evolution equation
of the phase fieldi reduces to
_
i¼
Xn
j¼1
2Mij
n
Xn
k¼1
ðWikWjkÞk
þ1
2ða
2
ika
2 jkÞr 2 k 8 ffiffiffiffiffiffiffiffi
ij
p
Eij
: ð5Þ
Since the coefficients in eq. (5), aij, Wij and M
ij, are
respectively related to the grain boundary thickness, grain
boundary energyijand grain boundary mobilityMijby
aij¼
2
ffiffiffiffiffiffiffiffiffi 2ij p
; Wij¼
4ij
; M
ij ¼
2
8Mij; ð6Þ where the diagonal components are zero, the grain growth process can be reproduced quantitatively. For simplicity, it is assumed that all grain boundaries are high–angle grain
boundaries with ij¼ and Mij¼M. Furthermore, the
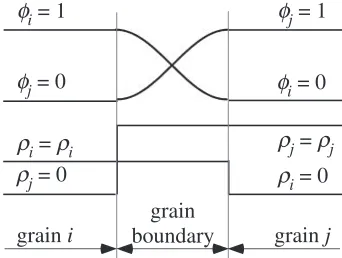
dislocation density is assumed to be constant in a grain. To
calculate the driving forceEij, we introduce an additional
variable i, defined in Fig. 1. Here, the variable i takes a
constant dislocation density when 0< i1 and is zero
when i¼0. The evolution of i follows the KM model
expressed in the next section and i is updated after
calculating phase fieldiby eq. (5).
From a numerical point of view, the MPF model has a
high computational cost, because usually N phase fields
must be saved and N evolution equations must be solved
at all grid points.27,28) However, Steinbach and Pezzolla’s
MPF model has some computational merits. We do not
have to solve eq. (5) at the grid points withn¼1and it is
sufficient to save notNbutnphase fields at a grid point. To
further improve the computational efficiency, we introduce
the algorithm proposed by Kim et al.29) and modify it to
achieve more accurate computation. The procedure is as follows:
(1) Solve eq. (5) fornphase fields.
(2) During (1), ifi at the previous time step is zero and
the calculated increment i has a negative value,
phase fieldiis removed from the phase field group that
must be solved at the grid point and we setnton1.
(3) Steps (1) and (2) are repeated until all phase fields satisfying the above condition are removed.
(4) Thenphase fields are rearranged in order of decreasing
size. Phase fields from the largest to nth largest are
recorded. Here,nis a predefined maximum number of
the recorded phase field.
(5) The phase fields are replaced by
i ¼i=P n j¼1j.
so as to satisfyPni¼1
i ¼1.
(6) If a phase field is not saved at grid pointðl;mÞand its
value at grid pointsðl1;m1Þ, or the nearest four
neighbors, is not zero, the phase field is added to the
phase field group at the grid pointðl;mÞ. Therefore, the
number of phase fields solved in step (1) sometimes
becomes more thann.
Steps (1) to (6) are repeated in each time step.
2.2 Dislocation evolution model
The accumulation of dislocations due to plastic
defor-mation and DRV is expressed by the KM model21) as a
relationship between dislocation density and true strain,
d
d"¼k1
ffiffiffi
p
k2: ð7Þ
Here, the first term of the right–hand side expresses the work
hardening, wherek1 is a constant that represents hardening.
The second term is the DRV term, wherek2is a function of
φ
i= 0
φ
i= 1
φ
j= 1
φ
j= 0
ρ
j=
ρ
jρ
i=
ρ
iρ
j= 0
ρ
i= 0
grain
i
grain
j
grain
boundary
[image:2.595.340.511.76.205.2]temperatureTand strain rate""_.13)The macroscopic stress is
related to the average dislocation densityas follows:
¼ bpffiffiffi; ð8Þ
where is a dislocation interaction coefficient of
approx-imately 0.5, is the shear modulus and bis the magnitude
of the Burgers vector. From eqs. (7) and (8), a macroscopic stress–strain curve can be determined.
2.3 Computational procedure
The computational procedure of the developed MPF-DRX model is as follows:
(1) The initial polycrystalline structure is created by a conventional grain growth simulation.
(2) The dislocation density at all grid points is set to the
initial valueini.
(3) The dislocation density and macroscopic stress–strain curve up to the DRX nucleation point are calculated
under a constant strain increment"¼""_tby eqs. (7)
and (8), wheretis the time increment.
(4) If the dislocation density on a grain boundary exceeds
the critical value c required to create a nucleus, a
circular nucleus with dislocation densityiniis placed
on the grain boundary with nucleation ratenn._
(5) The DRX grain growth is simulated by solving eq. (5). (6) The dislocation density variables at all grid points and the macroscopic stress are calculated by eqs. (7) and (8).
Steps (4) to (6) are repeated until a predefined strain value is reached.
3. Numerical Conditions
By performing numerical simulations using the MPF-DRX model, first, we confirm the accuracy of the developed model, second, we compare the results of the MPF-DRX simulation
with those of the CA simulation by Kugler and Turk16)and,
finally, we evaluate the effects of the grain boundary mobility and nucleation rate on the DRX process. A series of
simulations are performed for copper at temparature T¼
800K and strain rate""_¼0:002s1.
The material and numerical parameters used in the following simulations are as follows: For eqs. (5) and (6),
grid space x¼0:5mm, grain boundary energy ¼0:208
J/m2, grain boundary thickness¼7xand grain boundary
mobility M¼M0=TexpðQb=RTÞ, where M0¼0:139m4
K/Js, the activation energy Qb¼110KJ/mol and R is
the gas constant. For eqs. (7) and (8), k1 ¼4:00108/m
and k2¼ bk1=st, where ¼0:5, shear modulus ¼
42:1GPa, the magnitude of the Burgers vector b¼
2:561010m and the steady-state stress
st¼
fA1""_expðQa=RTÞg1=A2, whereA1¼2:01044,A2 ¼7:6and
activation energy Qa¼275KJ/mol. For DRX nucleation,
we set the critical stress c to 40 MPa, which corresponds
to the critical dislocation density c¼ ðc= bÞ2¼5:51
1013/m2, and we employ the nucleation rate per unit area of
the grain boundary expressed by nn_¼c""_dexpðQa=RTÞ,13)
wherec¼5:01025andd¼1. Here, one nucleus is created
every ðnn_tngbx2=Þ1 steps, where ngb is the number of
grid points located in the grain boundary or satisfying
0< i<1. The initial dislocation density is set to ini¼
109/m2, the time incrementt¼0:013s and the predefined
maximum number of the recorded phase fieldn¼5.
For comparison with the CA simulation, we mostly employed the parameters used in Ref. 16) as shown above. However, some points are different. The first difference is that we use a grain boundary energy that is one–third of the
value given in Ref. 16), 0.625 J/m2. If we use ¼0:625
J/m2, the nucleus diameter sufficiently overcomes the
curvature energy and becomes over 15mm, which is too
large. In Refs. 13) and 16), the cell size is set to 2mmand one
cell is used as one nucleus. Since the PF method can model the curvature effect accurately, such a small nucleus shrinks and disappears. Therefore, to reduce the nucleus diameter,
we set¼0:208J/m2. This is a fitting parameter determined
so as to include the effects of real nucleation mechanism. It has been reported that actual DRX nucleation occurs through processes such as grain boundary migration, grain boundary
serration, grain boundary sliding and twin nucleation31–34)
and, to simulate the nucleation process with high accuracy, homogeneous plastic deformation and DRX grain growth must be simulated simultaneously and further study is necessary. The second difference is the nucleation condition.
Since the critical dislocation density cand nucleation rate
_
n
n are not given explicitly in Ref. 16), we employed the
nucleation rate model proposed by Ding and Guo13)and the
coefficients c andd are determined so as to obtain almost
the same steady-state grain size Ds as that shown in Fig. 4
in Ref. 16). Final difference is the value of k1 in eq. (7).
We selected its value so that the stress–strain curve calculated from eqs. (7) and (8) can be fit to the curve shown in Fig. 4(a) of Ref. 16).
4. Numerical Results
4.1 Single–grain growth simulation
To confirm the validity of the developed MPF-DRX model, a single–grain growth simulation is performed and the variations in the migration rate of the grain boundary are compared to theoretical results. Here, we use a square
computational domain of 5050mm (100100 lattice)
with a zero Neumann boundary condition on all sides. A
circular nucleus of radius 2.74mmis placed at the grid point
ðl;mÞ ¼ ð1;1Þ. The initial dislocation densities in the nucleus
r and the deformed material m are set to r ¼ini and
r ¼c, respectively.
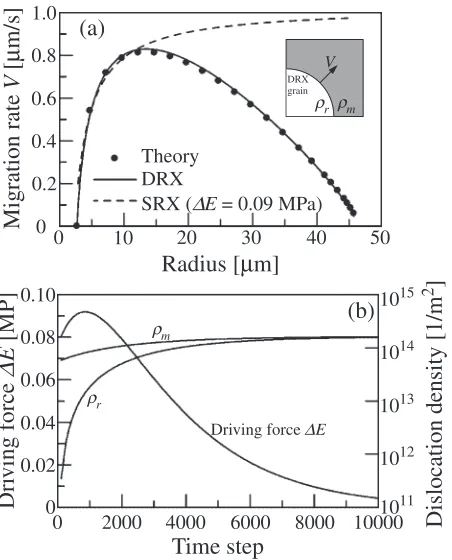
Figure 2(a) shows the variations in the grain boundary
migration rate V obtained from the PF simulation and the
theoretical equation, Vth¼MðE=rÞ, where r is the
radius of the DRX grain. From Fig. 2(a), the result of the PF simulation agrees well with the theoretical results and, therefore, it is verified that the developed PF model can simulate the DRX growth process accurately. For
compar-ison, the result of SRX with constant driving force E¼
0:09MPa is also shown in Fig. 2(a). In the case of SRX, since
the driving force is constant, the migration rate of the grain boundary increases monotonically with increasing SRX grain size. On the other hand, in the case of DRX, the
dislocation densities inside both the DRX grain r and the
of increase of dislocation density is greater in the DRX grain than in the deformed grain, as shown in Fig. 2(b). As a result, depending on the driving force balance between the stored energy and the curvature, the grain boundary migration rate exhibits the characteristic change shown in Fig. 2(a).
4.2 DRX microstructure evolution
Macroscopic stress–strain curves and the microstructural evolution during the DRX process for the polycrystalline material are simulated by the MPF–DRX model by changing
the initial grain sizeD0and are compared with those obtained
by the CA simulation reported by Kugler and Turk.16)Initial
polycrystalline structures with grain sizeD0¼20, 30, 80 and
250mm are prepared using conventional grain growth
simulations. The initial grain shape is set to be a regular
hexagon. Computational domain sizes of532:5527:0mm
(10651054 lattice), 513:5543:0mm (10271086
lattice),532:5527:0mm(10651054lattice) and476:5
412:5mm(953825lattice) are employed and the numbers
of initial grains are 896, 396, 56 and 4 forD0¼20, 30, 80
and 250mm, respectively.
Figures 3 and 4 show the macroscopic stress–strain curves and variations in average grain size, respectively. The dashed line in Fig. 3 is the stress–strain curve calculated by eqs. (7) and (8), i.e., without DRX. Figures 3(b) and 4(b) show the results shown in Fig. 4 in Ref. 16). Comparing Figs. 4(a) with 4(b), the strain at which the decrease in average grain
size starts and the steady–state grain sizeDsare observed to
be almost identical, because the critical stress c necessary
to create the DRX nucleus and the nucleation rate nn_ are
determined so that these values become equal. However, we
can see some differences in the rate of variation of average grain size during DRX. The differences between the present results and those obtained by the CA simulation can be observed more clearly in Fig. 3. Although similar changes in the stress–strain curve are observed in Figs. 3(a) and 3(b), we can see remarkable differences in the peak stress. Because, as shown in the previous section, our MPF model can simulate the DRX growth process accurately, it is thought that the differences originate from the time scaling method used in the CA model.
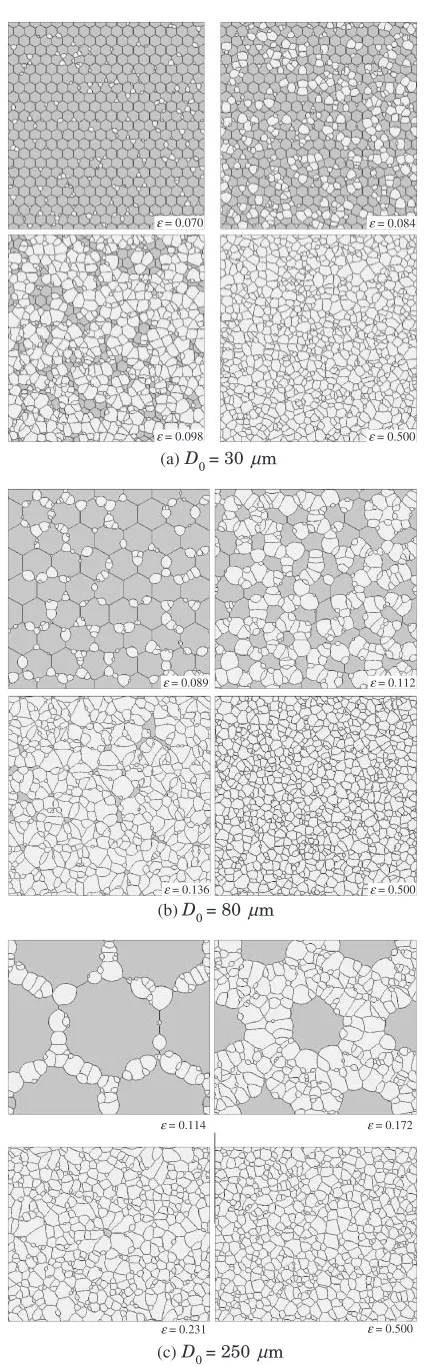
Next, we discuss the effects of the initial grain sizeD0on
the DRX process. Figure 5 shows the microstructural
evolution for D0¼30, 80 and 250mm. The gray grains
indicate the initial grains and the white grains are the DRX grains. The strain values in Fig. 5 correspond to the open
circles in Fig. 3(a). For D0 ¼30mm, perfectly random
nucleation and growth are observed and for D0¼250mm,
typical necklace structures are formed.1) However, the
steady–state microstructures at "¼0:500 exhibit an
equi-axed grain structure without initial grain size dependence. Although the nucleation rate per unit area of the grain boundary is constant, the grain boundary area increases with
decreasing initial grain sizeD0. As a result, the peak stresses
of the stress–strain curves shown in Fig. 3 decrease as D0
becomes small. Futhermore, for small D0, the stress–strain
curves have multiple peaks, while single–peak curves are
observed for large D0. It is known that the transition from
single to multiple peaks depends on whether or not the
0 2000 4000 6000 8000 10000
0.10
Time step
Dri
ving force
∆
E
[MP]
0.080.06
0.04
0 0.02
1011 1012 1013 1014 1015
Dislocation density [1/m
2
]
Driving force ∆E
ρm
ρr
(b)
0 10 20 30 40 50
1.0
Radius [
µ
m]
Migration rate
V
[
µ
m/s]
0.8
0.6
0.4
0 0.2
Theory DRX
SRX (∆E = 0.09 MPa)
(a)
V
ρm
ρr
DRX grain
Fig. 2 Variations in (a) migration rate of grain boundary and (b) driving force E and dislocation densities in DRX grain r and deformed
materialm.
D0 = 250 µm
D
0 = 80 µm
D0 = 30 µm
D
0 = 20 µm
Eqs. (7) and (8)
0.0
0.1
0.2
0.3
0.4
0.5
80
True strain
True Stress [MPa]
60
40
20
0
σc
D0 = 250 µm
D
0 = 80 µm
D0 = 30 µm
D
0 = 20 µm
Eqs. (7) and (8)
0.0
0.1
0.2
0.3
0.4
0.5
80
True strain
True Stress [MPa]
60
40
20
0
(a) Results of MPF-DRX simulation
(b) Results of CA simulation by Kugler and Turk16)
[image:4.595.59.285.73.353.2] [image:4.595.317.533.78.394.2]recrystallization cycles overlap.2) In Fig. 5, three
micro-structures from the first peak stress to the first valley stress and the steady–state microstructure are illustrated. In the case
of D0¼30mm, the DRX nuclei in secondary cycle are
created after the first DRX cycle is completed. On the other
hand, forD0¼80and 250mm, the secondary DRX cycle has
started already when "¼0:136 and 0.172, respectively,
while initial grains are still remain. These phenomena agree well with the experimental and numerical results reported so far.1,2,13,16,35) From these results and the discussion, it is confirmed that the proposed MPF–DRX model can simulate the macroscopic mechanical behavior based on the micro-structure evolution with high accuracy.
4.3 Effects of mobility and nucleation rate
Since the DRX model employed in this study assumes that the dislocation density inside a grain is constant, the nucleation criteria and the determination of some parameters,
such ask1,k2,A1,A2,c,dandM, are thought to be important.
Therefore, we discuss the effects of the grain boundary
mobilityMand nucleation ratenn_on DRX.
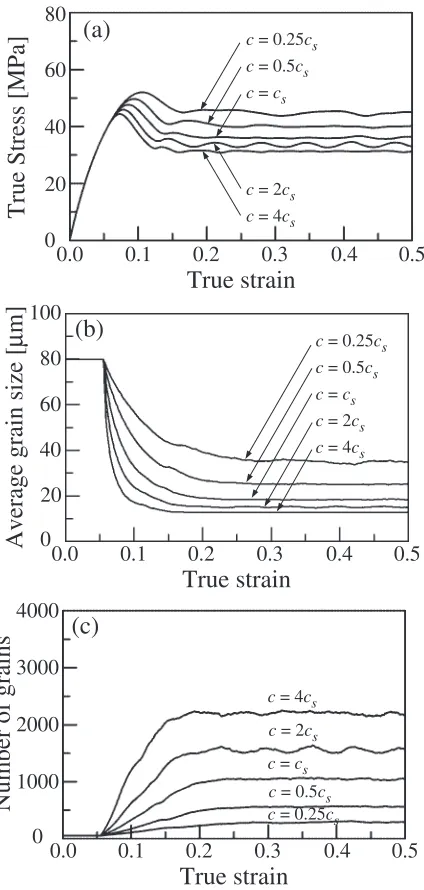
Figures 6 and 7 show (a) macroscopic stress–strain curves, (b) variations of the average grain size and (c) variations of
the number of grains calculated by changing M and c,
respectively. The values of grain boundary mobility M are
changed to 0.25Ms, 0.50Ms, 1.00Msand 2.00Ms, whereMsis
the grain boundary mobility used in sections 4.1 and 4.2.
From Fig. 6(a), the peak stress increases with decreasingM
0.0
0.1
0.2
0.3
0.4
0.5
100
200
0
D0 = 250 µm
D0 = 80 µm
D0 = 30 µm
D0 = 20 µm
True strain
Average grain size [
µ
m]
Ds = 18.5 µm
0.0
0.1
0.2
0.3
0.4
0.5
100
200
0
D0 = 250 µm
D0 = 80 µm
D0 = 30 µm
D0 = 20 µm
True strain
Average grain size [
µ
m]
Ds = 18.0 µm
(a) Results of MPF-DRX simulation
(b) Results of CA simulation by Kugler and Turk16)
Fig. 4 Variations in average grain size.
ε = 0.070 ε = 0.084
ε = 0.098 ε = 0.500 D0 = 30
(a) µm
ε = 0.089 ε = 0.112
ε = 0.136 ε = 0.500 D0 = 80
(b) µm
ε = 0.114 ε = 0.172
ε = 0.231 ε = 0.500
D0 = 250
(c) µm
[image:5.595.320.532.64.747.2]and multiple peaks can be observed forM¼2Ms. These are
similar characteristics to those in Fig. 3(a) or obtained when
changing the initial grain sizeD0. However, the steady–state
stresses are not the same value in Fig. 6(a). Also, the grain size does not converge to the same value, as shown in Fig. 6(b). The effect of the nucleation rate is evaluated by
changingcto 0.25cs, 0.50cs, 1.00cs, 2.00csand 4.00cs, where
csis the value used in section 4.2. As can be seen in Figs. 7(a)
and 7(b), the peak stress, steady–state stress and steady–state
grain size increase with decreasing cor nucleation rate nn._
Furthermore, the stress–strain relationships all have single– peak curve and never exhibit multiple peaks. As discussed here, by changing only the grain boundary mobility or the nucleation rate, we cannot simultaneously reproduce the transition from single to multiple peaks in the stress–strain curves and the constant steady-state grain size observed when changing the initial grain size. Therefore, it can be concluded that the balance between the grain growth rate and the
nucleation criteria of DRX is important in expressing actual DRX phenomena. Furthermore, from Figs. 6(c) and 7(b), we can see that many phase field variables are used during DRX simulations, particularly for a small grain boundary mobility and large nucleation rate, because one grain is expressed by one phase field. Therefore, it is confirmed that efficient computation can be achieved by introducing the algorithm used for the MPF method.
5. Conclusions
We have developed the MPF-DRX model to accurately simulate the microstructure evolution and macroscopic mechanical behavior during hot working. An efficient numerical simulation was achieved by introducing an efficient computational algorithm for the MPF method. The accuracy of the developed MPF method was confirmed by comparing the grain boundary migration rate of single–grain
0.0
0.1
0.2
0.3
0.4
0.5
80
True strain
True Stress [MPa]
60
40
20
0
M = Ms
M = 2Ms
M = 0.5Ms
M = 0.25Ms
(a)
0.0
0.1
0.2
0.3
0.4
0.5
100
True strain
Average grain size [
µ
m]
80
60
40
0
M = 2Ms M = Ms
M = 0.5Ms
M = 0.25Ms
20
(b)
0.0
0.1
0.2
0.3
0.4
0.5
4000
True strain
Number of grains
3000
2000
1000
0
M = 0.25Ms
M = 0.5Ms
M = Ms
M = 2Ms
(c)
Fig. 6 Effects of grain boundary mobility on (a) stress-strain curve, (b) average grain size and (c) number of grains.
0.0
0.1
0.2
0.3
0.4
0.5
4000
True strain
Number of grains
3000
2000
1000
0
c = 4cs
c = 2cs
c = cs
c = 0.5cs
c = 0.25cs
(c)
0.0
0.1
0.2
0.3
0.4
0.5
100
True strain
Average grain size [
µ
m]
80
60
40
0
20
c = 0.25cs
c = 0.5cs
c = cs c = 2cs c = 4cs
(b)
0.0
0.1
0.2
0.3
0.4
0.5
80
True strain
True Stress [MPa]
60
40
20
0
c = 0.25cs
c = 0.5cs
c = cs
c = 2cs c = 4cs
(a)
[image:6.595.62.280.68.524.2] [image:6.595.323.535.72.517.2]growth with that predicted from the theoretical equation. By performing DRX simulations under almost same conditions as that used in a previously reported CA simulation, we compared the results obtained by the MPF and CA methods. As a result, we observed a difference in the recrystallization kinetics. Furthermore, by investigating the effects of the initial grain size on DRX, it was confirmed that some phenomena observed in the experiment, such as the transition from single to multiple peaks in the macroscopic stress–strain curve and the independence of steady–state average grain size on the initial grain size, can be simulated. Also, the interrelationship between the microstructure evolution and the macroscopic mechanical behavior was discussed. Finally, the effects of the grain boundary mobility and DRX nucleation rate were evaluated by changing each parameter. It was concluded that the balance between the grain growth rate and the nucleation criteria of DRX is important in expressing actual DRX phenomena.
As a next step to the present study, the development of a method for determining some of the parameters is important, because the plastic deformation is expressed by the simple equation of dislocation density evolution. In a future study, we hope to develop a coupling model that enables the simultaneous evaluation of plastic deformation and DRX grain growth.
Acknowledgements
This research was partially supported by a Ministry of Education, Culture, Sports, Science and Technology Grant-in-Aid for Scientific Research and the Japan Aluminium Association. We also gratefully acknowledge helpful dis-cussions with Dr. Yoshihiro Suwa on the MPF method and the related computation.
REFERENCES
1) F. J. Humphreys and M. Hatherly: Recrystallization and Related Annealing Phenomena, (Elsevier, 2004) pp. 415–450.
2) T. Sakai and J. J. Jonas: Acta Metall.32(1984) 189–209. 3) W. Roberts and B. Ahlblom: Acta Metall.26(1978) 801–813.
4) M. A. Miodownik: J. Light Metals2(2002) 125–135.
5) D. J. Srolovitz, G. S. Grest and M. P. Anderson: Acta Metall.34(1986) 1833–1845.
6) B. Radhakrishnan, G. B. Sarma and T. Zacharia: Acta Mater.46(1998) 4415–4433.
7) H. W. Hesselbarth and I. R. Gobel: Acta Metall. Mater.39(1991) 2135–2143.
8) V. Marx, R. R. Reher and G. Gottstein: Acta Mater.47(1999) 1219– 1230.
9) D. Raabe and R. C. Becker: Model. Sim. Mater. Sci. Eng.8(2000) 445–462.
10) Y. Suwa, Y. Saito and H. Onodera: Mater. Sci. Eng. A457(2007) 132–138.
11) T. Takaki, A. Yamanaka, Y. Higa and Y. Tomita: Sci. Model. Sim. 14(2007) 75–84.
12) R. L. Goetz and V. Seetharaman: Scr. Mater.38(1998) 405–413. 13) R. Ding and Z. X. Guo: Acta Mater.49(2001) 3163–3175. 14) R. Ding and Z. X. Guo: Mater. Sci. Eng. A365(2004) 172–179. 15) M. Qian and Z. X. Guo: Mater. Sci. Eng. A365(2004) 180–185. 16) G. Kugler and R. Turk: Acta Mater.52(2004) 4659–4668. 17) R. L. Goetz: Scr. Mater.52(2005) 851–856.
18) N. Xiao, C. Zheng, D. Li and Y. Li: Comp. Mater. Sci.41(2008) 366–374.
19) A. D. Rollett, M. J. Luton and D. J. Srolovitz: Acta metall. Mater. 40(1992) 43–55.
20) P. Peczak: Acta Metall. Mater.43(1995) 1279–1291.
21) H. Mecking and U. F. Kocks: Acta Metall.29(1981) 1865–1875. 22) R. Kobayashi: Physica D63(1993) 410–423.
23) J. A. Warren and W. J. Boettingera: Acta Metall. Mater.43(1995) 689–703.
24) A. Yamanaka, T. Takaki and Y. Tomita: Mate. Trans. 47 (2006) 2725–2731.
25) T. Takaki, T. Fukuoka and Y. Tomita: J. Crystal Growth283(2005) 263–278.
26) I. Steinbach and F. Pezzolla: Physica D134(1999) 385–393. 27) L.-Q. Chen and W. Yang: Phys. Rev. B50(1994) 15752–15756. 28) D. Fan and L.-Q. Chen: Acta Mater.45(1997) 611–622.
29) S. G. Kim, D. I. Kim, W. T. Kim and Y. B. Park: Phys. Rev. E 74(2006) 061605.
30) J. E. Bailey and P. B. Hirsch: Philos. Mag.5(1960) 485–497. 31) A. M. Wusatowska-Sarnek, H. Miura and T. Sakai: Mater. Sci. Eng. A
323(2002) 177–186.
32) H. Miura, T. Sakai, R. Mogawa and G. Gottstein: Scr. Mater.51(2004) 671–675.
33) H. Miura, T. Sakai, S. Andiarwanto and J. J. Jonas: Philos. Mag.85 (2005) 2653–2669.
34) H. Miura, T. Sakai, R. Mogawa and J. J. Jonas: Philos. Mag.87(2007) 4197–4209.