VI International Conference on Computational Methods for Coupled Problems in Science and Engineering COUPLED PROBLEMS 2015 B. Schrefler, E. Oñate and M. Papadrakakis (Eds)
AN ELECTRO-CHEMO-MECHANICAL ANALYSIS OF
SOLID OXIDE FUEL CELL
CONSIDERING EVOLUTION OF MICROSTRUCTURE
IN POROUS ELECTRODE USING PHASE-FIELD METHOD
M. MURAMATSU *, S. TAKASE **, K. YASHIRO *, T. KAWADA * AND K. TERADA ***
* Graduate School of Environmental Studies
Tohoku University
468-1-404, Aoba, Aramaki, Aoba-ku, Sendai 980-0845 Japan e-mail: [email protected]
** Department of Civil and Environmental Engineering
Tohoku University
468-1-404, Aoba, Aramaki, Aoba-ku, Sendai 980-0845 Japan email: [email protected]
*** International Research Institute of Disaster Science
Tohoku University
468-1-404, Aoba, Aramaki, Aoba-ku, Sendai 980-0845 Japan email: [email protected]
Key words:Solid Oxide Fuel Cells, Potential Simulation, Stress Analysis, Microstructure. Abstract. For the numerical simulation of oxygen potential distributions in Solid Oxide Fuel Cell (SOFC), the time-evolution of the anode microstructure is reflected in the macroscopic electrical conductivities and the amount of triple-phase boundaries. Once the oxygen potential distributions are determined, the time-variation of the reduction-induced strains due to nonstoichiometry of oxide materials is calculated along with the thermal strains. These strains cause the macroscopic stresses in mutually constrained components. Thus, the capability of the proposed method is demonstrated in characterizing the aging degradation of the macroscopic electro-chemo-mechanical behavior of SOFC that is caused by the Ni-sintering in cermet microstructures during long-period control.
1 INTRODUCTION
Components of Solid Oxide Fuel Cells (SOFCs) are always exposed to high temperature and large gas pressure under operation. Subjected to the starting and stopping control, the performance of SOFC is gradually degraded. One of the degradation factors can be the thermal expansive deformation due to temperature change [1], but the expansive deformation under reduction environment is distinguishing [1] for SOFC. These stress-free deformations
inevitably invoke the unexpectedly large stress due to the mutual constraints of the components, which sometimes causes the mechanical deterioration. At the same time, Ni particles in the porous anode electrode of SOFC are subjected to coursing due to sintering under high temperature environment. The temporal changes of the anode microstructures cause the degradation of not only the overall mechanical properties, but also the electrical performance.
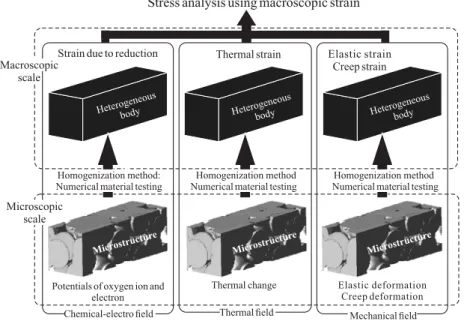
In order to realize the macroscopic electro-chemo-mechanical coupling analyses of a SOFC under operation, we propose a characterization method of the time-varying overall or macroscopic electro-chemical and mechanical properties of anode electrodes by applying the phase-field method that enables us to capture the time-varying geometry of anode microstructures due to Ni-sintering. With this information at hand, the homogenization method is extensively applied to evaluate the temporal change of the macroscopic electro-chemo-mechanical properties that characterize the macroscopic inelastic mechanical behaviour and the oxygen potential distribution in SOFC.
For the numerical simulation of oxygen potential distributions, the time-evolution of the anode microstructure is reflected not only in the macroscopic electrical conductivities, but also the amount of triple-phase boundaries, which are the generation sites of electro-chemical reaction currents. Once the oxygen potential distributions are determined, the time-variation of the reduction-induced strains due to nonstoichiometry of oxide materials can be calculated along with the thermal strains, both of which cause the macroscopic stresses in mutually constrained components. Thus, the promise and capability of the proposed method can be demonstrated in characterizing the aging degradation of the macroscopic electro-chemo-mechanical behaviour of SOFC that is caused by the Ni-sintering in cermet microstructures during long-period control.
Figure 1: Framework of analysis
Strain due to reduction Elastic strain Creep strain
Stress analysis using macroscopic strain
Heterogeneousbody
Microstructur e
Homogenization method: Numerical material testing
Homogenization method
Microscopic scale
Elastic deformation Creep deformation Potentials of oxygen ion and
electron Mechanical eldfi Chemical-electro eldfi Macroscopic scale Heterogeneous body Microstructur e
Numerical material testing
Microstructur e Thermal strain Thermal eldfi Heterogeneous body Thermal change Homogenization method Numerical material testing
2 FORMULATION
2.1 Electro-chemical phenomenon
At the cathode electrode, oxygen O2 is reduced by electron e- to produce oxygen ion O2-,
which can move through the electrolyte toward the anode electrode. The oxygen ion that reaches the anode electrode is oxidized by the reaction with H2, which is provided as a fuel, to
produce water H2O and e-. 2 2 1 Cathode : O 2e O 2 (1) 2- -2 2 Anode :O H H O 2e (2)
Since the electrodes are porous materials, actual reactions are expected to occur at the interfaces between gas and solid phases. The latter electro-chemical reaction, i.e., oxidation with emission of electrons, occurs at the so-called triple phase boundaries (TPBs) of the anode electrode, which is generally a cermet composed of Ni particles and ion conductive ceramics. On the other hand, the cathode electrode, whose constituents are mixed ionic-electronic conductive ceramics, allows the reduction of O2 at the so-called dual phase boundaries
(DPBs), involving the ionization of the oxygen with absorption of electrons.
The electronic current density ieAnode- generated with the oxidation (2) is known to be determined by the Butler-Volmer relationship [3,4] as
-Anode Anode
0 a c
e [exp{(2 ) / ( ) } exp{(2 ) / ( ) }]
i i F R E F R E (3)
where F 96500Cmol1 is the Faraday’s constant, R is the gas constant, is the
temperature and Anode 0
i is the exchange current density, a and c are the anodic and cathodic charge transfer coefficients. In addition, E is the polarization voltage expressed by
gas O O
( ) / 2
E F
(4)
where O and gas O
are the oxygen potentials in material and gas, respectively. The oxygen potential is calculated with the partial pressure of oxygen pO2 as
2 O O 12R ln(pO )
(5)
where O 0 is the oxygen potential at standard condition. The normal component of current
density ie- inside the Ni particles equals to the generated electric current density as
- - Anode
-e e e
i i n i (6)
where n is the outward unit vector on the TPB, directed to the normal to Ni surface. According to the electro-chemical reaction Eq. (2), the oxygen ionic current density generated at the same boundary surfaces can be evaluated as
2 2 Anode2- Anode
-O O O e
i i n i i (7)
where the outward unit vector n is defined to the TPB, directed to the normal to the oxide’s surface.
The current density generated at the cathode with the reduction process expressed by Eq. (1) is also determined by the Butler-Volmer type equation as
-Cathode Cathode 0
e [exp{(2(1 ) ) / ( ) } exp{(2 ) / ( ) }]
i i F R E F R E (8)
where the exchange current density Cathode 0
i and the charge transfer coefficient are different from those for anode.. The relationships of this generated current density with the normal components of the current densities in the oxide are given as
- - Cathode -e e e i i n i (9) 2 2 Cathode2- Cathode -O O O e i i n i i (10)
2.2 Microscopic electronic and oxygen-ionic conduction problems
The electrical conduction in mixed ionic-electronic conductive ceramics can be characterized by the local transport of electro-chemical potentials and is governed by the following equations [5]: 2-2 2 O 2-O O , O O 2 2 c F F i i (11) -e O e e e ( ) , ( 2 ) 2 2 c F F i i (12) 2- - 2 -O O 2 ,e O e i i i (13)
where O2- is the electro-chemical potential of oxygen ion, e- is the electro-chemical
potential of electron, c c ( ) ( 4O F V2 / m)( ( ) / O O) is the electric capacitance, is the oxygen vacancy, is the molal volume, i is the total current density, and sO2- and se- are
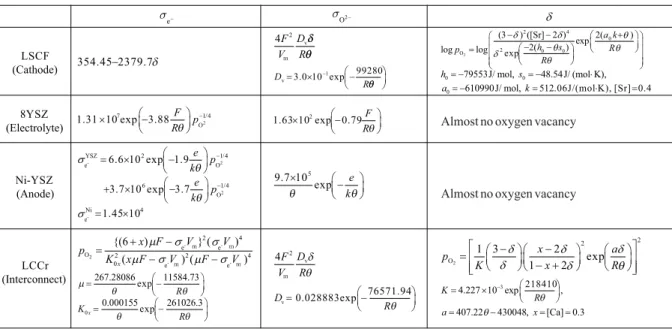
Table 1: Electric conductivities and oxygen vacancy
LSCF ( athode)C 8YSZ ( lectrolyte)E Ni-YSZ ( node)A LCCr ( nterconnect)I e O2 m m m m m m v v v v
Almost no oxygen vacancy
the electric conductivities of oxygen ion and electron, respectively. It is noted that the source terms of reaction current densities are not appeared in Eqs. (11) and (12). The reaction currents are generated at the TPBs or DPBs. The standard Dirichlet boundary conditions with the values of electro-chemical potentials are used for the pore surface in the microscopic problem.
2.3 Macroscopic electronic and oxygen-ionic conduction problems
The local transport of macroscopic electro-chemical potentials is governed by the following equations: 2-2 2 2 O 2-O O O , O O 2 2 c j F F i i (14) -e O e e e e ( ) , ( 2 ) 2 2 c j F F i i (15) 2- - 2 -O O 2 ,e O e i i i (16)
where symbol indicates the macroscopic (homogenized) quantity. The reaction current densities jO2 and je are appeared as source terms in Eqs. (14) and (15). Once the solutions
of these equations O2- and e- are determined, the macroscopic oxygen potential O can be
obtained.
2.4 Macroscopic deformation problem
The macroscopic (homogenized) governing equations of deformation problem are written in the following forms:
0 T b (17) e c r ε ε ε ε ε q (18) e e e dev : (tr ) 2 T C ε ε 1 ε (19) 2 c m/ || m||, C1|| || exp(C C3/ ) ε T T T (20) εq α (21) r ε β (22)
where symbol indicates the macroscopic (homogenized) quantity. The macroscopic reduction-induced strain r is evaluated by the multiplication of the macroscopic vacancy
from Table 1 by the coefficient. The standard Dirichlet and Neumann boundary conditions are used.
2.5 Microstructures of anode
In this study, we assume that the main factor that deteriorates the anode made by Ni-YSZ is the sintering of Ni particles, which aggregate during the steady operation at 973-1173K. In particles touching with each other at lower temperature than the melting point, material transfer occurs so as to reduce the surface energy of the system. With the driving force of the
surface energy, the shapes of particles change with time. To simulate such a time-variation, a phase-field model for sintering [6,7] is employed in this study. We employ the following Ginzburg-Landau type free energy [8]:
2 i i i 1 [ || || 2 F
V ij 2 2 2 2 2 2 2 2 i i i i i i j i j k i i i j (1 ) ( ) ] 4 2 i A B dv
(23)where index i takes 1, 2 or 3, which indicates the phase of Ni, YSZ and void. Here, the first and second terms are the surface energies, the third term is the chemical free energy, and the fourth term is the interface energy of the TPB. Also, coefficientsi, Ai, Bi, ijji and are the material constants associated with the corresponding energies or potentials. The Cahn-Hilliard equations are used for the evolution equation because i is a conservative quantity.
i i i i ( , ) F M t (24)
where Mi i( , ) is the mobility defined as Mi i( , ) D( ) ( )i mi with the diffusivity function D( )i and the mobility function mi( ) , i.e., D( )i D fvol ( )i Dvap(1 f( ))i
surf i(1 i)
D
and 8
i( ) 10 / 2[1 tanh{( i) / }]i
m b where Dvol, Dvap and Dsurf are the diffusivities for the volumetric diffusion, the gas diffusion and the surface diffusion, respectively, and ai and bi are the mobility parameters and f( )i takes the form of f( )i
3 2
i (10 15 i 6 )i
. Substitution of Mi i( , ) into Eq. (24) yields the following equation: 2 i i i i i i i i ( ) ( ( )) F ( ) F m D D t (25)
Discretizing Eq. (25) with finite differential method, we simulate the development of order parameters.
3 ANALYSIS CONDITION 3.1 Material constants
We employ La0.6Sr0.4Co0.2Fe0.8O3- (LSCF) for the cathode, 8mol% yttria-stabilized
zirconia (8YSZ) for the electrolyte, Ni-YSZ cermet for the anode La(Ca)CrO3 (LCCr) for the
interconnect in this study. Note that the formulation does not limit the materials of cells. To evaluate the macroscopic material properties of the porous anode and cathode electrodes by performing the homogenization analyses, homogenization method are used to obtain the macroscopic material properties. In this study, numerical material testing [2] is employed for homogenization. Especially, the microstructure of anode, which is Ni-YSZ cermet, changes temporally due to Ni-sintering. The macroscopic properties of anode are calculated on the basis of the temporal microstructures.
3.2 Temporal change of microstructure in anode
Figure 2 shows the microscopic analysis models of anode (Ni-YSZ) and cathode (LSCF) microstructures, which are generated by the 3-dimensional porous material simulator POCO [9]. A phase-field simulation with the above-described evolution equations is carried out only for the Ni particles in Fig. 2 (a) that are assumed to be exclusively sintered. The finite difference model is generated with 5050 146 grids (Δx×Δy×Δz = 0.062m × 0.062m × 0.062m). The material constants are chosen as 1 = 2 = 14.0×10⁻² J/cm3, A1 = A2 = 22.0×10 -3 J/cm3, B
1 = B2 = 1.0 J/cm3, 12 = 5.0×10⁻³ J/cm3, 13 = 23 = 0.0 J/cm3, = 100.0×10⁻³J/cm3,
Dvol = 5.0×10⁻¹³ cm2/s , Dvap = 5.0×10⁻¹⁵ cm2/s and Dsurf = 2.0×10⁻¹⁰ cm2/s. It is noted here that
the diffusivity of the interface is set at a value larger than the ones for the solid and gas phases to promote the sintering near the interfaces. Figure 3 is the schematic of the condition of temperature control in a virtual SOFC operation. After the temperature increases to 1073K, this constant value of temperature is kept for 11 hours, and then decreases to the room temperature by natural cooling. Under this temperature control, the sintering simulation is assumed to start when the temperature reaches at 1073K, since Ni particles are sintered mainly in steady operations [1]. Here, the simulation time is 11h with Δt = 1s. The results of the sintering simulation of Ni particles are provided in Fig. 4 that shows the time-variation of the anode microstructure with the TPBs, which are generation sites of reaction currents. The
Figure 4: Temporal changes of microstructure
(i) = 0st
(ii) = 21600st
(iii) = 39600st
(a) Microstructure (b) Distribution of TPBs
(a) Temperature (b) Hydrogen gas 0 3600 39600 43200 46800 298 673 1073 Time [s] ( )i T emperature [K] ( )ii ( )iii ( )iv ( )v 0 3600 39600 43200 46800 0.0 1.0 Time [s]
Partial pressure of hydrogen [atm]
( )i
( )ii ( )iii
( )iv ( )v
amount of the TPBs shows that the frequency of TPBs is reduced with time during the sintering of Ni particles.
3.3 Homogenization
Based on the geometrical and material information about anode, which is shown in section 3.1, and cathode, numerical material tests are conducted to evaluate the macroscopic properties such as oxygen ionic and electronic conductivities, elastic constants, creep parameters and coefficient of thermal expansion. The obtained properties are used for the macroscopic analysis.
4 ANALYSIS RESULT
4.1 Electric conduction problem
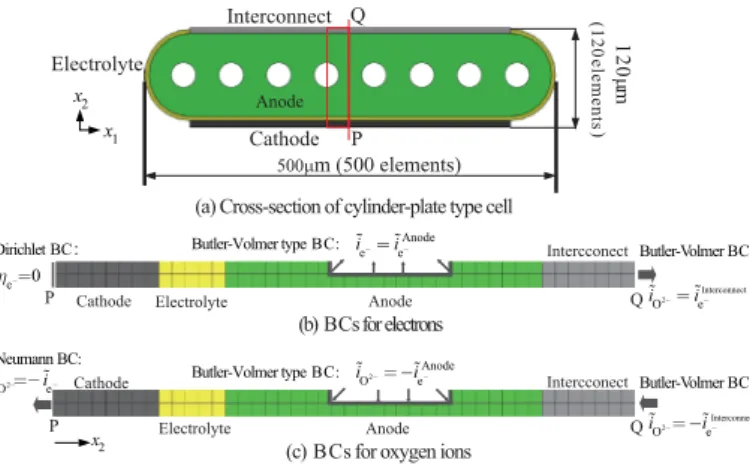
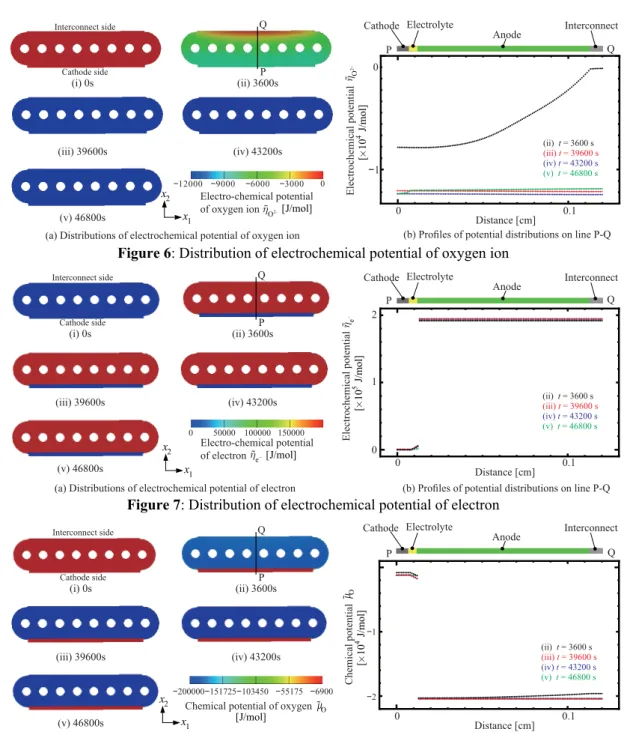
Figure 5 is the analysis model and boundary conditions for macroscopic electric conduction problem. Figures 6, 7 and 8 show the time variations of the distributions of the potentials of oxygen ion, electron and oxygen, respectively. The contour plot on the left of each of these figures (Figures 6(a), 7(a) and 8(a)) shows their time varying distributions in the
x1-x2 plane, while the graph on the right of each figure (Figures 6(b), 7(b) and 8(b)) shows
their time-varying profiles on line P-Q indicated in Fig. 5. An increase of the uniform distributions of the electrochemical potential of electrons, which can be observed in Figs. (i) and (ii), reflects the supplying condition of fuel in the anode in the numerical analysis. After 3,600s, the potential is kept constant as can be seen from Figs. (ii) and (iii), realizing the steady states.
4.2 Deformation problem
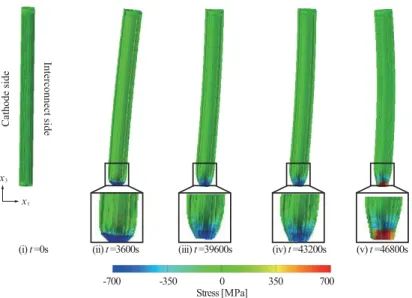
The analytic model and boundary conditions for macroscopic analysis for the macroscopic deformation problem are shown in Fig. 9. As can be seen from Fig. 10, at first, the overall cell structure is bent toward the interconnect side This initial bending until the temperature reaches at 1073K has been caused by the significant development of larger thermal expansion strains in the cathode than those in the interconnect. Subsequently, the deflection is gradually decreased and the head of the cell moves toward the cathode side during 10h-steady operation
Cathode m (500 elements) Anode Interconnect Cathode Anode 1 2 0 m (1 2 0 e le m e n ts ) Electrolyte Electrolyte Intercconect Cathode Anode Electrolyte Dirichlet BC: (b) BCs for electrons
(c) BCs for oxygen ions
i e i e Anode i O2 i e Anode i O2 i e Butler-Volmer BC: i O2i e Interconnect x 1 x 2 x 2 i O2 i e e0 Butler-Volmer type BC: Q P Q P Q P Butler-Volmer type BC:
(a) Cross-section of cylinder-plate type cell
Butler-Volmer BC: Neumann BC:
Interconnect Intercconect
and cooling, while the overall shape of the cell is warped into the interconnect side (See Figs. 10(ii)-(v)). This is probably caused by the reduction induced expansive strains that are expected to developed in the interconnect side during steady operation and subsequent cooling. −12000 −9000 −6000 −3000 0 0 −1 (v)t= 46800 s (iii) = 39600 st (iv) = 43200 st (ii)t= 3600 s Cathode Electrolyte Anode Interconnect (i) 0s (iii) 39600s (ii) 3600s (iv) 43200s (v) 46800s
(a) Distributions of electrochemical potential of oxygen ion Cathode side
Interconnect side
P Q
Electro-chemical potential
of oxygen ion O2 [J/mol]
x 1 x
2
(b) Pro les of potential distributions on line P-Qfi
0 0.1 Distance [cm] O 2 Electrochemical potential [ 10 4J/ m ol ] P Q 0 50000 100000 150000 (i) 0s (iii) 39600s (ii) 3600s (iv) 43200s (v) 46800s 2 1 0 (v)t= 46800 s (iii) = 39600 st (iv) = 43200 st (ii)t= 3600 s
(a) Distributions of electrochemical potential of electron
Cathode Electrolyte Anode Interconnect Cathode side Interconnect side x 1 x 2
(b) Pro les of potential distributions on line P-Qfi
P Q Electrochemical potential e [ 10 5J/ m ol ] Electro-chemical potential of electron e [J/mol] 0 0.1 Distance [cm] P Q −200000 151725 103450− − −55175 −6900 −1 Cathode Electrolyte Anode Interconnect (v)t= 46800 s (iii) = 39600 st (iv) = 43200 st (ii)t= 3600 s −2 (i) 0s (iii) 39600s (ii) 3600s (iv) 43200s (v) 46800s
(a) Distributions of chemical potential of oxygen Cathode side
Interconnect side
P Q
Chemical potential of oxygen [J/mol] x
1 x
2
(b) Pro les of potential distributions on line P-Qfi
0 0.1 Distance [cm] μO Chemical potential [ 10 4J/ m ol ] μO P Q
Figure 8: Distribution of chemical potential of oxygen
Figure 7: Distribution of electrochemical potential of electron
5 CONCLUSIONS
In this study, to perform stress analyses of SOFCs under operation, mechanical problem and electrochemical problem are coupled taking a time-varying geometries of anode microstructures due to Ni-sintering into account. The conclusions are summarized as follows:
- A phase-field method was presented to simulate the micro-scale morphology change with time, from which the time-variation of the amount of TPBs was directly
predicted. In the homogenization analyses, the dependencies of the properties of constituent materials on temperature and/or the oxygen potential, which is supposed to change within an operation period, were also considered.
(i) =0st Stress [MPa] Interconnect side Cathode side (iii) =39600st (ii) =3600st (iv) =43200st (v) =46800st -700 -350 0 350 700 x1 x3
Figure 10: Distribution of stress of the cell Fuel Anode Electrolyte Cathode Interconnect Air 5000 m (5000elements) x 3 x 1 x 2 x 3 x 1 Pedestal x 3 x 2 1200 m (1200elements) 12000 m (240elements) A B C D
- Under the assumption of an actual start-and-stop operation, the macroscopic electric conduction analysis was conducted to oxygen potential distribution in an overall cell structure under long-period operation with start-and-stop control, which determined reduction-induced expansive/contractive deformation of oxide materials.
- The macroscopic stress analysis was carried out for the overall SOFC structure with the stress-free strains and the homogenized mechanical properties, both of which depend on the operational environment.
ACKNOWLEDGEMENT
This work was carried out as a part of the research project” Technology development for SOFC commercialization promotion, Basic study on rapid evaluation method of SOFC durability”, which was supported by the New Energy and Industrial Technology Development Organization (NEDO), Japan.
REFERENCES
Equation Section (Next)
[1] Huang, K. and Goodenough, J.B. Solid oxide fuel cell technology: principles,
performance and operations. Woodhead Publishing, (2009).
[2] Terada, K., Hirayama, N., Yamamoto, K., Kato, J., Kyoya, T., Matsubara, S., Arakawa, Y., Ueno, Y. and Miyanaga, N. Applicability of micro-macro decoupling scheme to two-scale analysis of fiber-reinforced plastics. Adv. Compos. Mater. (2014) 5-6: 421-450. [3] Haile, S.M. Fuel cell materials and components. Acta. Mater. (2003) 51:5981-6000. [4] Chan, S.H., Khor, K.A. and Xia, Z.T. A complete polarization model of a solid oxide fuel
cell and its sensitivity to the change of cell component thickness. J. Power. Sources.
(2001) 93:130-140.
[5] Terada, K., Kawada, T., Sato, K., Iguchi, F., Yashiro, K., Amezawa, K., Kubo, M., Yugami, H., Hashida, T., Mizusaki, J., Watanabe, H., Sasagawa, T. and Aoyagi, H. Multiscale Simulation of Electro-Chemo-Mechanical Coupling Behavior of PEN Structure under SOFC Operation. ECS Trans. (2011) 35: 923-933.
[6] Jiao, Z. and Shikazono, N. Simulation of solid oxide fuel cell anode microstructure evolution using phase field method. J. Electrochem. Soc. (2013) 160: F709-F715.
[7] Asp, K. and Agren, J. Phase-field simulation of sintering and related phenomena - A vacancy diffusion approach. Acta. Mater. (2006) 54: 1241-1248.
[8] Sasagawa, T., Takahashi, K., Terada, K. and Kawada, T. Estimation of macroscopic material properties using sintering simulation of porous microstructure affected by mechanical effects. Trans. JSCES (2012) No. 2012004.
[9] Koyama, M., Ogiya, K., Hattori, T. Fukunaga, H., Suzuki, A., Sahnoun, R., Tsuboi, H., Hatakeyama, N., Endou, A., Takaba, H., Kubo, Del Carpio, C.A. and Miyamoto, A. Development of three-dimensional porous structure simulator POCO2 for simulations of irregular porous materials. J. Comput. Chem. Jpn. (2008) 7: 55-62.
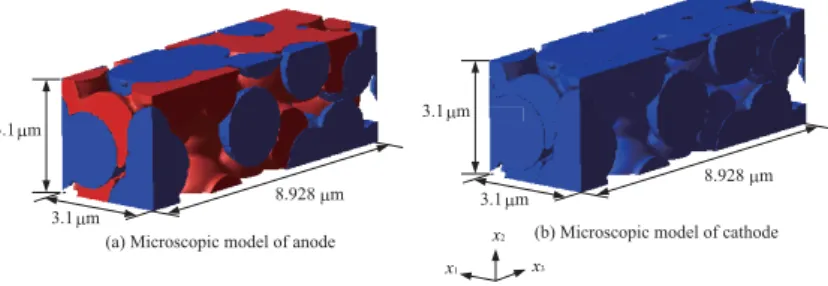
![Figure 2 shows the microscopic analysis models of anode (Ni-YSZ) and cathode (LSCF) microstructures, which are generated by the 3-dimensional porous material simulator POCO [9]](https://thumb-us.123doks.com/thumbv2/123dok_us/9068617.2397167/7.892.135.750.153.461/figure-microscopic-analysis-microstructures-generated-dimensional-material-simulator.webp)