253
VizSeq: A Visual Analysis Toolkit for Text Generation Tasks
Changhan Wang†, Anirudh Jain*‡, Danlu Chen†and Jiatao Gu† †Facebook AI Research,‡Stanford University
{changhan, danluchen, jgu}@fb.com, [email protected]
Abstract
Automatic evaluation of text generation tasks (e.g. machine translation, text summariza-tion, image captioning and video description) usually relies heavily on task-specific metrics, such as BLEU (Papineni et al., 2002) and ROUGE (Lin,2004). They, however, are ab-stract numbers and are not perfectly aligned with human assessment. This suggests in-specting detailed examples as a complement to identify system error patterns. In this paper, we present VizSeq, a visual analysis toolkit for instance-level and corpus-level system eval-uation on a wide variety of text generation tasks. It supports multimodal sources and mul-tiple text references, providing visualization in Jupyter notebook or a web app interface. It can be used locally or deployed onto public servers for centralized data hosting and benchmark-ing. It covers most common n-gram based metrics accelerated with multiprocessing, and also provides latest embedding-based metrics such as BERTScore (Zhang et al.,2019).
1 Introduction
Many natural language processing (NLP) tasks can be viewed as conditional text generation prob-lems, where natural language texts are generated given inputs in the form of text (e.g. machine translation), image (e.g. image captioning), au-dio (e.g. automatic speech recognition) or video (e.g. video description). Their automatic evalu-ation usually relies heavily on task-specific met-rics. Due to the complexity of natural language expressions, those metrics are not always perfectly aligned with human assessment. Moreover, met-rics only produce abstract numbers and are limited in illustrating system error patterns. This suggests the necessity of inspecting detailed evaluation ex-amples to get a full picture of system behaviors as
*Work carried out during an internship at Facebook.
Sources Text Image Audio References
Text 1 Text 2
Text N
…
Predictions Model 1 Text Model 2 Text
Model K Text
…
VizSeq
Web App
Jupyter Notebook
Video
[image:1.595.308.526.221.359.2]evaluate.py multi-process scorers
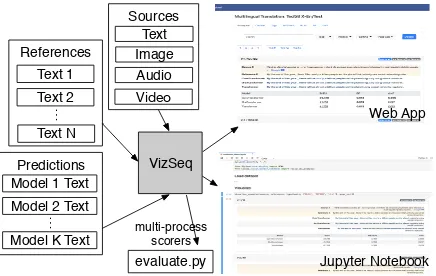
Figure 1: An overview of VizSeq. VizSeq takes multi-modal sources, text references as well as model predic-tions as inputs, and analyzes them visually in Jupyter notebook or in a web app interface. It can also be used without visualization as a normal Python package.
well as seek improvement directions.
A bunch of softwares have emerged to facili-tate calculation of various metrics or demonstrat-ing examples with sentence-level scores in an in-tegrated user interface: ibleu (Madnani, 2011), MTEval1, MT-ComparEval (Klejch et al.,2015), nlg-eval (Sharma et al., 2017), Vis-Eval Met-ric Viewer (Steele and Specia, 2018),
compare-mt (Neubig et al.,2019), etc. Quite a few of them
are collections of command-line scripts for met-ric calculation, which lack visualization to bet-ter present and inbet-terpret the scores. Some of them are able to generate static HTML reports to present charts and examples, but they do not al-low updating visualization options interactively. MT-ComparEval is the only software we found that has an interactive user interface. It is, how-ever, written in PHP, which unlike Python lacks a complete NLP eco-system. The number of met-rics it supports is also limited and the software is no longer being actively developed. Support of multiple references is not a prevalent stan-dard across all the softwares we investigated, and
Source Type Example Tasks
Text machine translation, text summarization, dialog generation, grammatical error cor-rection, open-domain question answering Image image captioning, visual question
answer-ing, optical character recognition Audio speech recognition, speech translation Video video description
[image:2.595.308.524.63.149.2]Multimodal multimodal machine translation
Table 1: Example text generation tasks supported by VizSeq. The sources can be from various modalities.
Metrics VizSeq compare-mt
nlg-eval
MT- Compar-Eval BLEU
[image:2.595.73.291.64.164.2]chrF METEOR TER RIBES GLEU NIST ROUGE CIDEr WER LASER BERTScore
Table 2: Comparison of VizSeq and its counterparts on n-gram-based and embedding-based metric coverage.
none of them supports multiple sources or sources in non-text modalities such as image, audio and video. Almost all the metric implementations are single-processed, which cannot leverage the mul-tiple cores in modern CPUs for speedup and better scalability.
With the above limitations identified, we want to provide a unified and scalable solution that gets rid of all those constraints and is enhanced with a user-friendly interface as well as the lat-est NLP technologies. In this paper, we present VizSeq, a visual analysis toolkit for a wide va-riety of text generation tasks, which can be used for: 1) instance-level and corpus-level system er-ror analysis; 2) exploratory dataset analysis; 3) public data hosting and system benchmarking. It provides visualization in Jupyter notebook or a web app interface. A system overview can be found in Figure 1. We open source the software
athttps://github.com/facebookresearch/vizseq.
BLEU METEOR chrF CIDEr
0 5 10 15 20 25 30 35
Time
(seconds)
[image:2.595.72.291.228.407.2]1 process 2 processes 4 processes
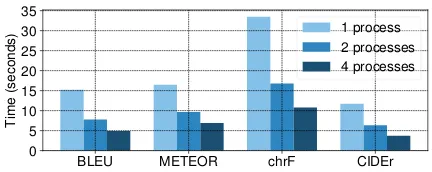
Figure 2: VizSeq implements metrics with multipro-cessing speedup. Speed test is based on a 36k evalua-tion set for BLEU, METEOR and chrF, and a 41k one for CIDEr. CPU: Intel Core i7-7920HQ @ 3.10GHz
2 Main Features of VizSeq
2.1 Multimodal Data and Task Coverage
VizSeq has built-in support for multiple sources and references. The number of references is al-lowed to vary across different examples, and the sources are allowed to come from different modal-ities, including text, image, audio and video. This flexibility enables VizSeq to cover a wide range of text generation tasks and datasets, far beyond the scope of machine translation, which previous soft-wares mainly focus on. Table1 provides a list of example tasks supported by Vizseq.
2.2 Metric Coverage and Scalability
Table 2 shows the comparison of VizSeq and its counterparts on metric coverage.
N-gram-based metrics To the extent of our knowledge, VizSeq has the best coverage of com-mon n-gram-based metrics, including BLEU (
Pap-ineni et al.,2002), NIST (Doddington,2002),
ME-TEOR (Banerjee and Lavie,2005), TER (Snover
et al., 2006), RIBES (Isozaki et al., 2010),
chrF (Popovi´c, 2015) and GLEU (Wu et al., 2016) for machine translation; ROUGE (Lin, 2004) for summarization and video description; CIDEr (Vedantam et al.,2015) for image caption-ing; and word error rate for speech recognition.
Embedding-based metrics N-gram-based met-rics have difficulties in capturing semantic sim-ilarities since they are usually based on ex-act word matches. As a complement, VizSeq also integrates latest embedding-based metrics such as BERTScore (Zhang et al., 2019) and LASER (Artetxe and Schwenk, 2018). This is rarely seen in the counterparts.
1 from vizseq.scorers import
register_scorer
2
3 @register_scorer(’metric name’)
4 def calculate_score(
5 hypothesis: List[str],
6 references: List[List[str]],
7 n_processes: int = 2,
8 verbose: bool = False
9 ) -> Tuple[float, List[float]]:
[image:3.595.307.526.65.266.2]10 return corpus_score, sentence_scores
Figure 3: VizSeq metric API. Users can define and reg-ister their new metric by implementing this function.
users to fully utilize the power of modern multi-core CPUs. We tested our multi-process versions on large evaluation sets and observed significant speedup against original single-process ones (see Figure2). VizSeq’s embedding-based metrics are implemented using PyTorch (Paszke et al.,2017) framework and their computation is automatically parallelized on CPU or GPU by the framework.
Versatility VizSeq’s rich metric collection is not only available in Jupyter notebook or in the web app, it can also be used in any Python scripts. A typical use case is periodic metric calculation during model training. VizSeq’s implementations save time, especially when evaluation sets are large or evaluation is frequent. To allow user-defined metrics, we designed an open metric API, whose definition can be found in Figure3.
2.3 User-Friendly Interface
Given the drawbacks of simple command-line in-terface and static HTML inin-terface, we aim at visu-alized and interactive interfaces for better user ex-perience and productivity. VizSeq provides visu-alization in two types of interfaces: Jupyter note-book and web app. They share the same visual analysis module (Figure4). The web app interface additionally has a data uploading module (Fig-ure 9) and a task/dataset browsing module (Fig-ure10), while the Jupyter notebook interface gets data directly from Python variables. The analysis module includes the following parts.
Example grouping VizSeq uses sentence tags to manage example groups (data subsets of differ-ent interest, can be overlapping). It contains both user-defined and machine-generated tags (e.g. la-bels for identified languages, long sentences, sen-tences with rare words or code-switching). Met-rics will be calculated and visualized by different
1
2
3
4
5
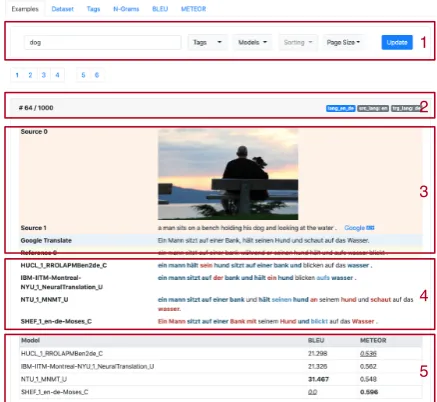
Figure 4: VizSeq example viewing. (1) keyword search box, tag and model filters, sorting and page size op-tions; (2) left: example index, right: user-defined tags (blue) and machine-generated tags (grey); (3) multi-modal sources and Google Translate integration; (4) model predictions with highlighted matched (blue) and unmatched (red) n-grams; (5) sentence-level scores (highest ones among models in boldface, lowest ones in italics with underscore).
example groups as a complement to scores over the entire dataset.
Example viewing VizSeq presents examples with various sentence-level scores and visualized alignments of matched/unmatched reference n-grams in model predictions. It also has Google Translate integration to assist understanding of text sources in unfamiliar languages as well as providing a baseline translation model. Exam-ples are listed in multiple pages (bookmarkable in web app) and can be sorted by various orders, for example, by a certain metric or source sentence lengths. Tags or n-gram keywords can be used to filter out examples of interest.
Dataset statistics VizSeq provides various corpus-level statistics, including: 1) counts of sentences, tokens and characters; 2) source and reference length distributions; 3) token frequency distribution; 4) list of most frequent n-grams (with links to associated examples); 5) distributions of sentence-level scores by models (Figure 5, 6 and 7). Statistics are visualized in zoomable charts with hover text hints.
[image:3.595.63.290.69.178.2]1
[image:4.595.308.523.64.184.2]2 3
Figure 5: VizSeq dataset statistics. (1) sentence, to-ken and character counts for source and reference sen-tences; (2) length distributions of source and reference sentences; (3) token frequency distribution. Plots are zoomable and exportable to SVG or PNG images.
Figure 6: VizSeq dataset statistics: most frequent n-grams (n=1,2,3,4). Each listed n-gram is clickable to show associated examples in the dataset.
users’ zooming applied) and tables into CSV or LATEX (copied to clipboard).
2.4 Data Management and Public Hosting
VizSeq web app interface gets new data from the data uploading module (Figure 9) or a REST-ful API. Besides local deployment, the web app back-end can also be deployed onto public servers and provide a general solution for hosting public benchmarks on a wide variety of text generation tasks and datasets.
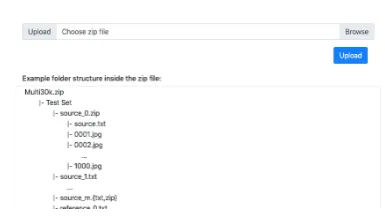
In VizSeq, data is organized by special folder structures as follows, which is easy to maintain:
<task>/<eval set>/source_*.{txt,zip} <task>/<eval set>/reference_*.txt <task>/<eval set>/tag_*.txt
<task>/<eval set>/<model>/prediction.txt <task>/<eval set>/__cfg__.json
When new data comes in, scores, n-grams and machine-generated tags will be pre-computed and cached onto disk automatically. A file monitoring and versioning system (based on file hashes, sizes or modification timestamps) is employed to detect
1
[image:4.595.73.289.68.196.2]2 3
Figure 7: VizSeq corpus-level metric viewing. (1) dis-tributions of sentence-level scores by models; (2) one-click export of tabular data to CSV and LATEX (copied to clipboard); (3) corpus-level and group-level (by sen-tence tags) scores (highest ones among models in bold-face, lowest ones in italics with underscore).
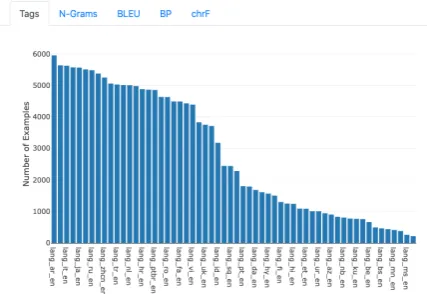
Figure 8: VizSeq sentence tag distribution view. In this example, tags are source-target language directions in a multilingual machine translation dataset.
file changes and trigger necessary updates on pre-computed results. This is important for support-ing evaluation dursupport-ing model trainsupport-ing where model predictions change over training epochs.
3 Example Use Cases of VizSeq
We validate the usability of VizSeq with multiple tasks and datasets, which are included as examples in our Github repository:
• WMT14 English-German2: a classic medium-size dataset for bilingual machine translation.
• Gigaword3: a text summarization dataset.
• COCO captioning 2015 (Lin et al., 2014): a classic image captioning dataset where VizSeq can present source images with text targets.
2
http://www.statmt.org/wmt14/translation-task.html
[image:4.595.309.523.284.431.2] [image:4.595.77.285.285.401.2]Figure 9: VizSeq data uploading. Users need to orga-nize the files by given folder structures and pack them into a zip file for upload. VizSeq will unpack the files to the data root folder and perform integrity checks.
Figure 10: VizSeq task/dataset browsing. Users need to select a dataset and models of interest to proceed to the analysis module.
• WMT16 multimodal machine translation task 14: English-German translation with an image the sentences describe. VizSeq can present both text and image sources, and calculate the official BLEU, METEOR and TER metrics.
• Multilingual machine translation on TED talks dataset (Ye et al., 2018): translation from 58 languages into English. VizSeq can use lan-guage directions as sentence tags to generate score breakdown by languages. The test set has as many as 165k examples, where VizSeq multi-process scorers run significantly faster than single-process ones. The integrated Google Translate can help with understanding source sentences in unfamiliar languages.
• IWSLT17 English-German speech translation5: VizSeq can present English audios with English transcripts and German text translations.
• YouCook (Das et al., 2013) video description: VizSeq enables inspecting generated text
de-4
https://www.statmt.org/wmt16/multimodal-task.html
5https://sites.google.com/site/iwsltevaluation2017
scriptions with presence of video contents.
4 Related Work
With the thrive of deep learning, task-agnostic visualization toolkits such as Tensorboard6, vis-dom7and TensorWatch8, have emerged in need of monitoring model statistics and debugging model training. Model interpretability is another moti-vation for visualization. In NLP, softwares have been developed to interpret model parameters (e.g. attention weights) and inspect prediction genera-tion process: LM (Rong and Adar, 2016), Open-NMT visualization tool (Klein et al., 2018) and Seq2Seq (Strobelt et al.,2019). For machine trans-lation, toolkits are made to perform metric calcu-lation and error analysis: ibleu (Madnani,2011), MTEval9, MT-ComparEval (Klejch et al.,2015), nlg-eval (Sharma et al., 2017), Vis-Eval Metric Viewer (Steele and Specia, 2018) and
compare-mt (Neubig et al.,2019).
5 Conclusion
In this paper, we present VizSeq, a visual anal-ysis toolkit for {text, image, audio, video} -to-text generation system evaluation, dataset analysis and benchmark hosting. It is accessible as a web app or a Python package in Jupyter notebook or Python scripts. VizSeq is currently under active development and our future work includes: 1) en-abling image-to-text and video-to-text alignments; 2) adding human assessment modules; 3) integra-tion with popular text generaintegra-tion frameworks such as fairseq10, opennmt11and tensor2tensor12.
Acknowledgments
We thank the anonymous reviewers for their com-ments. We also thank Ann Lee and Pratik Ring-shia for helpful discussions on this project.
References
Mikel Artetxe and Holger Schwenk. 2018. Mas-sively multilingual sentence embeddings for zero-shot cross-lingual transfer and beyond. arXiv preprint arXiv:1812.10464.
6
https://github.com/tensorflow/tensorboard
7
https://github.com/facebookresearch/visdom
8
https://github.com/microsoft/tensorwatch
9https://github.com/odashi/mteval 10
https://github.com/pytorch/fairseq
11
https://github.com/OpenNMT/OpenNMT-py
[image:5.595.77.287.253.394.2]Satanjeev Banerjee and Alon Lavie. 2005. Meteor: An automatic metric for mt evaluation with improved correlation with human judgments. InProceedings of the acl workshop on intrinsic and extrinsic evalu-ation measures for machine translevalu-ation and/or sum-marization, pages 65–72.
Pradipto Das, Chenliang Xu, Richard F Doell, and Ja-son J Corso. 2013. A thousand frames in just a few words: Lingual description of videos through latent topics and sparse object stitching. InProceedings of the IEEE conference on computer vision and pattern recognition, pages 2634–2641.
George Doddington. 2002. Automatic evaluation of machine translation quality using n-gram co-occurrence statistics. InProceedings of the second international conference on Human Language Tech-nology Research, pages 138–145. Morgan Kauf-mann Publishers Inc.
Hideki Isozaki, Tsutomu Hirao, Kevin Duh, Katsuhito Sudoh, and Hajime Tsukada. 2010. Automatic eval-uation of translation quality for distant language pairs. In Proceedings of the 2010 Conference on Empirical Methods in Natural Language Process-ing, pages 944–952. Association for Computational Linguistics.
Guillaume Klein, Yoon Kim, Yuntian Deng, Vincent Nguyen, Jean Senellart, and Alexander M. Rush. 2018.Opennmt: Neural machine translation toolkit.
Ondˇrej Klejch, Eleftherios Avramidis, Aljoscha Bur-chardt, and Martin Popel. 2015. Mt-compareval: Graphical evaluation interface for machine transla-tion development. The Prague Bulletin of Mathe-matical Linguistics, 104(1):63–74.
Chin-Yew Lin. 2004. Rouge: A package for auto-matic evaluation of summaries. Text Summarization Branches Out.
Tsung-Yi Lin, Michael Maire, Serge Belongie, James Hays, Pietro Perona, Deva Ramanan, Piotr Doll´ar, and C Lawrence Zitnick. 2014. Microsoft coco: Common objects in context. In European confer-ence on computer vision, pages 740–755. Springer.
Nitin Madnani. 2011. ibleu: Interactively debugging and scoring statistical machine translation systems. In2011 IEEE Fifth International Conference on Se-mantic Computing, pages 213–214. IEEE.
Graham Neubig, Zi-Yi Dou, Junjie Hu, Paul Michel, Danish Pruthi, and Xinyi Wang. 2019. compare-mt: A tool for holistic comparison of language genera-tion systems. arXiv preprint arXiv:1903.07926.
Kishore Papineni, Salim Roukos, Todd Ward, and Wei-Jing Zhu. 2002. Bleu: a method for automatic eval-uation of machine translation. In Proceedings of the 40th annual meeting on association for compu-tational linguistics, pages 311–318. Association for Computational Linguistics.
Adam Paszke, Sam Gross, Soumith Chintala, Gre-gory Chanan, Edward Yang, Zachary DeVito, Zem-ing Lin, Alban Desmaison, Luca Antiga, and Adam Lerer. 2017. Automatic differentiation in PyTorch. InNIPS Autodiff Workshop.
Maja Popovi´c. 2015. chrf: character n-gram f-score for automatic mt evaluation. InProceedings of the Tenth Workshop on Statistical Machine Translation, pages 392–395.
Xin Rong and Eytan Adar. 2016. Visual tools for de-bugging neural language models. InProceedings of ICML Workshop on Visualization for Deep Learn-ing.
Shikhar Sharma, Layla El Asri, Hannes Schulz, and Jeremie Zumer. 2017. Relevance of unsupervised metrics in task-oriented dialogue for evaluating nat-ural language generation.CoRR, abs/1706.09799.
Matthew Snover, Bonnie Dorr, Richard Schwartz, Lin-nea Micciulla, and John Makhoul. 2006. A study of translation edit rate with targeted human annotation. In Proceedings of association for machine transla-tion in the Americas, volume 200.
David Steele and Lucia Specia. 2018. Vis-eval metric viewer: A visualisation tool for inspecting and eval-uating metric scores of machine translation output. InProceedings of the 2018 Conference of the North American Chapter of the Association for Computa-tional Linguistics: Demonstrations, pages 71–75.
Hendrik Strobelt, Sebastian Gehrmann, Michael Behrisch, Adam Perer, Hanspeter Pfister, and Alexander M Rush. 2019. Seq2seq-vis: A visual debugging tool for sequence-to-sequence models.
IEEE transactions on visualization and computer graphics, 25(1):353–363.
Ramakrishna Vedantam, C Lawrence Zitnick, and Devi Parikh. 2015. Cider: Consensus-based image de-scription evaluation. In Proceedings of the IEEE conference on computer vision and pattern recog-nition, pages 4566–4575.
Yonghui Wu, Mike Schuster, Zhifeng Chen, Quoc V Le, Mohammad Norouzi, Wolfgang Macherey,
Maxim Krikun, Yuan Cao, Qin Gao, Klaus
Macherey, et al. 2016. Google’s neural ma-chine translation system: Bridging the gap between human and machine translation. arXiv preprint arXiv:1609.08144.
Qi Ye, Sachan Devendra, Felix Matthieu, Padmanab-han Sarguna, and Neubig Graham. 2018. When and why are pre-trained word embeddings useful for neural machine translation. InHLT-NAACL.