Temporal Variations of Runoff and Sediment in Different
Soil Clay Contents Using Simulated Conditions
Mehdi BASHARI
1, Hamid Reza MORADI
1, Mir Masoud KHEIRKHAH
2and Majid JAFARI-KHALEDI
31Department of Watershed Science and Engineering, Faculty of Natural Resources,
Tarbiat Modares University, Noor, Iran; 2Soil Conservation and Watershed Management
Research Institute, Tehran, Iran; 3Department of Statistics, Faculty of Mathematical Sciences,
Tarbiat Modares University, Tehran, Iran
Abstract
Bashari M., Moradi H.R., Kheirkhah M.M., Jafari-Khaledi M. (2013): Temporal variations of runoff and sediment in different soil clay contents using simulated conditions. Soil & Water Res., 8: 124–132.
Soil clay content (SCC) plays an essential role in the processes of infiltration, seal and crust formation, runoff, and soil erosion. The role played by SCC in water erosion has received much attention in recent years. Hence, in order to investigate these effects on a small scale, a simulation experiment was conducted. Soil lacking clay content was combined with 0, 10, 20, 30, 40, and 50% of clay soil, respectively. The experimental setup consisted of rectangular metal plots (1.5 × 1 m) comprising soil with selected combinations of clay content, placed at a 9% slope. Six treatments, three replicates each (totally 18 plots), were exposed to simulated rainfall at an inten-sity of 70 mm/h for 30 min. The results were compared by means of statistical tests. General trends in runoff volume were similar for different SCCs and decreasing and increasing trends were achieved for sediment and runoff, respectively. The results showed significant differences in the hydrological and erosional responses of these soils based on their clay contents. The soils with intermediate clay content were more resistant to erosion and had lower values of the runoff. Finally, time had significant (P < 0.00) effects on both runoff and sediment production during the rainfall.
Keywords: clay; erosion plot; rainfall simulator
Accelerated soil erosion from construction sites and the resulting increase in downstream sedi-ment load constitute a significant environsedi-mental problem (Kawamura & Diamond 1975). Various models are being used to develop soil conservation programmes and identify optimum management practices. The so-called Universal Equation for calculating the long-term loss of soil due to ero-sion (USLE) has widely been used for many years to determine soil erosion risks and evaluate the effectiveness of soil conservation measures (Bana-sik et al. 2001; Janeček et al. 2012). This equation
nomograph for estimating erodibility from basic soil properties. This nomograph is based on the organic matter content, silt plus fine sand content, soil structure, and permeability class. Thus the soil texture is an important factor influencing the structure stability and erodibility in soils.
Soil erodibility expresses the resistance of soil particles to both detachment and transport by rain-drop impact and runoff (Renard et al. 1997). These processes are influenced by soil properties, such as particle size distribution, structural stability, organic matter, soil chemistry, and water transmission char-acteristics (Lal 1994). Soil’s erodibility is a function of complex interactions of a substantial number of its physical and chemical properties and often varies within a standard texture class. The complex process of soil erosion comprises detachment and transport of soil particles in conjunction with raindrop impact and surface runoff. Thus, the amount of soil avail-able for removal by runoff depends on the strength of aggregates to resist disruptive force of raindrop impact (Rimal & Lal 2009).
Different factors have been found to account for the soil hydrological and eroding behaviours (Ruiz Sinoga & Martinez Murillo 2009). Over short within-storm periods, soils properties influence erosion mainly through their hydrology, aggregate stability, and cation dispersion (Kirkby 2001). Perhaps the most significant soil characteristics is soil texture with clay being the most important bonding agent for aggregation in soil texture. Clay acts as a cementing material that holds particles together in an aggregate. Increasing clay content is associated with increased aggregate stability. Clay content physically affects aggregation through swell-ing and dispersion and the potential of swellswell-ing- swelling-induced disintegration is reduced at low clay levels (Feng-Ling et al. 2010). Some clay soils are highly susceptible to erosion and piping because of disper-sion or deflocculation in pore water (Zorluer et al. 2010). In clay-rich soils, aggregates become more stable and the structure of the seal more granular (Kuhn & Bryan 2004). Both texture and structure are unique properties of soils having a profound effect on their behaviour and are closely related to soil clay content (SCC). The effect of changes in textural composition of soils affects some other soil properties like bulk density and water capacities (Rejman et al. 1998). Additionally, field and labora-tory studies have shown that soil loss was affected by changes in the texture of soil (Commandeur 1992; Rejman et al. 1998).
The need to distinguish the different partial pro-cesses led to the development of rainfall simulations on small plots. Rainfall simulations are widely used for the quantification of runoff and erosion processes at different plot and event magnitude scales. It is evident that such types of simulations are designed to sum-marise several processes and to observe their spatial and temporal development (Seeger 2007). Field plot studies have their own uncertainties (Sadeghi et al. 2013) and some properties and processes vary considerably at the field plot scale (Srinivasan et al. 2007). Generally, small field plots are assumed to provide uniform conditions to investigate hydrologic processes by eliminating the heterogeneities arising out of soil, surface cover, climatic, and topographical factors (Srinivasan et al. 2007).
Numerous studies have pointed out the role played by SCCs on erosion as well as on the hydro-logical response of soils (such as infiltration rate, surface sealing, and runoff generation) (Bruce-Okine & Lal 1975; Mbagwu & Bazzoffi 1998; Moradi & Saidian 2010). The effect of SCC on soil erosion is complex and ambivalent. SCCs might either reduce (Sekine & Iizuka 2000; Kuhn & Bryan 2004; Feng-Ling et al. 2010) or increase (Zorluer et al. 2010) erosion and runoff rates. It was also observed that soil loss varied contrarily, in different soil clay contents (Ben-Hur et al. 1985). In general, literature reviews of erosion plot studies point to nonlinear variations in run-off and erosional processes with increasing SCC. Hence, special mention should be given to the SCC because the mechanism of such a complicated phenomenon has not been fully understood yet.
In the present study, rainfall simulations have been used for understanding the influence of different SCCs on runoff generation and erosion. To identify and quantify factors affecting runoff and erosion processes, results of 18 plot scale rainfall simula-tions in different SCCs were analyzed. Thus, the objectives of the present study were to determine: (1) the temporal variations of runoff and soil erosion over the rainfall by the laboratory experiments and (2) the effects of SCCs on runoff generation and soil erosion under simulated rainfalls.
MATERIAL AND METHODS
two soils were selected based on their textures (clay contents) and similar chemical properties. Then erosion plots containing soil lacking clay content, combined with 0, 10, 20, 30, 40, and 50% of clay soil in three replications (totally 18 plots), respectively, were prepared using a concrete mixer. Theoretically it is believed that mixing two soil samples in regular classes should result in the soil also exhibiting regu-lar changes in its texture. However, due to the high volume of soil and low accuracy of granulometric methods, it is practically impossible to prepare soil samples of desired textures exactly. In addition, small amounts of samples used for granulometric methods cannot be good representatives of the whole amount of soil. However, characteristics of combined soils indicate a proper mixture of the soils.
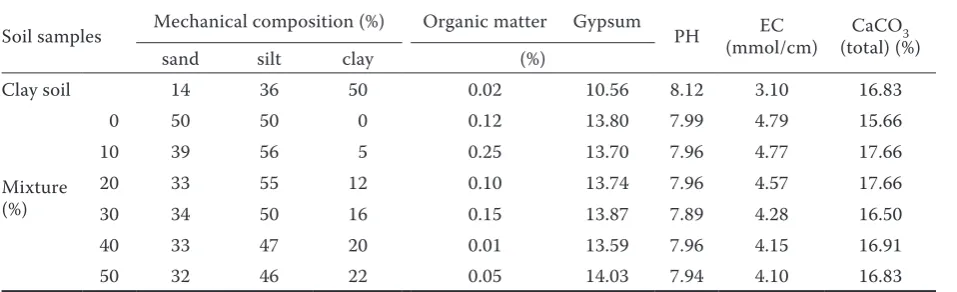
Soil samples were taken from different mixtures for determination of particle size distribution, organic matter content, potential hydrogen (PH), electrical conductivity (EC), gypsum, and the total calcium carbonate content as main factors affecting erosion (Oygarden et al. 1997). Total calcium carbonate content was measured by titrimetric method accord-ing to Loeppert and Suarez (1996). Organic matter was measured following Rowell (2000). Gypsum was measured according to Artieda et al. (2006) and particle size was analyzed using hydrometric method according to Gee and Bauder (1979). Information on soil properties is given in Table 1.
Artificial rainfall was produced from a spray nozzle and spinning disk-type FEL3 rainfall simu-lator with a raindrop fall height of 2.65 m (Jaya-wardena & Bhuiyan 1999) and uniformity of 80%. Uniformity in rainfall application was assessed using the coefficient described by Maroufpoor
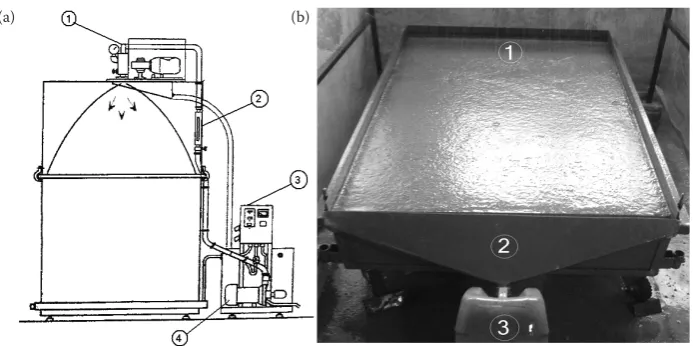
et al. (2010). The rainfall simulator based on the design by Armfield (1998) (Figure 1a) was used
to produce a 30 min rainfall at an intensity of ap-proximately 70 mm/h (Nicolaisen et al. 2007).
Erosion tests involved simulated rainfall on filled 1.5 m long × 1.0 m wide plots. The experimental plots were adjusted to 9% slope gradient (Rimal & Lal 2009). These plots were constructed from galvanized iron sheet with a runoff funnel at the lower end (Figure 1b).
In each plot, a 0.2 m soil layer was placed over a 0.075 m layer of gravel filter (Rimal & Lal 2009). The bases of plots were connected with pipe at one point to facilitate infiltration. In the course of the plot filling the soil was tamped layer by layer. The erosion plots were filled with sieved soil and the soil surface flattened using a board (Smets et al. 2007). In the laboratory, the soil samples were saturated with water from the bottom upwards. The water was then allowed to flow out by equilibrating the free water level of the sample to bottom level of the sample. All soil plots were kept on a horizontal seat to obtain an even flow of percolating water (Muukkonen et al. 2009).
After 24 h, the plots were placed under the rainfall simulator and three replicates were used for each clay content and temporal assessments of the soil erosion and runoff generation were carried out over a 30 min rainfall period within erosion plots with similar slope and rainfall intensity conditions but with differing SCCs.
[image:3.595.63.542.597.743.2]During simulation experiments, a constant rainfall intensity was applied to generate 30 min of continuous runoff from plots that were ap-proximately at field capacity at the time of rainfall initiation (Srinivasan et al. 2007). During the rainfall, plastic containers were used to collect the runoff and sediment at the outlet of each plot. The simulation time was subdivided into 12 time steps
Table 1. Some physical and chemical properties of the studied soils
Soil samples Mechanical composition (%) Organic matter Gypsum PH (mmol/cm)EC CaCO3
(total) (%)
sand silt clay (%)
Clay soil 14 36 50 0.02 10.56 8.12 3.10 16.83
Mixture (%)
0 50 50 0 0.12 13.80 7.99 4.79 15.66
10 39 56 5 0.25 13.70 7.96 4.77 17.66
20 33 55 12 0.10 13.74 7.96 4.57 17.66
30 34 50 16 0.15 13.87 7.89 4.28 16.50
40 33 47 20 0.01 13.59 7.96 4.15 16.91
50 32 46 22 0.05 14.03 7.94 4.10 16.83
of 2.5 min each. Runoff volumes were measured at these time intervals to generate a hydrograph for each 30 min runoff event.
The time when water started to flow through the outlet was recorded as runoff start (Seeger 2007) and during rainfalls, runoff samples for assessment of soil loss were collected at termi-nal funnels at intervals of 2.5 min. The collected samples of surface runoff were filtered through a Whatman Grade No. 42 Quantitative Filter Paper (Rimal & Lal 2009) and soil loss was determined by weighing the oven-dried (at 105°C) filtered samples (Seeger 2007; Smets et al. 2007).
Runoff and sediment concentration data were ana-lyzed with PASW Statistics 18.0 software (SPSS Inc., Hong Kong, China). Analysis of variance was per-formed to identify the effects of SCCs on runoff and sediment concentrations and the Fisher’s least significant difference test was used to determine statistical significance among treatment means. A probability level < 0.05 was considered significant. Finally, to evaluate the influence of SCC on the temporal variability of runoff and sediment, the effects of time intervals (repeated measurements) were analyzed using the General Linear Models (GLM) Procedure of SAS (Nicolaisen et al. 2007; Rimal & Lal 2009).
RESULTS AND DISCUSSION
In order to investigate the temporal effects of SCC on sediment concentration during each run, 2.5 min intervals measured during each experi-ment were plotted against corresponding sediexperi-ment
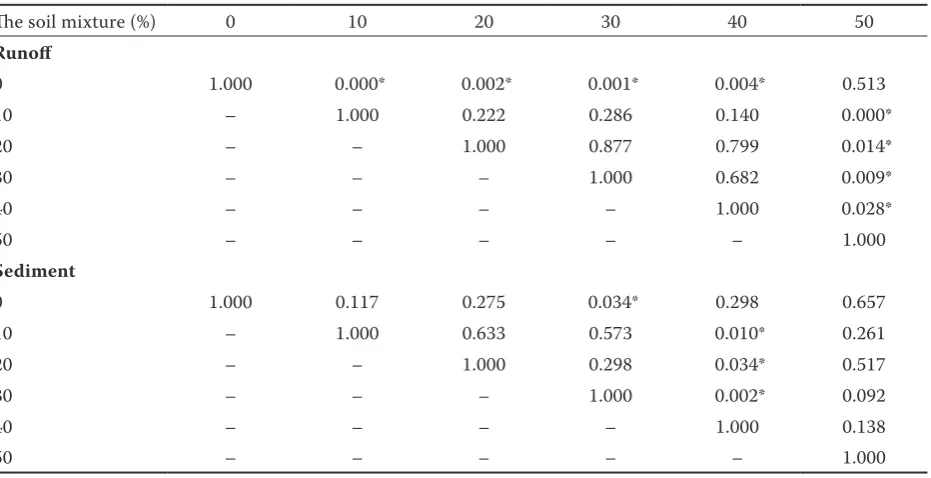
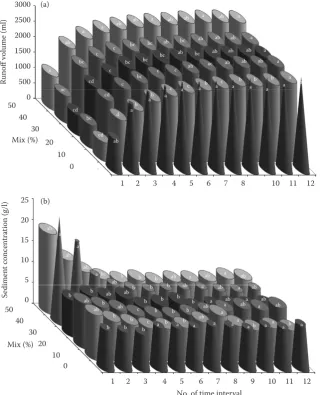
concentrations averaged over 3 replicates. Figure 2 indicates the effects of SCC on runoff volume and sediment concentration variations during each experiment, respectively. It can be observed that, in all treatments temporal trend of runoff has in-creased over the simulation period, but sediment concentration decreased from the initial high value to a constant one. Fisher’s least significant differ-ences (LSD) between observed values of runoff and sediment are listed in Table 2. Also, as shown in Figure 3, Fisher’s LSD test was applied to each of the runoff (Figure 3a) and sediment (Figure 3b) values in different SCCs to determine homogene-ous subsets. The mentioned outputs show that in case of runoff, soils lacking clay content and 50% of clay soil mixture have significantly higher values in comparison with other treatments. For sediment concentration, 40 and 50% of clay soil mixtures because of their higher values in the initial time steps of rainfall and then soil lacking clay content because of its higher concentration values over the rainfall, differ from other treatments.
As it was reported that soil type could influence runoff (Zhang et al. 2007), the results of the rainfall simulation experiments showed significant differ-ences in the hydrological response of soils between different SCCs. Expectedly, surface runoff went significantly up with increasing duration of simu-lated rain. Besides, general trends in runoff volume for different clay contents were similar, because during the rainfall simulation, there is a reduction in surface storage, consequently accelerating seal formation processes and generating high runoff. Similar trends in surface runoff were reported by Salehi et al. (1993) and Rimal and Lal (2009). Figure 1. (a): schematic view of rainfall simulator, 1 – spray head assembly, 2 – flow control valve, 3 – electrical con-trol panel, 4 – centrifugal water pump; (b): erosional set-up, 1 – erosion plot, 2 – runoff funnel, 3 – plastic container
[image:4.595.123.470.80.253.2]Also, the results demonstrated significant differ-ences in the erosional response of soils associated with their clay contents. In this regard, Ben-Hur
et al. (1985) found that the effect of clay content on the susceptibility of soils to seal formation and soil loss varied with clay content. But Feng-Ling et al. (2010) found that erodibility generally decreases with the rising clay content of the soil. Therefore, clay content in the soil might have two opposing effects on runoff and soil erosion.
The soils with intermediate clay contents (10, 20, and 30% clay) were more resistant to ero-sion. In this case, positive influence of clay on the aggregate stability agrees with findings of
[image:5.595.68.531.80.250.2]McConnell (1989), Siegrist et al. (1998), and Moreno de las Heras (2009). But soils lacking clay (0%) or containing high (40 and 50%) clay contents showed similar responses to simulated rainfall in the cases of high productions of runoff and sediment. Wischmeier and Smith (1978) declared that usually a soil type becomes less erodible with decrease in silt fraction, regardless of whether the corresponding increase is in the sand fraction or the clay fraction. To expound these contradictions in results, it should be noted that the loss of structural stability under the impact of raindrops results in smaller and more easily transportable soil particles. So, the collapse of Figure 2. Total mean surface runoff (a) and sediment (b) from six different soil clay contents (SCCs) at different time intervals
Table 2. Results of the LSD multiple comparison tests of runoff and sediment between different soil clay contents (SCCs)
The soil mixture (%) 0 10 20 30 40 50
Runoff
0 1.000 0.000* 0.002* 0.001* 0.004* 0.513
10 – 1.000 0.222 0.286 0.140 0.000*
20 – – 1.000 0.877 0.799 0.014*
30 – – – 1.000 0.682 0.009*
40 – – – – 1.000 0.028*
50 – – – – – 1.000
Sediment
0 1.000 0.117 0.275 0.034* 0.298 0.657
10 – 1.000 0.633 0.573 0.010* 0.261
20 – – 1.000 0.298 0.034* 0.517
30 – – – 1.000 0.002* 0.092
40 – – – – 1.000 0.138
50 – – – – – 1.000
*Mean difference is significant at the 0.05 level 0
500 1000 1500 2000 2500 3000 3500
1 2 3 4 5 6 7 8 9 10 11 12
Ru
no
ff
vo
lu
m
e (
m
l)
Time (min) (a)
Mix 0% Mix 10% Mix 20% Mix 30% Mix 40% Mix 50%
0 5 10 15 20 25 30
1 2 3 4 5 6 7 8 9 10 11 12
Se
di
ment
conce
nt
ra
tion
(g
/l
)
Time (min)
(b) Mix 0%
Mix 10% Mix 20% Mix 30% Mix 40% Mix 50%
Time (min) Time (min)
Runoff volume (ml)
Se
dimen
t c
onc
en
tra
tion (
g/l)
1 2 3 4 5 6 7 8 9 10 11 12 1 2 3 4 5 6 7 8 9 10 11 12 Mix (%)
0 10 20 30 40 50
Mix (%) 0 10 20 30 40 50 3500
3000
2500
2000
1500
1000
500
0
(a) 30 (b)
25
20
15
10
5
[image:5.595.67.533.505.744.2]structural aggregates associated with surface seal-ing directly influences both the detachability and the transportability. Also, the surface sealing, by reducing infiltration and increasing the amount of runoff water, increases the transportability of detached particles (Vanelslande et al. 1984).
[image:6.595.67.522.81.228.2]Overall, the suspended sediment concentration has a peak value at the beginning of simulation. General trends in sediment concentrations were similar for 40 and 50% of clay soil mixtures and had a sudden decrease in initial time intervals. This variability may be explained by differences in soil
[image:6.595.64.387.360.756.2]Figure 4. Total mean runoff (a) and sediment (b) for six differ-ent soil clay contdiffer-ents (SCCs) within each time interval and their homogeneous subsets Figure 3. Total mean runoff (a) and sediment (b) for six different soil clay contents (SCCs) and their homogeneous subsets
Mix. 0% Mix. 10% Mix. 20% Mix. 30% Mix. 40% Mix. 50%0
500 1000 1500 2000 2500 3000
1 2 3 4 5 6 7 8 9 10 11 12
ab a
a a
a a a a a a a a
cd d
b
b c
c b c b b
b a
bc cd
c bc
c c ab ac
ab ab ab a
cd cd
c
bc bc bc
ab bc ab ab ab a
ac bc
c c
bc bc ab bc ab ab ab a
a ab
a a
ab ab a ab ab
a ab a
Ru no ff vo lu m e ( m l)
No. of time interval (a)
Runoff volume (ml)
(a) 3000 2500 2000 1500 1000 500 0
1 2 3 4 5 6 7 8 10 11 12 40 30 20 10 0 50 Mix (%) Mix. 0% Mix. 20% Mix. 30% Mix. 40% Mix. 50% Mix. 50%0
5 10 15 20 25
1 2 3 4 5 6 7 8 9 10 11 12
b b b a a a a a a a a a
ab
b b
c b b ab
a a
b a b
ab b
ab c b
b b ab a ab a ab
b b ab ab
b b b b a ab a ab
a a
a ab
b b b ab a ab a ab
ab
ab ab
bc b b
b ab a ab a ab
Sed im ent co nc en tr at io n (g /l)
No. of time interval (b) Se dimen t c onc en tra tion (
g/l) 25 (b)
20
15
10
5
0
No. of time interval
1 2 3 4 5 6 7 8 9 10 11 12 50 40 30 20 10 0 Mix (%) a
b b b b
a 0 500 1000 1500 2000 2500 3000
0 10 20 30 40 50
Runo
ff
vo
lum
e (ml)
Clay soil mixture (%) (a) ac bc cd bd a acd 0 2 4 6 8 10 12 14
0 10 20 30 40 50
Se di me nt c onc en tr at io n ( g/ l)
Clay soil mixture (%) (b)
Runoff volume (ml)
(a) 14 (b)
12 10 8 6 4 2 0 3000 2500 2000 1500 1000 500 0 Se dimen t c onc en tra tion ( g/l)
Clay soil mixture (min)
0 10 20 30 40 50
Clay soil mixture (min)
moisture contents. At high soil moisture contents clay particles rearrange themselves, this leads to age-hardening and increasing cohesion between soil particles (Kuhn & Bryan 2004), so a small increase in the moisture content of the aggregates increases the aggregate stability (Boix-Fayos et al. 1998).
But soils lacking clay content (0%) had a constant erosion rate. On the contrary, Sekine and Iizuka (2000) found that the erosion rate makes a sudden drop if the sample contains only a small amount of clay and by the clay content ratio between 20 and 80% the erosion rate is almost constant. It is be-cause in the well-structured soils only fine mate-rial is transported, whereas the concentration is more uniform over the different size classes for soil without any aggregate (Asadi et al. 2006) similar to the soil samples used in the present study. Also, it was difficult to find general trends for other SCCs.
Temporal variations analysis has been performed on runoff and sediment data using the GLM re-peated measures procedure. Significant effects (F = 7.193 and Sig. = 0.003) of duration were ob-served in the amount of the sediment concentration under simulation runs among twelve time intervals. Thus, to determine which levels differ reliably from one another, a post-hoc LSD test was conducted (Figure 4). Among twelve time intervals in which runoff were measured, only in the last ones no significant differences were found between runoff data in different treatments, although these dif-ferences were reduced gradually while the rainfall simulation proceeded. In this regard Rimal and Lal (2009) showed that there was a significant difference in surface runoff among treatments before 35 min of simulation run.
Also, the tests of within subjects effects re-veal significant differences between time in-tervals in the runoff volumes (F = 399.528 and Sig. = 0.000). Study of temporal variations of the sediment concentration during rainfall showed that in the ninth and eleventh time intervals, differ-ences between values were not significant unlike in the other treatments. However, in most of the time intervals, soil lacking clay content was the reason of these significant differences. A similar finding was observed by Lal (1981), who stated that soil erodibility is a time dependent function and it is influenced by deterioration of the soil structure and accumulation of the less erodible coarse fraction at the soil surface. So, the struc-tural stability is an important controlling factor (Vanelslande et al. 1984).
Finally, it should be noted that although in many soil conservation programmes soil erodibility is estimated from Wischmeier and Smith (1978) nomograph, the nomograph estimated values dif-fer considerably from those measured directly (Singh & Khera 2010). In this regard, Atawoo and Heerasing (1997) explained that low soil erodibility factors estimated from nomograph can be accounted for by the relatively high clay con-tent of all the soils tested. Therefore appropriate modifications to the nomograph are needed and in this respect soil clay content is one of the main factors which should be investigated.
CONCLUSIONS
In the present study, several series of systematic experiments were conducted to investigate the erosional characteristics of clay mixtures in soil. Overall, the textural characteristics of soil were found to have a considerable influence on the po-tential of soil loss and runoff volume. The highest surface runoff was observed in soil lacking clay compared to high clay content soil also the stud-ied soils with different clay content affected the volume of runoff significantly. General trends in runoff volume were similar for different soil clay contents but it was difficult to find out a general trend for sediment concentration. Additionally, time had significant effects on both runoff and sediment production although these differences were reduced gradually while the rainfall simula-tion proceeded. The present study showed that the effects of SCCs on soil erosion are complex and ambivalent, hence considerably more research is required in the future for fully understanding the erosion mechanism.
References
Armfield (1998): Instruction Manual of Rainfall Simulator FEL3. Armfield Ltd., Ringwood.
Artieda O., Herrero J., Drohan P.J. (2006): Refinement of the differential water loss method for gypsum determi-nation in soils. Soil Science Society of America Journal, 70: 1932–1935.
Asadi H., Ghadiri H., Rouhipour H., Rose C. (2006): Interaction between rain and runoff processes during rainstorm erosion events. In: 14th Int. Soil Conservation
Atawoo M.A., Heerasing J.M. (1997): Estimation of soil erodibility and erosivity of rainfall patterns in Mauritius. In: AMAS 2007. Food and Agricultural Research Council, Reduit, 219–223.
Banasik K., Gorski D., Mitchell J.K. (2001): Rainfall ero-sivity for east and central Poland. In: Proc. Int. Symp. Soil Erosion Research for the 21st Century. January 3–5,
Ameri-can Society of Agricultural Engineers, Honolulu, 279–282. Ben-Hur M., Shainberg I., Bakker D., Keren R. (1985):
Effect of soil texture and CaCO3 content on water infiltra-tion in crusted soils as related to water salinity. Irrigainfiltra-tion Science, 6: 281–284.
Boix-Fayos C., Calvo-Cases A., Imeson A.C., Soriano-Soto M.D., Tiemessen I.R. (1998): Spatial and short-term temporal variations in runoff, soil aggregation and other soil properties along a mediterranean climatological gradient. Catena, 33: 123–138.
Bruce-Okine E., Lal R. (1975): Soil erodibility as deter-mined by a raindrop technique. Soil Science, 119: 149–159. Commandeur P.R. (1992): Soil erosion studies using rain-fall simulation on forest harvested areas in British Co-lumbia. In: Proc. Chengdu Symp. Erosion, Debris Flows and Environment in Mountain Regions. July 5–9, IAHS Publications No. 209, 21–28.
Feng-Ling Y., Zhi-Hua SH., Chong-Fa C., Zhao-Xia L. (2010): Wetting rate and clay content effects on interrill erosion in ultisols of southeastern China. Pedosphere, 20: 129–136.
Gee G.W., Bauder J.W. (1979): Particle size analysis by hydrometer: a simplified method for routine textural analysis and a sensitivity test of measured parameters. Soil Science Society of America Journal, 43: 1004–1007. Janeček M., Květoň V., Kubátová E., Kobzová D. (2012):
Differentiation and regionalization of rainfall erosiv-ity factor values in the Czech Republic. Soil and Water Research, 7: 1–9.
Jayawardena A.W., Bhuiyan R.R. (1999): Evaluation of an interrill soil erosion model using laboratory catchment data, Hydrological Processes, 13: 89–100.
Kawamura M., Diamond S. (1975): Stabilization of clay soils against erosion loss. Clays and Clay Minerals, 23: 444–451.
Kirkby M. (2001): Modelling the interactions between soil properties and water erosion. Catena, 46: 89–102. Kuhn N.J., Bryan R.B. (2004): Drying, soil surface
condi-tion and interrill erosion on two Ontario soils. Catena, 57: 113–133.
Lal R. (1981): Soil erosion problems on Alfisols in western Nigeria, VI – Effects of erosion on experimental plots. Geoderma, 25: 215–230.
Lal R. (1994): Soil Erosion Research Methods. 2nd Ed. Soil
and Water Conservation Society, St. Lucie Press, Ankeny.
Loeppert R.H., Suarez D.L. (1996): Carbonate and Gyp-sum. Paper No. 504, USDA-ARS, Lincoln.
Maroufpoor E., Faryabi A., Ghamarnia H., Moshrefi G. (2010): Evaluation of uniformity coefficients for sprin-kler irrigation systems under different field conditions in Kurdistan province (Northwest of Iran). Soil and Water Research, 5: 139–145.
Mbagwu J.S.C., Bazzoffi P. (1998): Soil characteristics related to resistance of breakdown of dry soil aggregates by water-drops. Soil Tillage Research, 45: 133–145. McConnell S.G. (1989): Potential wind and water erodibility
of four land-use systems in south-eastern Montana, USA. Agriculture, Ecosystems and Environment. 25: 207–215. Moradi H.R., Saidian H. (2010): Comparing the most
important factors in the erosion and sediment produc-tion in different land uses (Case study: Gachsaran and Aghajari Formations). Journal of Environmental Science and Engineering., 4: 1–12.
Moreno de las Heras M. (2009): Development of soil physical structure and biological functionality in min-ing spoils affected by soil erosion in a Mediterranean-Continental environment. Geoderma, 149: 249–256. Muukkonen P., Hartikainen H., Alakukku L. (2009):
Effect of soil structure disturbance on erosion and phos-phorus losses from Finnish clay soil. Soil & Tillage Re-search, 103: 84–91.
Nicolaisen J.E., Gilley J.E., Eghball B., Marx D.B. (2007): Crop residue effects on runoff nutrient concentra-tions following manure application. Transacconcentra-tions of the ASABE, 50: 939−944.
Oygarden L., Kvaerner J., Jenssen P.D. (1997): Soil ero-sion via preferential flow to drainage systems in clay soils. Geoderma, 76: 95–86.
Rejman J., Turski R., Paluszek J. (1998): Spatial and tem-poral variations in erodibility of loess soil. Soil & Tillage Research, 46: 61–68.
Renard K.G., Foster G.R., Weesies G.A., McCool D.K., Yoder D.C. (1997): Predicting soil erosion by water: a guide to conservation planning with the Revised Univer-sal Soil Loss Equation (RUSLE). Agriculture Handbook No. 703, U.S. Department of Agriculture, Washington, DC. Rimal B.K., Lal R. (2009): Soil and carbon losses from five different land management areas under simulated rainfall. Soil & Tillage Research, 106: 62–70.
Rowell M.J. (2000): Measurement of soil organic mat-ter: A compromise between efficacy and environmental friendliness. Agricola, 11: 66–69.
Sadeghi S.H.R., Bashari Seghaleh M., Rangavar A.S. (2013): Plot sizes dependency of runoff and sediment yield estimates from a small watershed. Catena, 102: 55–61.
Salehi F., Pesant A.R., Berard A., Lagace R. (1993): Preliminary estimates of the erodibility of 10 Quebec eastern townsips soil series. Canadian Agricultural En-gineering, 35: 157–164.
Seeger M. (2007): Uncertainty of factors determining runoff and erosion processes as quantified by rainfall simulations. Catena, 71: 56–67.
Sekine M., Iizuka N. (2000): Erosion rate of cohesive sedi-ment. In: 4th Int. Conf. Hydro-Science and -Engineering
(ICHE). Seoul.
Siegrist S., Schaub D., Pfiffner L., Maeder P. (1998): Does organic agriculture reduce soil erodibility? The results of a long-term field study on loess in Switzerland. Agriculture, Ecosystems and Environment, 69: 253–264. Singh M.J., Khera K.L. (2010): Evaluation and estimation
of soil erodibility by different techniques and their Rela-tionships. In: 19th World Congr. Soil Science: Soil
Solu-tions for a Changing World. August 1–6, Brisbane, 37–40.
Smets T., Poesen J., Fullen M.A., Booth C.A. (2007): Ef-fectiveness of palm and simulated geotextiles in reducing
run-off and inter-rill erosion on medium and steep slopes. Soil Use and Management, 23: 306–316.
Srinivasan M.S., Kleinman P.J.A., Sharpley A.N., Buob T., Gburek W.J. (2007): Hydrology of small field plots used to study phosphorus runoff under simulated rainfall. Journal of Environmental Quality, 36: 1833–1842. Vanelslande A., Rousseau P., Lal R., Gabriels D.,
Ghuman B.S. (1984): Testing the applicability of a soil erodibility nomogram for some tropical soils. In: Proc. Harare Symp. Challenges in African Hydrology and Water Resources. IAHS Publication No. 144, 463–473. Wischmeier W.H., Smith D.D. (1978): Predicting rainfall
erosion losses-a guide to conservation planning. Agricul-ture Handbook No. 537, U.S. Department of AgriculAgricul-ture, Washington.
Zhang M.K., Wang L.P., He Z.L. (2007): Spatial and tem-poral variation of nitrogen exported by runoff from sandy agricultural soils. Journal of Environmental Sciences, 19: 1086–1092.
Zorluer I., Icaga Y., Yurtcu S., Tosun H. (2010): Appli-cation of a fuzzy rule-based method for the determination of clay dispersibility. Geoderma, 160: 189–196.
Received for publication November 5, 2012 Accepted after corrections February 25, 2013
Corresponding author: