A Report on the Automatic Evaluation of Scientific Writing Shared Task
Vidas Daudaravicius VTeX
Rafael E. Banchs
Institute for Infocomm Research [email protected]
Elena Volodina University of Gothenburg
Courtney Napoles Johns Hopkins University
Abstract
The Automated Evaluation of Scientific Writ-ing, or AESW, is the task of identifying sen-tences in need of correction to ensure their ap-propriateness in a scientific prose. The data set comes from a professional editing company, VTeX, with two aligned versions of the same text – before and after editing – and covers a variety of textual infelicities that proofreaders have edited. While previous shared tasks fo-cused solely on grammatical errors (Dale and Kilgarriff, 2011; Dale et al., 2012; Ng et al., 2013; Ng et al., 2014), this time edits cover other types of linguistic misfits as well, in-cluding those that almost certainly could be interpreted as style issues and similar “matters of opinion”. The latter arise because of dif-ferent language editing traditions, experience, and the absence of uniform agreement on what “good” scientific language should look like. Initiating this task, we expected the participat-ing teams to help identify the characteristics of “good” scientific language, and help create a consensus of which language improvements are acceptable (or necessary). Six participat-ing teams took on the challenge.
1 Introduction
The vast number of scientific papers being authored by non-native English speakers creates an imme-diate demand for effective computer-based writing tools to help writers compose scientific articles. Sev-eral shared tasks have been organized before that in part addressed this challenge, all with English lan-guage learners in mind: Helping Our Own, HOO,
with two editions in 2011 and 2012 (Dale and Kil-garriff, 2011; Dale et al., 2012); and two Grammat-ical Error Correction Tasks in 2013 and 2014 (Ng et al., 2013; Ng et al., 2014). The four shared tasks focused on grammar error detection and correction, and constituted a major step towards evaluating the feasibility of building novel grammar error correc-tion technologies.
An extensive overview of the automated gram-matical error detection for language learners was conducted by Leacock et al. (2010). In subse-quent years two English language learner (ELL) corpora were made available for research purposes (Dahlmeier et al., 2013; Yannakoudakis et al., 2011). While these achievements are critical for language learners, we also need to develop tools that support genre-specific writing features. This shared task fo-cused on the genre of scientific writing.
Most scientific publications are written in English by non-native speakers of English. Submitted ar-ticles are often returned to the authors with an en-couragement to improve the language or have a na-tive speaker proofread the paper. Pierson (2004) lists 10 top reasons why manuscripts are not accepted for publication, with poor writing in the 7th place.
In Section 2, we describe the task and its objec-tives; Section 3 gives an overview of the data set; Section 4 introduces the participating teams; Section 5 describes the framework used for organizing com-petitions; Section 6 summarizes the results of the task; Section 7 provides a detailed analysis and dis-cussion of the results; and, finally, Section 8 presents the main conclusions of the Shared Task and our proposed future actions.
Institution/Group Abbreviation Contact Person
Harvard University HU Allen Schmaltz
Heidelberg Institute for Theoretical Studies HITS Mohsen Mesgar
ImproveSWDublin ISWD Liliana Mamani Sanchez
Knowlet Knowlet René Witte
National Taiwan Normal University and Yuan Ze University NTNU-YZU Lung-Hao Lee
[image:2.612.92.522.60.144.2]University of Washington + Stanford University UW-SU Woodley Packard
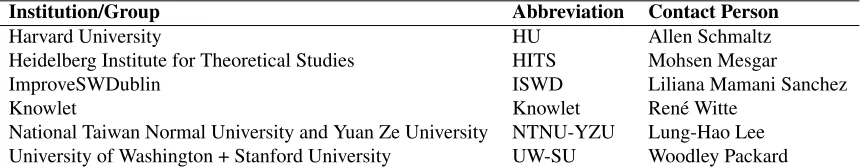
Table 1:The teams that submitted results.
2 Task Definition
The goal of the Automated Evaluation of Scientific Writing (AESW) Shared Task was to analyze the linguistic characteristics of scientific writing to pro-mote the development of automated writing evalua-tion tools that can assist authors in writing scientific papers. More specifically, the task was to predict whether a given sentence requires editing to ensure its “fit” within the scientific writing genre.
The main goals of the task were to
– identify sentence-level features that are unique to scientific writing;
– provide a common ground for development and comparison of sentence-level automated writ-ing evaluation systems for scientific writwrit-ing; – establish the state-of-the-art performance in the
field.
A few words should be said about the specifics of the scientific writing data set. Some proportion of “corrections” in the shared task data are “real er-ror” corrections – i.e. such that most of us would agree that they are errors – for example, wrong pro-nouns and various other grammatical errors. Others almost certainly represent style issues and similar “matters of opinion”, and it seems unfair to expect someone to spot these. This is because of differ-ent language editing traditions, experience, and the absence of uniform agreement of what “good” lan-guage should look like. The task was organized to create a consensus of which language improvements are acceptable (or necessary) and to promote the use of NLP tools to help non-native writers of English to improve the quality of their scientific writing.
Some interesting uses of sentence-level quality evaluations are the following:
– automated writing evaluation of submitted sci-entific articles;
– authoring tools for writing English scientific texts;
– identifying sentences that need quality im-provement.
The task is defined as a binary classification of sentences, with the two categories needs improve-mentanddoes not need improvement. Two types of predictions are evaluated: Binary prediction (False or True)1 and Probabilistic estimation (between 0 and 1).
The predictions of the test data set should be re-ported according to the following format:
– For theBinary prediction task:
<sentenceID><tab><True|False><new line>
e.g.,9.12\tTrue\n
– For theProbabilistic estimation task:
<sentenceID><tab><Real number><new line>
e.g.,9.12\t0.75212\n 3 The Data Set
The data set is a collection of text extracts from 9,919 published journal articles (mainly from Physics and Mathematics) with data before and af-ter language editing. The data are from selected pa-pers published in 2006–2013 by Springer Publish-ing Company2and edited at VTeX3by professional language editors who were native English speakers (Daudaravicius, 2015). Each extract is a paragraph that contains at least one edit made by the language editor. All paragraphs in the data set were randomly ordered from the source text for anonymization. Ad-ditionally, identifying parts of the text were replaced with placeholders, specifically authors, institutions, citations, URLs, and mathematical formulas. This
Domain # of paragraphs # of sentences with nochanges before editing# of sentences with changesafter editing Train Dev Test Train Dev Test Train Dev Test Train Dev Test
Mathematics 78,748 9,679 9,522 218,585 27,784 28,347 353,610 44,571 44,530 353,929 44,755 44,512 Physics 55,949 7,517 7,080 169,160 23,290 19,203 291,917 39,031 35,165 291,902 38,994 35,180 Engineering 54,370 6,360 6,785 145,013 17,309 17,722 244,900 28,997 30,398 244,518 28,942 30,347 Computer
Sci-ence 36,387 4,549 4,039 103,368 12,234 11,694 164,460 19,962 18,493 164,472 19,953 18,497 Statistics 14,724 1,755 1,613 42,390 5,283 4,475 70,121 8,607 7,329 70,139 8,604 7,342 Economics and
Management 6,961 794 726 25,677 2,582 2,646 37,661 3,969 4,080 37,718 3,969 4,086 Astrophysics 3,343 389 321 8,492 588 858 16,571 1,392 1,676 16,630 1,384 1,694 Chemistry 2,581 278 315 7,697 831 1,063 13572 1,562 1,838 13,577 1,559 1,832
Human Sciences 1,081 57 70 2,358 205 176 4090 318 295 4,055 318 294
[image:3.612.72.539.57.222.2]Total 254,144 31,378 30,471 722,740 90,106 86,184 1,196,902 148,409 143,804 1,196,940 148,478 143,784 Table 2:The main statistics of the AESW data-set (version 1.2).
replacement was done automatically and is based on annotation in primary data sources that were LATEX files4. This dataset will be made freely available on the Internet5for replications and other studies.
Sentences were tokenized automatically, and then both text versions –beforeandafterediting – were automatically aligned with a modified diff algo-rithm. Some sentences have no edits, and some sen-tences have edits that are marked with<ins> and
<del> tags. The text tagged with <ins> is the text that wasinsertedby the language editor, and the text tagged with <del> is the text deleted by the language editor. Substitutions are tagged as inser-tions and deleinser-tions because it is not always obvious which words are substituted with which. Some edits introduce or eliminate sentence boundaries. In such cases, a few sentences are combined into one data set sentence and, therefore, the number of tagged sen-tences in the data set differs before and after editing (see Table 2).
The training, development and test data sets com-prise data from independent sets of articles (see Ta-ble 2).
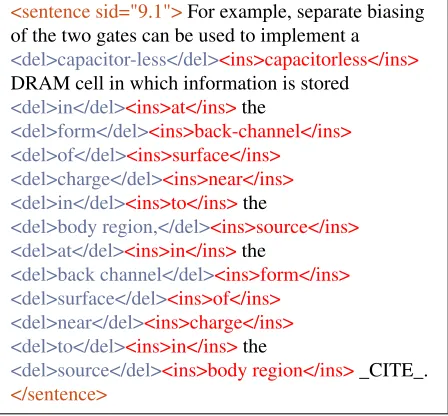
– The training data: A fragment of training data is shown in Table 3 where multiple insertions and deletions can be seen.
– The development data: The development data is distributionally similar to the training data and the test data with regard to the edited and
4We used tex2txtconversion tool (see demo: http: //textmining.lt:8080/tex2txt.htm)
5More information is available at http:// textmining.lt/aesw/index.html
<sentence sid="9.1">For example, separate biasing of the two gates can be used to implement a <del>capacitor-less</del><ins>capacitorless</ins> DRAM cell in which information is stored
<del>in</del><ins>at</ins>the
<del>form</del><ins>back-channel</ins> <del>of</del><ins>surface</ins>
<del>charge</del><ins>near</ins> <del>in</del><ins>to</ins>the
<del>body region,</del><ins>source</ins> <del>at</del><ins>in</ins>the
<del>back channel</del><ins>form</ins> <del>surface</del><ins>of</ins>
<del>near</del><ins>charge</ins> <del>to</del><ins>in</ins>the
<del>source</del><ins>body region</ins>_CITE_. </sentence>
Table 3:A fragment of training data.
non-edited sentences, as well as the domain. – The test data: Test paragraphs retain texts
tagged with <del> tags but the tags are dropped. Texts between <ins> tags are re-moved. However, all edits of the test data were provided to the teams after the final results were submitted.
3.1 Supplementary Data
To speed up data preparation for training, develop-ment and testing, the following suppledevelop-mentary data were accessible to all participants:
[image:3.612.315.539.258.466.2]– Tokenized sentences with sentence ID at the be-ginning of the line.
– POS tags of sentences with sentence ID at the beginning of the line.
– CFG trees of sentences with sentence ID at the beginning of the line.
– Dependency trees of sentences with sentence ID as the first line of each tree.
Texts from Wikipedia articles (the dump of April 2015):
– Tokens – POS tags
– CFG trees of sentences – Dependency trees of sentences
The data were processed with the Stanford parser with the following parameters:
– model: englishRNN – type: typedDependencies
– JAVA code for grammatical structure:
GrammaticalStructure gs = parser.getTLPParams().
getGrammaticalStructure(tree, Filters.acceptFilter(), parser.getTLPParams().
typedDependencyHeadFinder());
Shared Task participating teams were allowed to use other publicly available data with the exclusion of proprietary data. All additional data should in that case be specified in the final system reports. The participants were encouraged to share their supple-mentary data, where relevant.
4 Participants
By the time of data release, 18 groups were regis-tered for the task. The data required an agreement which allows its use under the Creative Commons CC-BY-NC-SA 4.0 license with a few extra restric-tions. The six groups that submitted results and pub-lished system reports are listed in Table 1, with par-ticipants spanning several continents.
A high-level summary of the approaches used by each team is provided in Table 5. The most com-mon methods were deep learning (HU and NTNU-YZU) and maximum entropy (Knowlet and UW-SU). The other teams used logistic regression and support vector machines. The deep learning mod-els used only tokens and word embeddings as their
features. NTNU-YZU represented sentences as a se-quence of word embeddings to train a convolutional neural network (CNN). HU had a more complex ap-proach, reporting the majority vote of a CNN using word embeddings and stacked character-based and word-based Long Short-Term Memory (LSTM) net-works.
Besides tokens and token n-grams, the most com-mon features were parse trees (ISWD and UW-SU). ISWD used tree representations of the sentences as features for a SVM and UW-SU augmented a gram-mar with a series of “mal-rules”, which license un-grammatical properties in sentences, and identified if the mal-rules occurred in the most likely sentence parses. HITS implemented 82 specific features for this task, including counts of word types, patterns found in words (such as contractions), and probabili-ties. Knowlet tested the efficacy of existing grammar tools for this task by train their model using features extracted from LanguageTool and After the Dead-line.
5 CodaLab.org
In this section we share our experience of using Co-daLab6for the AESW Shared Task. CodaLab is an open-source platform that provides an ecosystem for conducting computational research in a more effi-cient, reproducible, and collaborative manner. On
codalab.org, we usedCompetitionsto bring to-gether all participants of the AESW Shared Task and to automate the result submission process. Each par-ticipant had to register on thecodalab.org sys-tem and apply to the task in order to submit results and receive evaluation scores. We created four eval-uation phases to distinguish four evaleval-uation tasks:
– Development. Binary decision.
– Development. Probabilistic estimation. – Testing. Binary decision.
– Testing. Probabilistic estimation.
The training and development data were released on December 7, and the test data and CodaLab evalua-tion opened on February 29. The deadline for sub-mitting results was March 10.
Participants were allowed to submit results many times (up to 100 submissions per day), with no more
Development Testing Binary Probabilistic Binary Probabilistic
HITS 11 9 3 8
HU 7 0 6 0
ISWD 0 0 8 7
Knowlet 12 2 5 4
NTNU-YZU 22 20 238 68
UW-SU 1 2 2 1
#Failed 23 10 45 16
[image:5.612.163.449.55.180.2]#Total 76 43 307 104
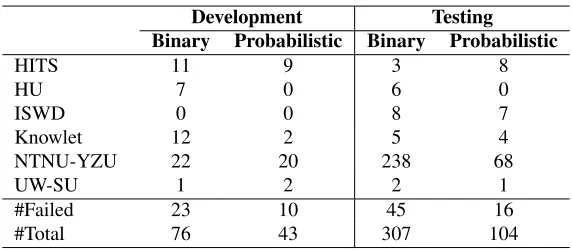
Table 4:The number of result submissions for each shared task phase onhttps://competitions.codalab.org.
than two results for their final submission in each track. Our experience shows that the time span for evaluation can take one minute to a few hours. Ta-ble 4 shows the number of successful submissions of each participant for each evaluation phase. The average number of submissions for each evaluation phase was six times except for one participant. In principle, the multiple unlimited number of submis-sions allows a team to tune their system based on performance against the test set as revealed by the automated scorer. The number of failed uploads is around ten percent. Therefore, our advice for future implementations of similar shared tasks is to limit the number of uploads to five times in the testing phase.
The system allows us to upload scorer programs and reference data to the server such that participants cannot see the reference data, which guarantees that the scorer program runs honestly. The scorer pro-gram was initially built using the Haskell propro-gram- program-ming language, but we could not manage to run the executable on the server despite the documen-tation describing such a possibility. Therefore, the scorer program was reimplemented in Python. The scorer program written in Python demonstrated un-expected behavior at the end of the testing phase: The codalab.org system did not report any er-rors if participants submitted a truncated list of dictions. One team uploaded a truncated list of pre-dictions that was accepted and scored. The scores were close to a random prediction score. After dou-ble checking all submitted results, we discovered that the system accepted results even if the list size of predictions was shorter than its expected size. This happened due to the implementation difference of the zip function in Haskell and in Python. In
Haskell, the length of both lists should be equal to apply the zip function, otherwise an error is thrown. In Python, the zip function merges two lists while a pair of values can be created, and does not throw an exception when the lists are of unequal lengths. One particular team was warned and an ad-ditional day was given for correcting their system and re-submitting their results. The lesson learned is that even if a scoring program produces an out-put score, double checking the final scores should be done manually.
6 Results
In this section, we describe the results of both tracks of the shared task.
First, we define the primary evaluation metric for both tracks, theF1score:
F1=2PP+·RR
For the Binary decision track, precision and recall are defined as
Pbool=TPTP+FP (1)
Rbool=TPTP+FN (2)
Team Acronym Algorithms Features Tools used Data used
HU CNN, RNN, LSTM Tokens Torch, word2vec AESW 2016, word2vec
HITS HMM,
Logistic Regression CFG trees, POS n-grams,token n-grams, hand-made features
scikit-learn, pyenchant AESW 2016,
American English dic-tionary, WordNet
ISWD SVM,
SubSet Tree kernel Constituent tree SVM-Light, SST AESW 2016
Knowlet MaxEnt AtD.rule, AtD.string,
LT.rule, LT.string, Token.root n-grams, Token.category n-grams
GATE,
After the Deadline (AtD), LanguageTool (LT)
AESW 2016
NTNU-YZU CNN Tokens,
Bag Of Words Theano, word2vec AESW 2016,word2vec, GloVe
UW-SU MaxEnt Parse trees, mal-rules DELPH-IN, ERG,
[image:6.612.148.467.280.393.2]ACE parser AESW 2016
Table 5:The summary of AESW 2016 Shared Task participant systems.
Team Precision Recall F-Score Correlation Kappa Mean rank
HU 0.5444 0.7413 0.6278 (1) 0.3760 (1) 0.3628 (1) 1 NTNU-YZU 0.5025 0.7785 0.6108 (2) 0.3324 (2) 0.3070 (2) 2 ISWD 0.4482 0.7279 0.5548 (3) 0.2168 (5) 0.1957 (5) 4.33 UW-SU 0.4145 0.8201 0.5507 (4) 0.1770 (6) 0.1373 (6) 5.33 HITS 0.3765 0.9480 0.5389 (5) 0.1037 (7) 0.0469 (8) 6.67 ISWD† 0.3960 0.6970 0.5051 (6) 0.0971 (8) 0.0835 (7) 7
NTNU-YZU† 0.6717 0.3805 0.4858 (7) 0.3282 (3) 0.3043 (3) 4.33
Knowlet 0.6241 0.3685 0.4634 (8) 0.2854 (4) 0.2672 (4) 5.33 baseline 0.3607 0.6004 0.4507 (9) 0.0001 (9) 0.0001 (9) 9
Table 6:Binary prediction results.
For the Probabilistic estimation track, rankings are calculated based on F1 score using the mean
squared error (MSE):
Pprob=1−n1 X
i
(πi−Gi)2 πi>0.5
Rprob=1−m1 X
i
(πi−Gi)2 Gi∈improve
For a sentencei,Gi = 1if the sentence needs
im-provement in the gold standard, otherwiseGi = 0.
πi is the probabilistic estimate that the sentence
needs improvement, n is the number of sentences predicted to need improvement (πi >0.5), andmis
the number of sentences that actually need improve-ment. We also calculated the cross-entropy between the predictions and gold standards, defined as
H =−X
i
Gilogπi
Finally, we represented each probability with its corresponding boolean value (y0
i = True if πi > 0.5else y0
i =False) and calculated the binary-task
F-score (with precision and recall calculated as in Equations 1 and 2), the correlation, and agreement statistic.
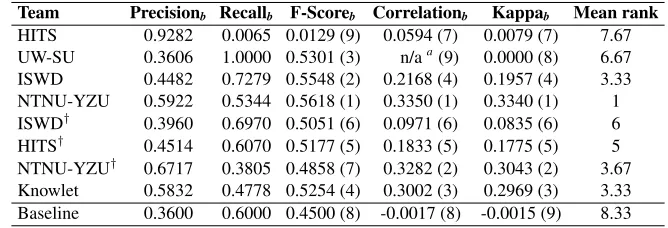
The results of the Binary decision task are shown in Table 6. The results for the Probabilistic estima-tion task are provided in Table 7 and the analysis over the corresponding boolean values is shown in Table 8. When a team submitted more than one set of results, we identify the two submissions as TEAM and TEAM†.
7 Discussion
[image:6.612.87.284.473.525.2]sys-Team Precision Recall F-Score Correlation Cross-entropy Average STD Dev Mean rank
HITS 0.9333 0.7491 0.8311 (1) 0.0600 (8) 35,992 (5) 0.4986 0.0255 4.67 UW-SU 0.7118 0.8748 0.7849 (2) 0.2471 (5) 22,162 (1) 0.6276 0.0973 2.67 ISWD 0.7062 0.8182 0.7581 (3) 0.2690 (4) 28,385 (2) 0.5444 0.1941 3 NTNU-YZU 0.7678 0.7177 0.7419 (4) 0.4043 (2) 40,716 (6) 0.3948 0.2264 4 ISWD† 0.6576 0.8014 0.7224 (5) 0.1298 (7) 32,979 (4) 0.5743 0.2225 5.33
HITS† 0.6655 0.7889 0.7220 (6) 0.1666 (6) 30,238 (3) 0.5441 0.2031 5
NTNU-YZU† 0.7900 0.6166 0.6926 (7) 0.4173 (1) 54,903 (9) 0.3033 0.2280 5.67
Knowlet 0.7294 0.6591 0.6925 (8) 0.3516 (3) 50,370 (8) 0.3709 0.2942 6.33 Baseline 0.5963 0.7163 0.6508 (9) -0.0028 (9) 44,843 (7) 0.5511 0.2845 8.33
[image:7.612.137.471.209.323.2]Gold standard 0.3606 0.4802
Table 7:Probabilistic estimation results.
Team Precisionb Recallb F-Scoreb Correlationb Kappab Mean rank
HITS 0.9282 0.0065 0.0129 (9) 0.0594 (7) 0.0079 (7) 7.67 UW-SU 0.3606 1.0000 0.5301 (3) n/aa(9) 0.0000 (8) 6.67 ISWD 0.4482 0.7279 0.5548 (2) 0.2168 (4) 0.1957 (4) 3.33 NTNU-YZU 0.5922 0.5344 0.5618 (1) 0.3350 (1) 0.3340 (1) 1 ISWD† 0.3960 0.6970 0.5051 (6) 0.0971 (6) 0.0835 (6) 6
HITS† 0.4514 0.6070 0.5177 (5) 0.1833 (5) 0.1775 (5) 5
NTNU-YZU† 0.6717 0.3805 0.4858 (7) 0.3282 (2) 0.3043 (2) 3.67
Knowlet 0.5832 0.4778 0.5254 (4) 0.3002 (3) 0.2969 (3) 3.33 Baseline 0.3600 0.6000 0.4500 (8) -0.0017 (8) -0.0015 (9) 8.33
Table 8:Probabilistic estimation results, using the corresponding boolean value. aUW-SU reported all probabilitiesπ
i>0.5, and thereforeσπ= 0andris undefined.
tem is NTNU-YZU, which trained a CNN model. Both of these models used word2vec word embed-dings, with NTNU-YZU testing both word2vec and GloVe. The bottom two teams according to the F-score, NTNU-YZU† and Knowlet, have the third and fourth strongest agreement with the gold stan-dard, respectively. Compared to the other submis-sions, these systems have the highest precision of 0.6717 and 0.6241, respectively, with the precision of the other systems ranging from 0.38 to 0.54. They also had the lowest recall (0.3805 and 0.3685) com-pared to the other teams, with recall between 0.70– 0.95. This suggests the importance of precision in this task.
For the Probabilistic estimation track, HITS had the highest precision (0.9333) and F-score (0.8311) (Table 7). The other teams all had precision >= 0.66 and recall >= 0.62. However, the rankings found by the F-score and the correlation diverge sig-nificantly for three systems: HITS, NTNU-YZU†, and Knowlet. While HITS has the highest F-score, it also has the weakest correlation with the gold standard. NTNU-YZU†and Knowlet have the low-est F-score but the first and third stronglow-est
corre-lation, respectively. The ranking by cross-entropy is similar to the F-score ranking with the exception of HITS, which has the fifth highest cross-entropy. To address this disparity, we calculated additional rankings of the systems by converting the output probabilities into the corresponding boolean value (True ifπi > 0.5, and False otherwise) and
report-ing the values of the same metrics we used to eval-uate the Binary prediction task (Table 8). These statistics are indicated with a subscript b. In this analysis, the ranking of HITS declines significantly from the original Probabilistic evaluation, with the lowest F-scoreb of all systems. The precisionb of HITS is nearly perfect (0.9282) but recallb is al-most 0 (0.0129), which explains why the F-scoreb, Correlationb, and Kappab statistics are all so low. Knowlet improves to the fourth-ranked system by F-scorebfrom the last. By the correlation and agree-ment statistics, NTNU-YZU and NTNU-YZU† are the best two systems in the converted probabilities analysis.
description, but there is evidence that the evalua-tion could be improved in future tasks. UW-SU and HITS pointed out that favoring recall over preci-sion improves their F-score, which increases the sys-tem’s ranking but decreases its accuracy. Precision has been shown to be more effective when providing feedback on grammatical errors, with less, accurate feedback better than inaccurate feedback (Nagata and Nakatani, 2010). For future shared tasks, ad-ditional evaluation methods should be investigated, includingF0.5, which weights precision more than
recall, and a comparison to human evaluation, such as is done by the Workshop on Machine Translation (Bojar et al., 2015).
7.1 The trends of system predictions
The initial impetus to organize this competition was to gain insight into the specifics of scientific writing asa genreand, with the help of participants, to make an estimation of whether it is possible to offer any robust automatic solutions to support researchers with non-native English background in writing sci-entific reports. There are several facts and their im-plications to be considered:
– The first fact deals with formal requirements of the genre. Scientific writing has very clear – and to a certain extent limited – aims, namely to in-form other researchers in the field of the latest findings or important issues, usually presented in the form of articles, reports, grant proposals, the-ses, etc. Each of these follow roughly the same structure comprising more or less obligatory parts (e.g. abstract, data, method). The intended audi-ence – i.e. other researchers – should be famil-iar with the standard to be able to skim for ma-jor findings and conclusions in the document, not wasting time on irrelevant parts. Scientific lan-guage is therefore rather rigid to fit this need. – Another fact we need to consider is that most
of the scientific writing is done by mature users of English, who in most cases do not make second-language-learner types of mistakes, at least not frequently. This fact is reflected in the type of edits in our data: they are cor-rections, mostly reflecting linguistic conventions of the genre. Correct use of punctuation, hy-phenation, digits, capitalization, abbreviations,
and domain-appropriate lexical choices are the type of corrections that dominate profession-ally proofread scientific papers, and are unique to scientific writing. Among more classical second-language type of errors, we can see verb (dis)agreement; (in)appropriate use of ar-ticles, prepositions and plurals, (mis)spellings, (in)correct choice of word, etc. However, these traditional error types are much less represented in scientific writing.
To see how successfully our task participants have coped with the challenges of scientific writing, we have analyzed main trends concerning which error types were detected by all algorithms (successfully detected as ‘need improvement’ by all systems) ver-sus which none were able to capture (i.e. sentences that were annotated as ‘need improvement’ but no one could detect these sentences).
There are four cases presented in Table 9:
Prediction of
all systems CorrectionGold annotation Total needed Correct
Correction needed 7,899 2,663 10,563
Correct 32 1,201 1,234
Table 9:Agreement between gold annotations and all systems on test data, in number of sentences
We can observe 7,899 cases of successful agree-ment between the proofreaders and all the teams about sentences that need correction. Most cases of article misuse, punctuation infelicities, diverting capitalization, unconventional usage of digits, ab-breviations and hyphenation were detected by all teams, including sentences where lexical choices were not optimal, e.g.:
– For computations we chose _MATH_ and a spectral interval in the vicinity of the resonance frequency of the mode with radial number _MATH_, _MATH_.
– Provided _MATH_ has no zero in its initial data, the log-logarithmic singularity at _MATH_ causes the left -hand side to blow up at _MATH_, thereby forcing _MATH_ as _MATH_.
– SimilarSimilarly to the previous case, we have a line of fixed points with positive slope _MATH_ in (_MATH_, _MATH_) plane as shown in Figure 2. In 32 cases all the teams have unanimously dis-agreed with the gold standard on the need of cor-rection. These cases cover
– context deficit, where on the sentence level it is impossible to identify the correct need of an arti-cle or an adverb, e.g.:
– Next, we give thea stability analysis. – The algorithm then terminates.
– alternative lexical choices, in particular more for-mal variants or special terminological usages, e.g. notice versus note, fitted parameter versus fit parameter;
– a number of notoriousmatters of opinion, such as replacing this paper for the paper and vice versa, e.g.:
– TheThis paper is organized as follows. – Section 5 concludes thisthe paper.
– First, we derive the following: _MATHDISP_. – style/tense requirements of the genre, e.g. using
present tense referring to the results in tables: – The results wereare presented in Figure
_REF_.
– use of punctuation in the following cases: – Namely, we observe the following.: – Example:.
– stylistic preferences:
– Since _MATH_ and _MATH_, we can easily get _MATH_.
– This error is only limited by the instrument resolution of the instrument.
It can be argued that in most of those 32 cases corrections are optional.
One conclusion that can be drawn from this task performance analysis is that scientific writing as a genre needs standardization. We have encountered several types of inconsistencies in the data, for ex-ample in the case of hyphenation (nonlinear for non-linear; and vice versa); or in the case of expres-sions like this paper for the paper and vice versa. Even though it seems that the area could benefit from standardization, we are well aware that lan-guage can never be fully standardized. At most,
there are only and can only be guidelines or con-sensus on what good language should look like.
Another conclusion is that automatic detection of scientific prose errors as an area of research would benefit from error-type annotation. More rigorous analysis of the data in terms of the type of corrected deviations could give us a better insight into what the genre of scientific writing is and facilitate more error-aware approaches to automatic proofreading of scientific papers.
Yet another conclusion is that stepping outside of a sentence boundary may facilitate recognition of a number of other error types that at the moment go unnoticed due to context deficit, among others in-consistent use of abbreviations, certain cases of arti-cle usage, and lacking adverbs, just to name a few.
8 Conclusions
In this work we have reported and described the re-sults of the AESW Shared Task (Automatic Eval-uation of Scientific Writing), which focuses on the problem of identifying sentences in scientific works that require editing. The main motivation of this task is to promote the use of NLP tools to help non-native writers of English to improve the quality of their sci-entific writing. From the research perspective, on the other hand, this effort aims at promoting a common framework and standard data set for developing and testing automatic evaluation systems for the scien-tific writing domain.
From a total of 18 groups registered for the shared task, six of them submitted results and pub-lished reports describing their implemented sys-tems. As a consequence, different machine learn-ing paradigms (includlearn-ing neural networks, support vector machines, maximum entropy, and logistic re-gression) have been tested over the two proposed evaluation modalities (binary and probabilistic esti-mation). The shared task has helped establish a ref-erence for the state-of-the-art in the automatic eval-uation of scientific writing, in which the obtained results demonstrate that there is still room for im-provement. The availability of both the data set and the evaluation tools will facilitate the path for future research work in this area.
different system combination strategies. Addition-ally, as suggested by the observed ranking inconsis-tencies across the different evaluation metrics in the probabilistic estimation task, we also need to con-duct further analysis and take a more detailed look at these results to determine the best evaluation scheme to be used for this modality.
Acknowledgments
We thank Joel Tetreault for his great support and the other BEA Workshop organizers for including the AESW Shared Task in the BEA11 Workshop. We also appreciate the teams for participating in this new shared task and providing us with helpful feed-back. We acknowledge Springer Publishing Com-pany for the permission to publish text extracts that made the AESW Shared Task feasible. This material is based upon work partially supported by the Na-tional Science Foundation Graduate Research Fel-lowship under Grant No. 1232825.
References
Ondˇrej Bojar, Rajen Chatterjee, Christian Federmann, Barry Haddow, Matthias Huck, Chris Hokamp, Philipp Koehn, Varvara Logacheva, Christof Monz, Matteo Negri, Matt Post, Carolina Scarton, Lucia Specia, and Marco Turchi. 2015. Findings of the 2015 workshop
on statistical machine translation. InProceedings of
the Tenth Workshop on Statistical Machine
Transla-tion, pages 1–46, Lisbon, Portugal, September.
Asso-ciation for Computational Linguistics.
Daniel Dahlmeier, Hwee Tou Ng, and Siew Mei Wu. 2013. Building a Large Annotated Corpus of Learner
English: The NUS Corpus of Learner English. In
Pro-ceedings of the Eighth Workshop on Innovative Use of NLP for Building Educational Applications, pages 22– 31.
Robert Dale and Adam Kilgarriff. 2011. Helping Our
Own: The HOO 2011 pilot shared task. In
Proceed-ings of the 13th European Workshop on Natural Lan-guage Generation, pages 242–249.
R Dale, I Anisimoff, and G Narroway. 2012. A report on the preposition and determiner error correction shared
task. InProceedings of the NAACL Workshop on
In-novative Use of NLP for Building Educational Appli-cations.
Vidas Daudaravicius. 2015. Automated Evaluation of
Scientific Writing Data Set (Version 1.2) [Data file]. VTeX, Vilnius, Lithuania.
Claudia Leacock, Martin Chodorow, Michael Gamon, and Joel Tetreault. 2010. Automated grammatical
er-ror detection for language learners. Synthesis lectures
on human language technologies, 3(1):1–134. Ryo Nagata and Kazuhide Nakatani. 2010. Evaluating
performance of grammatical error detection to
max-imize learning effect. In Proceedings of the 23rd
International Conference on Computational Linguis-tics: Posters, pages 894–900. Association for Compu-tational Linguistics.
Hwee Tou Ng, Siew Mei Wu, Christian Hadiwinoto, and Joel Tetreault. 2013. The CoNLL-2013 Shared Task
on Grammatical Error Correction. InProceedings of
the Seventeenth Conference on Computational Natural Language Learning: Shared Task, pages 1–12. Hwee Tou Ng, Siew Mei Wu, Ted Briscoe, Christian
Hadiwinoto, Raymond Hendy Susanto, and Christo-pher Bryant. 2014. The CoNLL-2014 Shared Task
on Grammatical Error Correction. InCoNLL Shared
Task, pages 1–14.
David J Pierson. 2004. The top 10 reasons why
manuscripts are not accepted for publication.
Respi-ratory care, 49(10):1246–1252.
Helen Yannakoudakis, Ted Briscoe, and Ben Medlock. 2011. A new dataset and method for automatically
grading ESOL texts. InProceedings of the 49th
An-nual Meeting of the Association for Computational Linguistics: Human Language Technologies-Volume
1, pages 180–189. Association for Computational