Original Article
Efficacy of predictive holistic indicator
for prevention of damage to visual health
Edgar O López-De-León¹, José A Morales-González¹, Eduardo Madrigal-Santillán¹, Eduardo
Madrigal-Bujaidar2, Isela Álvarez-González2, María Teresa Sumaya-Martínez3, Carmen Valadez-Vega4, Tomás Fregoso-Aguilar5, Judith Margarita Tirado-Lule6, Ángel Morales-González6
1Laboratorio de Medicina de Conservación, Escuela Superior de Medicina, Instituto Politécnico Nacional, México; 2Escuela Nacional de Ciencias Biológicas, Instituto Politécnico Nacional, México; 3Secretaria de Investigación
y Estudios de Posgrado, Universidad Autónoma de Nayarit, Ciudad de la Cultura Amado Nervo, Tepic, Nayarit, México; 4Instituto de Ciencias de la Salud. Universidad Autónoma del Estado de Hidalgo, Hidalgo, México; 5Depto.
de Fisiología, Laboratorio de Hormonas y Conducta, ENCB campus Zacatenco, Instituto Politécnico Nacional, México; 6Escuela Superior de Cómputo, Instituto Politécnico Nacional, México
Received March 16, 2017; Accepted June 14, 2017; Epub August 15, 2017; Published August 30, 2017
Abstract: Throughout the years, more factors have been added to the visual affectation, with environmental, eco-nomic, and cultural factors considering the principle ones. Therefore, the importance of this study, with a sys-temic focus, is to apply a predictive holistic indicator based on the factor that affect visual health in patients of the Optometry Clinic, Interdisciplinary Health Sciences Center (CICS), Santo Tomás Unit (UST), of the Instituto Politécnico Nacional (IPN), México, with a universe of 50 patients who attended a first evaluation at which tests were carried out of visual acuity, Schirmer II test, and biomicroscopy; also, we gathered information through the application of a questionnaire designed to generate the prediction of the visual-health factor of each factor. From the latter, we obtained a holistic index of 50.90% as visual-health prognosis, which fell within a range of fair; later, at 6 months, we performed a second optometric evaluation to find the relationship between the number of patients categorized in each of the visual-health indicators and by gender during the first and second clinical evaluation, finally, we car -ried out the statistical significance test by means of a p value [p1-p2] in terms of Zα-0.05, in which we found, in both genders and in the different visual indicators, a lesser p value with respect to Zα-0.05. This indicates that there was no statistical significance; thus, we can conclude that the predictive holistic indicator is functionally given that its prognosis was fulfilled.
Keywords: Predictive holistic indicator, factors, visual health
Introduction
An indicator is a value that permits to know the magnitude or size of something in relation to a whole. Through a percentage-form holistic indi-cator, a prognosis of visual health can be per-formed based on the affectation of the factors-to-evaluate. This is carried out by means of a mathematical model that results from multipli-cation of each of the individual indicators of each factor. Thus, this is categorized according to the holistic indicator and aids in predicting the behavior of the visual state [1].
In data reported by the Mexican National Institute of Statistics and Geography (INEGI) in 2010, of the 112,336,538 inhabitants of the Mexican Republic, 43.24% of the population,
that is, 48,575,560 required optometric ser-vices in Mexico [2]. In worldwide terms, uncor-rected refraction errors (myopia, hypermetropy, astigmatism, and presbyopia) constitute the most important cause of visual disability; for this reason, this population would have a visual improvement with the use of eyeglasses [2]. Due to the latter, in 2003 the World Health Organization (WHO) requested from each coun-try a proposal to avoid blindness that was denominated 20/20 Vision; thus, on March 4, 2005, Mexico created Nacional Council for the Prevention and Treatment of Visual Diseases [3].
eye-glasses, as well as biomicroscopy with the slit lamp, which evaluates the absence or presence of some ocular pathology, and to conducted the
[image:2.612.90.289.96.175.2]Schirmer II test that, with the aid of filters, quantifies the amount of lachrymal secretion
[4, 5].
There is evidence concerning that persons who utilize computers for >3 h daily are unaware of the damage implied for human health by their excessive use. Little by little, these individuals begin to detect symptoms in their organism; there is an estimate that between 50 and 90% of the users of visual devices suffer from ocular fatigue, red eyes, irritated eyes, dry eyes, eyelid tension and heaviness, tearing, a burning
sen-sation, blurry vision, and difficulty in focusing
on objects at a distance [6-8].
The cornea and conjunctiva are the anterior lay-ers of the ocular globe, which is charged with the absorption of UltraViolet (UV) radiation. Excessive exposure to solar light can be a risk factor for ocular diseases and the reduction visual performance. Thus, UV radiation plays an important role in the pathogenesis of some pathologies of the eye. This implies a complete process of cellular death, matrix remodelling,
Oxidative Stress (OS), and inflammation [9, 10].
Studies indicate that a daily exposure of 5 h within a minimal lapse of 5 years predisposes to the appearance of pinguecula and subse-quently pterygium [11].
The investigation carried out in 2015 by OXFAM México (Oxford Committee for Famine Relief) published, within the framework of the lancing of the “IGUALES” Campaign, evidence of the importance of combating economic inequality, in that more than one half of Mexicans (54.4% of the population) remain under poverty condi-tions, i.e., >55 million persons. Poor distribu-tion of economic resources has limited the eco-nomic growth of the country and has plunged it into a vicious circle of poverty [12, 13].
Institutions such as the CICS UST of the IPN and its Optometry Clinic recommend the carry-ing out of the visual examination every 6 months or annually, according to the case. Also, the Specialist in Ophthalmology and Retina Services, Dr. Bueno-García recommends pre-senting for clinical evaluation with this same regularity due to that with the passage of time, more factors are added to the damage of vision [14, 15].
The objective of this work was to apply the pre-dictive holistic indicator of visual health in the population attending the CICS UST Optometry Clinic. The predictive holistic indicator was pre-viously validated in an article of investigation in the year 2016 [1].
Methodology
The study was carried out at the Optometry Clinic of the CICS UST of the IPN. The study was evaluated and approved by the Research Committee and by the Ethics Committee of the Escuela Superior de Medicina (ESM-IPN) with approval numbers CI-01/17-12-2015 and CE-01/16-12-2015, respectively.
Sample size and general procedure
A sample size of 50 patients complying with the following inclusion criteria: indistinct gender and age between 20 and 40 years, and the fol-lowing exclusion criteria: patient with autoim-mune disease; pregnant patient, and patient with some chronic, non-transmissible disease. On complying with the inclusion and exclusion criteria, the patient was submitted to a series of steps to obtain the prediction of the visual
state based on the classifier of the holistic indi -cator. Two visual evaluations were performed: optometric tests, and data were gathered by means of a questionnaire to generate the pre-diction of the patient’s visual health. Six months later, a second evaluation of the optometric tests was conducted to prove whether the pre-diction of the holistic indicator complied with
the first results.
Obtaining the holistic indicator
First, we applied a questionnaire to patients of the CICS UST. From this questionnaire, we obtained the individual data of the four factors (technological, environmental, economic, and cultural), as previously reported [1]. On the Table 1. Percentage of affection according to
the individual indicators of each factor Factor Percentage of affection individual indicatorPercentage of
Tecnological 22% 78%
Enviromental 2% 98%
Economic 10% 90%
other hand, with these data we applied the holistic model indicator of visual-health affec-tations with the percentage values of each indi-vidual indicator described in Table 1 [1], utiliz-ing the followutiliz-ing mathematical holistic-indica-tor model of visual health conditions:
(Technological F. %) × (Environmental F. %) × (Economic F. %) × (Cultural F. %) = Holistic indicator
Last, we classified the visual-health state as
revealed in Table 2 [1].
Evaluation of visual health through optometric tests
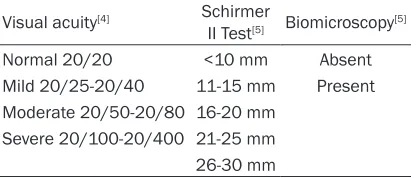
Optometric tests were performed to evaluate visual health by means of the following three tests: visual acuity; the Schirmer III test, and biomicroscopy. Next, we described these brief-ly: Visual acuity was determined according to the technique reported by Hernández-Luna [4], which consists of measuring visual acuity at a distance both molecularly and binocularly, in order to make the conversion at 6 meters and
to categorize this according to the classification
depicted in Table 3.
Lachrymal secretion through the Schirmer II test according to Kanski [5] consisted of admin-istering the patient with an ophthalmic
anes-thetic and placing a filter paper over both eyes and, according to the value, this is classified in
agreement with Table 3.
Last, according to that reported by Kanski [5], the presence or absence of pinguecula was determined by means of the biomicroscopy test, which is supported by a slit lamp in order to be able to observe the anterior part of the eye.
Statistical analysis
As the statistical test, we applied the p value, in
which statistical significance is considered in the following manner: if [first evaluation (p1 )-second evaluation (p2)] is greater than the product of 1.96 (Zα-0.05) multiplied by the Stan- dard Error (SE), it was concluded that the
differ-ence is significant [16, 17]. The statistical tests
work as follows: the magnitude of the differ-ence between the group to be compared for
each test (first evaluation (p1) -second
evalua-tion (p2)) is checked; where:
p1 = First evaluation/No. patients;
p2 = Second evaluation/No. patients; p = [p1 + p2]/2;
The standard error is calculated as follows:
√p (1-p) (1/n1 + 1/n2);
Standard error multiplied by Zα-0.05.
Results
On applying the holistic indicator model, that is, multiplying the percentage values of the indi-vidual indicator for each factor in Table 1, we obtained a percentage of 50.90% that,
accord-ing to the holistic indicator classifier of Table 2,
classifies visual health as at a fair state. The
latter indicates the presence of the affectation of the factors evaluated due to direct exposure to visual devices, the UV factor, medium or low economic income, and the lack of preventive culture in their visual-health sector.
According to the first- and second-clinical-eval
-uation visual acuity test, in their statistical sig-Table 2. Classifier holistic indicator
Factor range Share of
100% to ≥90% Excellent. The values do not produce alteration.
≥80% to <90% Good. They are good values but have little affection.
≥65% to <80% Acceptable. The values are acceptable but the condition is significant.
≥50% to <65% Regular. The levels refer to damage present in the visual health from exposure to the factor.
[image:3.612.92.523.84.166.2]Factor <50% Unacceptable. The condition for exposure or factors is present and can be further developed.
Table 3. Indicators of visual health Visual acuity[4] Schirmer
II Test[5] Biomicroscopy[5]
Normal 20/20 <10 mm Absent Mild 20/25-20/40 11-15 mm Present Moderate 20/50-20/80 16-20 mm
Severe 20/100-20/400 21-25 mm 26-30 mm
[image:3.612.91.299.201.290.2]nificance and classification based on the holis -tic indicator in Table 4, we found that, in femi-nine gender in the unacceptable range, was 16
patients in the first evaluation vs. 18 patients
of the second evaluation, that is, in this test
there were no significant changes. This was due
to that in statistical test with respect to the p
value in the unacceptable range was -0.0571 and multiplication of (Zα-0.05), which for the SE was 0.2342. On the other hand, in masculine gender, the result in the unacceptable range in
the first evaluation was five patients vs. six
patients in the second evaluation, while in the statistical test, there was a p value of -0.0667 and multiplication of (Zα-0.05) by the SE was 0.3449. These results can be due to that pati- ents continued with the same habits.
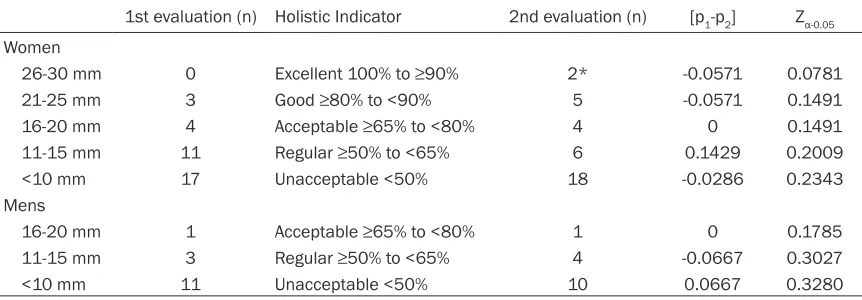
On the other hand, among the first- and second
clinical-evaluation results of the Schirmer II
test, their statistical significance and classifica -tion based on the Table 5 holistic indicator was
obtained, finding that the number of patients
among women within the unacceptable range
in the first evaluation was 17 patients vs. 18
patients of the second evaluation. In this test,
there is no statistical significance due to that
regarding the p value within this range, this was -0.0286 and multiplication of (Zα-0.05) by means of the SE was 0.2343. Similarly, in the range considered excellent, there was an increase of two patients. These favorable data in lachrymal production can be due to the patients’ change of habits, that is, a lesser exposure to the visual devices. With regard to the masculine gender,
the result in the unacceptable range in the first
evaluation was 11 patients vs. 10 patients in the second evaluation, while the statistical test there was a p value of 0.0667 and multiplica-tion of (Zα-0.05) by the SE was 0.3280, without
statistical significance.
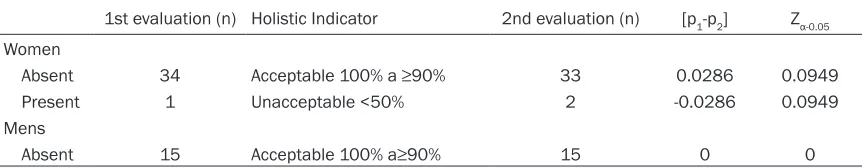
Last, the results of the biomicroscopy test of
the first and second clinical evaluation, its sta
-Table 4. Comparison of visual acuity of the first and second clinical assessment and its significance
1st evaluation (n) Holistic Indicator 2nd evaluation (n) [p1-p2] Zα-0.05
Women
Normal 20/20 5 Excellent 100% to ≥90% 4 0.0286 0.1568
Mild 20/25-20/40 7 Acceptable ≥65% to <80% 7 0 0.1874
Moderate 20/50-20/80 7 Regular ≥50% to <65% 6 0.0286 0.1822 Severe 20/100-20/400 16 Unacceptable <50% 18 -0.0571 0.2342 Mens
Normal 20/20 1 Excellent 100% to ≥90% 1 0 0.1785
Mild 20/25-20/40 5 Acceptable ≥65% to <80% 5 0 0.3374
[image:4.612.90.522.84.234.2]Moderate 20/50-20/80 4 Regular ≥50% to <65% 3 0.0667 0.3027 Severe 20/100-20/400 5 Unacceptable <50% 6 -0.0667 0.3449
Table 5. Comparison of the schirmer II test of the first and second clinical evaluation and its signifi -cance
1st evaluation (n) Holistic Indicator 2nd evaluation (n) [p1-p2] Zα-0.05 Women
26-30 mm 0 Excellent 100% to ≥90% 2* -0.0571 0.0781
21-25 mm 3 Good ≥80% to <90% 5 -0.0571 0.1491
16-20 mm 4 Acceptable ≥65% to <80% 4 0 0.1491
11-15 mm 11 Regular ≥50% to <65% 6 0.1429 0.2009
<10 mm 17 Unacceptable <50% 18 -0.0286 0.2343
Mens
16-20 mm 1 Acceptable ≥65% to <80% 1 0 0.1785
11-15 mm 3 Regular ≥50% to <65% 4 -0.0667 0.3027
<10 mm 11 Unacceptable <50% 10 0.0667 0.3280
[image:4.612.91.522.281.431.2]tistical significance, and its classification
bas-ed on the holistic indicator in Table 6 in femi-nine gender within the unacceptable indicator
range in the first evaluation was one patient vs.
two patients of the second clinical evaluation, with a p value of -0.0286 and multiplication of
(Zα-0.05) by the SE was 0.0949. On the other
hand, no change presented in masculine gen-der, that is, the 15 patients found within the
acceptable range in the first clinical evaluation
are the same patients during the second
evalu-ation. That is, no statistical significance was
found in this test. Discussion
In 2011, Hoffelt and collaborators evaluated the risk factors for suffering from glaucoma, such as age, ethnicity, gender, familial history of glaucoma, and familial history of diabetes. By means of a telephone interview, we ga- thered the patients’ demographic, medical, and socioeconomic information; later, for can-didates with a posible risk for having glaucoma, they were referred to an Ophthalmologist for a vision examination, during which we applied to them a questionnaire form, with a value of 1-10 for responses; with a total score of 4 or more
(≥4), a high risk is considered for glaucoma, an
already established prevalence scale that aids in obtaining an average score, thus establish-ing whether the patient is at risk for havestablish-ing
glaucoma. The Ophthalmologist fills out a blank
evolution form that indicates whether the patient had regular visual examinations, with the results of the visual evaluation determining the factors associated with glaucoma [18]. On the other hand, Sandín in 2003 presented an analysis on the current concepts of stress,
focusing on social factors, defining in detail
three different stressors as follows: life hap-penings (recent stress); role stress (chronic stress), and daily annoyances (daily stress); the
author mentioned that these social stressors individually cause a degree of stress, but he also refers that they act in an interrelational
manner, in that they mutually can be influenced
by, for example, life happenings that leads one to chronic stress of viceversa. Sandín carried out this analysis through theoretical works and critically evaluated each of the stressors that present in the daily life of humans, concluding that these factors independently cause distur-bances in health associated with stress give rise to damage, due to the interrelationship that exist among these factors [19].
Likewise, in 2011, Patiño Villada and cowork-ers conducted a study in which the authors evaluated the prevalence of cardiovascular risk factors in a Colombian population through the application of an especially designed question-naire, in addition to carrying out tests to mea-sure blood cholesterol, triglycerides, glucose, and High- (HDL) and Low-density (LDL) lipopro-teins, The authors took measurements of blo- od pressure, abdominal circumference, height, and weight. On performing their methodology and statistical analysis, they reported that the greatest factors for vascular risk were low phys-ical activity, central obesity, dyslipidemias, smoking, metabolic syndrome, and obesity re- lated with Body Mass Index (BMI), given that they are related with the questionnaire respons-es that evaluate the factors and the rrespons-esults of the clinical tests [20].
[image:5.612.91.522.97.181.2]Therefore, the previous works, as well as this work, focus on the interrelationship of the fac-tors, due to that the authors coincide on that each element causes independent damage. But, on relating these among themselves, they cause a greater magnitude of the same. Thus, the difference among this investigation and the previous researches is that the present one is based on the General Systems Theory (GST), which offers a better result due to that all of the Table 6. Comparison of the biomicroscopy of the first and second clinical evaluation and its signifi -cance
1st evaluation (n) Holistic Indicator 2nd evaluation (n) [p1-p2] Zα-0.05 Women
Absent 34 Acceptable 100% a ≥90% 33 0.0286 0.0949
Present 1 Unacceptable <50% 2 -0.0286 0.0949
Mens
parts are studied that interrelate among them-selves and that they comprise a whole. In the same manner, the proposal of this work was to evaluate the technological, environmental, eco-nomic, and cultural factors in holistic way, this proposal integrating each of these and study-ing them as a whole, that is, the damage of
each factor is considered accumulatively, find
-ing the interrelationship between each of the
factors evaluated, in that they directly influence
the visual health of the patients seen at the CICS UST of the IPN, through the association among the optometric tests, this relation as the ocular symptomatology and changes in visual acuity (Table 4). On the other hand, UV exposure of >5 h favors the presence of some pathology of the ocular conjunctiva [11], a fac-tor in which we also found a small increase in the visual affectation during the second evalu-ation in women (Table 6). We also found certain dependence between economic and cultural factors, in that if there is not a good economic income, patients do not attend their visual appointments regularly. This can generate the patients’ presenting diminution of visual acuity, increases in the graduation of their prescribed eyeglasses, and the appearance of ocular pathologies in the short and long term (Tables 4 and 6).
Finally, on observing that the p values in the dif-ferent categories of visual acuity, the Schirmer
II test, and biomicroscopy were <Zα-0.05, no
sig-nificant statistical difference was found, this
denoting that the indicator fulfilled its progno
-sis in each of the visual-health indicators. Therefore, we are able to conclude that the functionality of the holistic indicator is well-aimed, because the visual-health prognoses in each of the qualifying ranges of each indicator were maintained. This can have been due to that, given that during the second clinical evalu-ation the habits of each of the patients were
not modified, that is, modifications were not
indicated to the patients in terms of the expo-sure time to the technological and environmen-tal factors, nor was the frequency indicated to them of when they should go for a visual-exam-ination appointment. On the other hand, the study could be proposed to be carried out at between 9 and 12 months to observe whether during this time lapse some change was obtained in the proposed holistic indicator, or whether one was able to observe solely by means of the change in the population’s habits.
Acknowledgements
Supported by SIP Project, No. 20171315 ESCOM-IPN and No. 20170786 ESM-IPN. Disclosure of conflict of interest
None.
Address correspondence to: Dr. Ángel Morales-González, Escuela Superior de Cómputo, Instituto Politécnico Nacional, Av. Juan de Dios Bátiz s/n esquina Miguel Othón de Mendizabal, Unidad Profesional Adolfo López Mateos, Ciudad de México 07738, México. Tel: +52 57296000 Ext. 52041; E-mail: [email protected]; Dr. José A Morales-González, Escuela Superior de Medicina, Instituto Politécnico Nacional, México. Tel: +52 57296000 Ext. 62753; E-mail: [email protected]
References
[1] López-De-León EO, Morales-González JA, Ra-mos-Perez S, Madrigal-Santillan EO, Pérez-Pasten R, Fregoso-Aguilar T and Morales-González A. Holistic indicator model for predicting factors that generate visual health affections. Int J Clin Exp Med 2016; 11: 22004-22011.
[2] INEGI 2016, Instituto Nacional de Estadísticas y Geografía. Available online: www.inegi.org. mx/ (accessed on 09 September 2016). [3] Optometría México. Available online:
www.op-tometriamexico.org/ (accessed on 20 Septem-ber 2016).
[4] Hernández-Luna CP, Barrera-Santos DC, Gui-za-Segura C, Rodríguez-Malagón JP, Ernesto-Ludeman W and Gómez-Montaña SP. Estudio de prevalencia en salud visual en una po-blación escolar de Bogotá, Colombia 2000. Ciencia & Tecnología para la Salud Visual y Ocular 2003; 1: 11-23.
[5] Kanski J. Oftalmología Clínica. Sexta Edición. España: Elsevier; 2009. pp. 46-51
[6] Pérez-Tejeda AA, Acuña-Pardo A and Rúa-Mar-tinez R. Repercusión visual del uso de las com-putadoras sobre la salud. Rev Cub Salud Públi-ca 2008; 34: 1-8.
[7] del Río-Martínez JH and González-Videgaray M. Trabajo prolongado con computadoras: consecuencias sobre la vista y la fatiga cervi-cal. SEMAC 2007: 26-28. [IX congreso de er-gonomía, 26-28 abril, 2007].
[8] Bansal Y and Moudgil T. Computer Visión Syn-drome. Int J Inn Res Dev 2014; 3: 276-279. [9] Liou JC, Teng MC, Tsai YS, Lin EC, Chen BY.
[10] Moreno-Domínguez JC, Perea-Ruiz CA, Suárez-Herrera F y Sanfeliz-Yebra N. Prevalencia y fac-tores de riesgo para el pterigium en la po-blación de “Hebi”: Henan provincia, China 2009. Rev Ciencias Médicas 2011; 15: 43-58. [11] Sekelj S, Dekaris I, Kondza E, Gabric N, Pre-dovic J and Mitrovic S. Ultraviolet light and pte-rygium. Coll Antropol 2007; 31: 45-47.
[12] OXFAM México (Oxford Committee for Famine Relief). Available online: www.oxfammexico.org (accessed on 15 september 2016).
[13] Secretaria de Desarrollo Económico del Gobi-erno del Distrito Federal. Política de Recuper-ación del Salario Mínimo en México y el Distri-to Federal. Available online: www.salarioscdmx. sedecodf.gob.mx (accessed on 7 August 2016).
[14] CICS UST. Instituto Politécnico Nacional. Avail-able online: www.cics-sto.ipn.mx/(accessed on 15 november 2016).
[15] Bueno Garcia RA. El impacto de las nuevas tec-nologías en la visión. Ciudad de México, 11 de Octubre del 2011. [Conferencia en el Día Mun-dial de la Salud].
[16] Manterola C y Pineda V. El valor de “p” y la “sig-nificación estadística”. Aspectos generales y su valor en la práctica clínica. Rev Chil Cir 2008; 60: 86-89.
[17] Rivas F. El significado de la significancia. Bio -médica 1998; 18: 291-295.
[18] Hoffelt Z, Fallon S, Wong BA, Lucas B, Coleman AL, Mills RP, Wilson R and Mansberger SL. Glaucoma public service announcements: fac-tors associated with follow-up of participants with risk factors for glaucoma. Ophthalmology 2011; 7: 1327-1333.
[19] Bonifacio-Sandín. El estres: un análisis basado en el papel de los factores sociales. Int J Clin Health Psychol 2003; 3: 141-157.