Abstract — The proper layout and efficient utilization of
resources; human, machinery and space can have a positive bearing on the productivity of manufacturing companies. A case study was carried out at a furniture manufacturing plant in Harare, Zimbabwe and this paper presents the findings and proposals for an optimized plant layout and materials handling system. Inherent problems within the manufacturing setup were identified through the use of questionnaires and the company’s available documentation. These ranged from crisscrossing process flows, undocumented production plans and inadequately planned materials processing and handling. Following a detailed work study, production planning and control techniques for materials handling, processing and assembly were introduced to improve production throughput times. Three alternative models were conceptualized and the best model was selected using the payback period method while optimization of the plant was achieved through a novel approach of process mapping of the layout, available space and materials handling machinery. Results obtained from the assessment of the selected model revealed that transportation distances can be reduced significantly while production throughput time decreases.
Index Terms— Materials Handling, Optimization, Plant
Layout, Process Mapping, Workstation
I. INTRODUCTION
HE key objective of any manufacturing company is to maximize on profit margins [4]. Thus the production function of manufacturing companies holds the key to the success of the organization, coupled with the advancement and rapid changes in technology, the rising costs of production and related factors. Most multinational companies have realized the importance and adopted new manufacturing techniques to enhance profitability,
Manuscript received March 07, 2016; revised March 18, 2016.
Wilson R. Nyemba is a Lecturer in Engineering Design and
Manufacture, currently on sabbatical from the University of Zimbabwe and pursuing doctoral studies in Modelling, Process Flow and Simulation of Engineering Design and Manufacture at the University of Johannesburg, Department of Mechanical Engineering Science, Faculty of Engineering and the Built Environment, Auckland Park 2006, Johannesburg, South Africa. (Phone: +263 772 345 441, e-mail: [email protected])
Charles Mbohwa is a Full Professor of Sustainability Engineering and
Engineering Management at the University of Johannesburg, Auckland Park Bunting Road Campus, P. O. Box 524, Auckland Park 2006, Department of Quality and Operations Management, Johannesburg, South Africa. (e-mail: [email protected])
Lloyd E. N. Nyemba is a Research Scientist/Engineer at the Production
Engineering Institute, Scientific Industrial Research and Development Centre, 1574 Alpes Road, Hatcliffe, Harare, Zimbabwe. (e-mail: [email protected])
competitiveness and efficiency, especially in view of the fact that the majority of these companies have the financial capacity and ability to implement such new techniques and systems. However, the same cannot be said for indigenous owned manufacturing companies in Zimbabwe. They have undoubtedly lagged behind in embracing the latest in technology and systems because of limitations in financial capacity. This was compounded by the global recession that affected many developed and emerging economies from around 2008. At that time many thought Africa would not be affected as much as the developed world because of their relative weak global linkages but it turned out otherwise [1].
This recession probably affected Zimbabwe the worst in the region resulting in a difficult economic environment that unleashed many challenges to the business community and a number of organizations in Zimbabwe suffered dramatic consequences such as collapse and liquidation. Some of these organizations were key and obviously very valuable to the community at large and with help, could be rehabilitated and put back on the road to recovery [10]. During this period most companies in Zimbabwe were surviving on ‘hand to mouth’ leaving very little or no funds set aside for research, new techniques or systems. Without proper systems and plant layouts, some of the work was being carried out haphazardly with little or no scheduling or planning. A team of engineering academics from the University of Zimbabwe set out to assist and rehabilitate some of these companies by setting up operating systems and plant layouts as part of research at minimal or no cost to the company but with the ultimate objective of improving efficiency and productivity to enhance profitability. This paper reports on the work undertaken at the holding company for its two subsidiaries specializing in furniture manufacture and wood processing. The team focused on the plant layout, scheduling of production, movement and handling of parts and materials and operating systems.
Manufacturing operations transform inputs such as raw materials, labour, overheads in the form of machinery and resources through processing into products for sale. For a good manufacturing system, such inputs must be well-organized and formulated in order to produce the output at the best efficiency [5]. Understanding what a business does and how it does it, requires documenting the inputs, processes, outputs and resources [7]. For this research, it was achieved by a detailed work study carried out by engineering students who were also undertaking their own projects. A number of problems were identified during the
Optimization of a Plant Layout and Materials
Handling System for a Furniture Manufacturing
Company
Wilson R. Nyemba, Charles Mbohwa, and Lloyd E. N. Nyemba
process. In general, critical documents such as Plant Layout Design, Production Flow Charts, Bills of Materials, Manufacturing Planning Documents, Work Standing Procedures, Safety Procedures and Quality Control Procedure were either unavailable or inadequate resulting in production being carried by instructions from management and in most cases materials and parts were observed to be moved back and forth (crisscrossing) in the plant and thereby travel long distances before the final product was ready for dispatch. Evidently it was clear that the materials handling and movements needed to be improved and optimized. Although it is not a subject or focus for this paper, the technology employed was largely manual and this resulted in delays in meeting customer orders. Competence of most of the staff was based on experience of having operated some of the machines for many years but evidently lacked the ability to change or adapt to new technologies. This ultimately created problems for the team of researchers in that the available skilled staff would not be trainable for new techniques as they lacked the basic education requirements. This challenge also resulted in incidences of reworking and scrapping in production, sometimes arising from customer returns and thus it left quality of the products questionable.
All these problems generally result in costly production. The research therefore focused on and aimed at optimizing the distances through which parts travelled between workstations, minimization of materials handling costs, rearrangement of machinery for an optimum and safe working environment and economic utilization of space and machinery. Production planning and scheduling were also considered with the ultimate aim of not only improving quality of the furniture but a reduction in throughput times as well as inventory. The manufacturing operations would thus be improved in terms of machinery and labour utilization, safety of operations and quality of products whilst reducing scrap and reworks with the overall objective being to minimize the cost of manufacturing while meeting customer specifications and needs, thus enhancing profitability and viability of the business.
II. BACKGROUND AND LITERATURE ON MODELLING AND
OPTIMIZATION IN MANUFACTURING
In their research on modelling and simulation for a Just-In-Time (JIT) optimization of automotive component manufacturing using ProModel, Reference [9] demonstrated that variables such as inconsistent task distribution, variation on operator performance, misconception of total quality management philosophy and lack of set-up time elimination plans disrupt ideal JIT production and thereby affecting the company’s productivity and efficiency and hence profitability. In recent years, JIT has become synonymous with Total Quality Management (TQM), time based manufacturing and business re-engineering [2]. Even for small scale manufacturing, proper planning is necessary to realize a reasonable return on the business investment. The case study company is a relatively small holding company with subsidiaries that manufacture a wide range of furniture products. One of the objectives to carry out the research was
to demystify the misconception that such a company had in that planning and optimization of the nature that the team set out do was a preserve of multinational companies and that it would be costly, hence the approach and use of readily available tools such as Microsoft Excel and AutoCAD, the only available CAD software at the company at that time.
III. METHODOLOGY AND DETAILED CASE STUDY
The holding company has several divisions, all involved in timber processing and manufacture of various timber related products, but focus for this research was on 2 divisions which share the same plant and machinery, the first one specializing in nursery furniture, which included bunk beds and baby cots while the other specialized in cable drums and roof trusses. Initially a detailed ‘As-Is-Analysis’ was carried to establish the operational setup, documentation available and skills and expertise in each unit. The research was divided into three categories, plant layout, production planning and operational activities.
A. Plant Layout
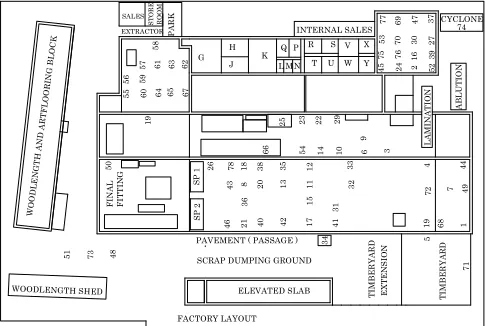
Measurements of the available space were made and setup and layout of equipment were superimposed on the space in AutoCAD by using the plant grid lines that enhanced the drafting process and workstation locations. Fig. 1 shows the layout of the plant at the inception of the research showing the various numbered workstations as well as alpha character labelled designated areas within the plant. Data collection involved gathering of the following information:
• Products manufactured and sales trends • Machine positions and services distributions • Materials Handling Equipment and Flow Paths • Storage space
• Operations flow and process times
The analysis of the plant layout involved the identification of idle and dangerous workstations, backtracking production lines, regions of interference, bottlenecks and targets for redesign while the plant layout redesign approach was mainly based on the minimization of materials handling costs by reducing the transportation distances in the production process. The minimum distance travelled method approximated the cost per unit meter using the average speed of the transportation process as well as the average wage rate of the particular craftsman at each workstation per unit time. 6 7 6 9 7 0 6 8 F IN A L F IT T IN G 7 1 7 2 3 0 3 1 3 2 3 3 3 5 3 6 3 7 3 9 4
0 42
4 1 4 5 4 7 2 9 2 7 4 6 2 6 2 4 4 4 2
3 22
2
1
4
3 20
1 8 1 7 3 8 1
4 10
9 8 7 4 6 3 2 1 2 5 5 4 4 8 4 9 5 3 5 1 5 2 6 6 6 5 6 4 6 0 5 9 5 5 5 6 5
7 63
6 2 6 1 5 8 1 2 1 3 1 1 1 5 1 6 1 9 L A M IN A T IO N G H
J K L MN
P
Q R S
T U V W X Y INTERNAL SALES 3 4 74 7
5 76
7 7 7 3 S P 1 S P 2 CYCLONE A B L U T IO N
WOODLENGTH SHED ELEVATED SLAB
SCRAP DUMPING GROUND
T IM B E R Y A R D T IM B E R Y A R D
PAVEMENT ( PASSAGE ) 5
[image:3.595.308.545.121.282.2]7 8 WO OD L EN GT H A ND AR T FL OO R IN G B L OC K FACTORY LAYOUT E X T E N S IO N EXTRACTOR SALES R O O M S T O R E P A R K 5 0 1 9
Fig. 1. Factory Layout of the Timber Processing Plant
The divisional layout may also restrict the economic use of space. The location of the functional departments may be causing the problem of isolation of interacting operational zones. The layout of the plant at inception also showed
evidence of backtracking and crisscrossing of process flows as shown in Fig. 2, the process flow for the manufacture of bunk beds. The positioning of departments and operational zones also caused interference problems between workstations, which invariably were a safety concern.
F IN A L F IT T IN G L A M IN A T IO N WAREHOUSE A B L U T IO N
WOODLENGTH SHED ELEVATED SLAB
SCRAP DUMPING GROUND
T IM B E R Y A R D T IM B E R Y A R D
PAVEMENT ( PASSAGE )
WO O DL EN G TH AN D A RT FL OO R IN G B L OC K E X T E N S IO N EXTRACTOR SALES R O O M S T O R E P A R K
PP 1 TP 1
SPRAY SHOP F IT T IN G A S S Y 1 A S S Y
2 SP 1 PP 2
PP - PRIMARY PROCESSING SP - SECONDARY PROCESSING
[image:3.595.47.290.554.717.2]TP - TERTIARY PROCESSING ASSY - ASSEMBLY KEY
Fig. 2. Process Flow for Manufacture of Bunk Beds
B. Production Planning
For each of the existing production layouts, analysis was done by looking at the production sequence, benefits of the existing layout, bottlenecks, limitations, constraints to redesign and targets or opportunities for redesign. The main limitations to redesign included interference problems between workstations, long distances between workstations, backtracking and limited transportation resources. The major constraints to redesign included the location of the spray painting shop, the location of critical machines such as the drum sander (35) and the multi-borer (11), space considerations, location of power points and the position of outlets to dispatch. It was also noticeable that there was high utilization of space due to the existence of idle workstations. These included idle departments like the cable drum production line, obsolete inventory warehouse, and faulty machinery. A good materials requirements planning is essential to ensure that the right materials are acquired at the right time and in the right quantities [7].
C. Operational Activities
All these challenges observed in the Plant Layout,
Production Planning as well as Operational Activities are
not insurmountable and do not require significant capital investment. The company’s potential lay in its ability to transform from traditional to more modern methods of manufacture with properly documented processes and schedules. This was the basis on which the proposed redesign of the layout, materials handling and operational activities was done.
IV. OPTIMIZATION AND REDESIGN OF THE PLANT LAYOUT
There are various ways in which the production and layout of manufacturing plants can be optimized to achieve high yields, operational efficiencies and low production costs. Several such projects have been carried out in different manufacturing plants and this is widely reported in literature. Such ventures include the use of simulation in flow shop scheduling problems as was done in the manufacture of semi-conductors [12] and optimization of process parameters in feed manufacturing using Artificial Neural Networks [13]. This research focused on optimization through analyzing materials movement and handling, reducing transportation distances as well as reorganization of the plant and machinery.
A. Materials Movement and Handling Equipment
Materials and parts in the plant are moved by forklifts, trolleys or by hand and the ones available are shown in Table I. Forklifts are mainly used in the kitchen furniture department where transportation of bulk materials is required as well as in coffin production before the raw timber blocks are cross cut into shorter lengths that can be transported by a trolley or hand. There were seven trolleys available including a heavy duty one and these were distributed throughout the plant. Most of these were used in the division where small to medium size parts were transported. When all forklifts and trolleys were in use, materials and parts were often transported by hand.
TABLEI
MATERIALS HANDLING EQUIPMENT
Materials Handling
Equipment
Dimensions/m
(Length x Width)
Quantity
Forklift 4,50 x 1.30 2
Trolley 3.50 x 1.50 1
Trolley 2.45 x 0.945 2
Trolley 2.65 x 1.22 4
Hand
The production process is done in batch quantities. Timber is selected on the basis of the number of products that have to be manufactured as per customer orders, details of which are obtained from the sales department. For instance if 10 bunkbeds have to be manufactured in a week, timber blocks were selected from the timber yard for each component of the bunked. A typical example is the number of each component on a bunkbed as shown in Table II, which gives information on the bills of materials.
TABLEII
BILL OF MATERIALS FOR BUNKBEDS
Part Number
Part Name
Quantity Final Size Rough Size
1 Slates 28 944 x 70 x 22 970 x 76 x 25
2 Cleats 4 1880 x 35 x 22 1905 x 38 x 25
3 Long Rails 6 1950 x 140 x 22 1975 x 145 x 22
4 Short Rails 8 970 x 140 x 22 995 x 145 x 22
5 Guide Rails 1 1950 x 100 x 22 1975 x 105 x 25
6 Legs 8 725 x 45 x 45 750 x 50 x 50
7 Dowels 4 L x φ 20 L x φ 25
8 Legs 2 1250 x 45 x 22 1275 x 50 x 25
9 Steps 4 260 x 45 x 22 285 x 50 x 25
The optimization of the materials handling system was achieved through the use of information gathered about the manufacturing system and setup at inception of the project, hence the focus on the three handling methods. It was necessary to review the system design criteria and keep it in mind while redesigning the handling system with a view to increase production, reduce cost, optimally utilize space as well as handle as large a load on each movement as possible while maintaining a continuous flow of materials. The kitchen furniture division uses bulk timber and thus the forklift is the most ideal. Only in the event of a breakdown, then the heavy duty trolley can be used. Due to increased cost and frequent shortage of fuel, a trolley can substitute the forklift in this division. This is also made easier by the relocation of the crosscut (41) and the ripsaw (1) as shown in Fig. 1 close to the timber yard to reduce distances travelled by parts. Their location close to the timber yard also enables loads to be increased so that movement is done in one go thus reducing costs. The two smaller trolleys can thus be appropriately allocated for use in the nursery department as the products manufactured there require shorter components which can easily be accommodated.
The coffins department is relatively small and distances moved by the components are minimized since machines are close to each other. The use of hands is increased on the finishing stages of production, i.e. from sanding zones to the assembly areas. This is mainly done to preserve the surface finish of the components and subassemblies, which can be distorted if trolleys are used. A revised reallocation of materials handling equipment is shown in Table III.
TABLEIII
REALLOCATION OF MATERIALS HANDLING EQUIPMENT
Materials handling equipment
Dimensions/m (length x width)
Quantity Reallocated department of use
Forklift 4.50 x 1.30 1 Kitchens/coffins
Trolley 3.50 x 1.50 1 Kitchens
Trolley 2.45 x 0.945 2 Nursery
Trolley 2.65 x 1.22 1 Furniture
Trolley 2.65 x 1.22 1 Coffins
Trolley 2.65 x 1.22 2 Kitchens
Hand Furniture
[image:4.595.309.546.562.670.2]IV, extracted from the number of movements among Timber Yard (T/Y), Workstations (W/Station) and Assembly (Assy) in the processing of short rails and slates for the bunk beds. The Workstation (W/Station) numbers/labels are machines as provided in Fig. 1.
TABLEIV
NUMBER OF MOVEMENTS BETWEEN WORKSTATIONS IN THE ASSEMBLY OF
SHORT RAILS AND SLATES FOR BUNKBEDS
Short Rails Assembly Slates Assembly
W/Station 1 4 8 16 20 35 W/Station 41 4 15 21
T/Y 1 T/Y 1
41 1 5 1 9 9
7 7 7 7 19
12 7 7 7 7 12 19 13
13 7 7 35 13 13
Assembly 7 Assembly 21
Table V shows the total distances moved by the short rails and slates for the bunk beds. The sum of the distances for all the components gives the total distance moved by a bunkbed, also known as index of direct materials handling.
TABLEV
TOTAL DISTANCE TRAVELLED BY SHORT RAILS AND SLATES IN THE
ASSEMBLY OF BUNKBEDS
Three options were considered for the reorganized plant based on related workstations and mapping of similar processes to avoid backtracking and crisscrossing process flows, using an approach between group technology and functional layout. This was mainly because of the different processing workstations and different products that resulted in a number of permutations and possible arrangements of machinery and equipment. An Excel program was developed to compute the total distances travelled by components for a wide range of selected products at the 2 subsidiary companies. The machine distance matrix was created and shows the distance between two interacting workstations in a symmetrical array format whose diagonal is all zero.
(Aii = 0 where i=1, 2, …….n) and n represents the
number of workstations and (Aij = Aji for i, j = 1, 2……
and i ≠ j
The From to Matrix of materials movement is also a square symmetrical array similar to the previous one but this one shows the number of material movements between any two interacting workstations. The number of movements was calculated based on the selected products. The Total Distance Matrix, similar to the former is the product of
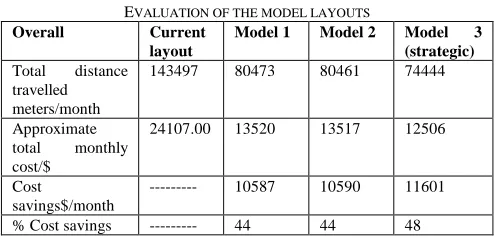
corresponding workstation distances and number of material movements. The resultant arrangements for the three models are summarized in Table VI after extracting from the different Excel spreadsheets for the selected products and repeatedly evaluated for each model plant layout based on:
• Approximating distances between workstations • Preparing the machine distance matrix
• Approximating number of movements between interacting workstations for the month
• Preparing material movement matrix for the month • Preparing total distance matrix for the month • Establishing total transportation cost for the month. Model 3 was chosen based on the least distance travelled by the parts, hence the least cost as well as the minimum payback period.
TABLEVI
EVALUATION OF THE MODEL LAYOUTS
Overall Current
layout
Model 1 Model 2 Model 3 (strategic)
Total distance
travelled meters/month
143497 80473 80461 74444
Approximate
total monthly
cost/$
24107.00 13520 13517 12506
Cost
savings$/month
--- 10587 10590 11601
% Cost savings --- 44 44 48
The redesigned plant layout based on model 3 is illustrated in Fig. 3, showing a systematic flow of processes and grouping of similar functions and workstations with minimal backtracking and crisscrossing of process flows for the entire company’s 4 production lines.
T
IM
B
E
R
Y
A
R
D
a
n
d
T
IM
B
E
R
S
T
O
R
E
S
P
R
IM
A
R
Y
P
R
O
C
E
S
S
IN
G
Z
O
N
E
(
P
P
Z
)
S
E
C
O
N
D
A
R
Y
P
R
O
C
E
S
S
IN
G
Z
O
N
E
(
S
P
Z
)
T
E
R
T
IA
R
Y
P
R
O
C
E
S
S
IN
G
Z
O
N
E
(
T
P
Z
)
F
IN
IS
H
IN
G
&
A
S
S
E
M
B
L
Y
F
IN
A
L
F
IT
T
IN
G
SPRAY SHOP DISPATCH
DISPATCH
DISPATCH
ROOF TRUSSES AND MOULDINGS
NURSERY FURNITURE
[image:5.595.45.294.147.262.2]COFFINS KTICHEN FURNITURE
Fig. 3. Redesigned Plant Layout showing the Flow Processes for the Functional Groups and Products.
V. DISCUSSION AND RECOMMENDATIONS
After analyzing the current layout and materials handling equipment, a redesign of the layout was done to allow for smooth and continuous flow of materials in one direction throughout production. This was achieved by utilizing factors such as; quantities transported, distances moved, aisle space and surface finish of components.
A contemporary approach was taken in the analysis of materials flow while all interrelated materials handling problems were identified and a materials handling plan Short Rails Assembly Slates Assembly
W/
Station 1 4 8 16 20 35
W/
Station 41 4 15 21
T/Y 15 T/Y 16.4
41 12.8 115 1 239.6 96.5
7 39.6 48.8 7 100.6
12 39.6 39.3 100.4 190.6 12 155.7 40.0
13 17.6 34.7 35 370.5 260.3
Assy 300.5 Assy 335.3
[image:5.595.303.551.269.388.2]developed. The equipment considered in this work was compatible with the overall system of production. In order to fit the materials handling equipment available, a redesign of the current layout was to ensure smooth flow of materials with minimal backtracking and crisscrossing process flow paths. Space considerations were also taken into account where the subassembly and assembly areas were allocated more space since there was an increase in the volume of materials at the end of production. Initially there were four spray paint shops located in each department but these have been relocated strategically and adjacent to the final assembly and fitting area resulting in a reduction in congestion and improved quality of products as parts were no longer moved back to the dusty machine shop environment.
Due to an increasing cost and shortage of diesel, the use of forklifts have now been confined to the kitchen furniture area where transportation cannot be done by hand or trolley because of bulky materials. The few trolleys available were then accordingly distributed over the nursery and coffin production areas. This minimized the use of hands and hence the number of movements between workstations leaving the use of hands in materials handling to the final fitting areas where quality of the final product is a priority. The gangways in the kitchen department increased and this allowed free movement of the forklift without interfering with other processes. Labour utilization is also significantly improved since congestion and interferences were minimized. Machines that were shared by all departments, such as the drum sander (35) have been centrally located.
One of the forklifts frequently broke down creating a bottleneck in the movement of parts and materials in the redesigned kitchen furniture area and thus it was recommended to either replace it or constantly maintain it to ensure that there is no stoppage of production. This also helps in reducing waiting times before and after processing. Although the use of the heavy duty trolley is an alternative, it is not only less efficient but requires two people to operate it. A well-established preventive maintenance system was recommended to avoid breakdowns. It was also observed that there was a high volume of components in the production system of nursery furniture and coffins of which movement cannot be adequately catered for by the available trolleys, prompting the need to acquire more trolleys.
The introduction of a conveyor system as a materials handling equipment can also be considered although it may be deemed to be capital intensive. The initial costs of implementation might be very high but the long-term benefits will outweigh the expenditure incurred. Materials flow should also be restricted to the use of gangways so as to reduce interference with machine operations. Monitoring and controlling of the production process flows can be enhanced by the use of plant layout and materials flow documents. In the long run and with more capital available, recommendations were made for the company to consider general automation and the use of conveyers and perhaps with more expertise, advanced techniques such as simulations and genetic algorithms can also be used to further optimize the layout.
VI. CONCLUSIONS
The implementation of the redesigned plant layout and optimized materials handling system were welcomed by management because of the evident change in a number of performance indicators such as; reduction in cost and throughput time as well as improvements in storage space and controls, quality and a safe working environment.
There was a marked decrease in the distances travelled by components and number of movements due to an increase in loads per movement. The redesigned layout and reallocation of materials handling equipment resulted in a decrease in waiting and movement times leading to less overloading and congestions at some of the workstations, hence no backward process flows to the dusty machine shop. Coupled with the documented materials flow, it enhanced tracking and monitoring, leading not only to better quality control but better quality products as well as a noticeable decrease in the number of returns and rejects. Distances between interacting workstations were reduced and space freed up for a safe working environment.
REFERENCES
[1] Bakrania, S. and B. Lucas (2009), “The Impact of the Financial Crisis
on Conflict and State Fragility in Sub-Saharan Africa”, Governance
and Social Development Resource Centre Issues Paper,
Available: http://www.gsdrc.org/go/emerging-issues#crisis,
Accessed: 26 Feb 2016
[2] Cua, K. O., McKone, K. E. and Schroeder, R. G., (2001),
“Relationships between implementation of TQM, JIT, and TPM and manufacturing performance”, Journal of Operations Management, 19 (2001), 675– 694, Elsevier
[3] El Maraghy, H., Al Geddawy, T., Samy, S. N. and Espinoza, V.,
(2014), “A model for assessing the layout structural complexity of manufacturing systems”, Journal of Manufacturing Systems, 33 (2014), 51– 64, Elsevier.
[4] Goldratt E. M. and Cox J., (2004), “The Goal – A Process of Ongoing
Improvement”, Third Revised Edition, North River Press, ISBN 978-0-88426-274-8
[5] Hall, J. A., (2008), “Accounting Information Systems, 9th Edition”,
Chapter 7 – The Conversion Cycle, pp 305-348, CENGAGE
Learning, ISBN-13: 9781133934400
[6] Hasan, M. A., Sarkis, J. and Shankar, R., (2012), “Agility and
production flow layouts: An analytical decision analysis”, Journal
- Computers & Industrial Engineering, 62 (2012), 898–907, Elsevier
[7] Neufeld, J. S., Gupta, J. N. D. and Buscher, U., (2016), “A
comprehensive review of flow-shop group scheduling literature”,
Journal - Computers & Operations Research, 70(2016), 56–74,
Elsevier
[8] Prasad, N. H., Rajyalakshmi,, G. and Reddy, S. A., (2014), “A
Typical Manufacturing Plant Layout Design Using CRAFT
Algorithm”, Procedia Engineering, 97(2014), 1808 – 1814, Elsevier
[9] Sandanayake, Y. G., Oduoza, C. F. and Proverbs, D. G., (2008), “A
systematic modelling and simulation approach for JIT performance optimization”, Journal - Robotics and Computer-Integrated
Manufacturing, 24(2008), 735– 743, Elsevier
[10] Zimpapers, (2008), “University of Zimbabwe Forges Strategic
Alliances with Industry”, Business Herald
[11] Kia, R., Khaksar-Haghanib, F., Javadianc, N. and
Tavakkoli-Moghaddam R., (2014), “Solving a multi-floor layout design model of a dynamic cellular manufacturing system by an efficient genetic algorithm”, Journal of Manufacturing Systems, 33(2014), 218– 232, Elsevier.
[12] Lin, J. T., Chen, C. M., (2015), “Simulation optimization approach
for hybrid flow shop scheduling problem in semiconductor back-end manufacturing”, Simulation Modelling Practice and Theory, 51(2015), 100–114, Elsevier.
[13] Sudha, L., Dillibabu, R., Srinivas, S. S., Annamalai, A., (2016), “Optimization of process parameters in feed manufacturing using artificial neural network”, Computers and Electronics in