Abstract—So far, various web elements and web environments have contributed to Web GIS as alternative technologies of existing GIS technologies. Map and web services such as Google Maps and Google Earth appeared as main components of web GIS and they still used as favorite services by general people who don’t even know about GIS well. However, there is limit on visualizing raster data on web browser because of limit of raster data as image. Most geo-browsers like Google Earth still handle raster data as image and this causes limitation of expressiveness because delicate expression of raster on Google Earth is impossible. So WebGL which supports 3d graphic library is suggested as an alternative technology and diverse studies suggest WebGL application as result of them. But if we use WebGL as client, huge size of raster data causes overload during execution procedure. To secure operational efficiency on web environments, concurrent process is needed to use each core effectively. In this paper, to develop the method for visualizing raster by WebGL, we designed the processing which displays raster data on a Web browser as it preprocesses them by building shaders and dividing data. And to check efficiency of concurrent environment, we applied single and concurrent thread to the visualizing process and performed benchmarking between single and concurrent environments by comparing the visualizing processes in different environment variables.
Index Terms— Concurrent Programming, 3D Visualization, WebGL, Web Worker, Web GIS, Benchmarking
I. INTRODUCTION
ince the release of new web standards or before, several web technologies related with visualization and supply of web data have contributed to notable developments of Web GIS. In respect of data dissemination, web services which had been originally suggested for cooperation among business venders caught developers’ attention as a data provider thanks to their openness. And in case of visualization, mashup in which GIS data can be visualized by combining with web map services is regarded as a major element of web GIS visualizing system. To apply these technologies effectively, diverse research were reported so far [1][2].
As a major supplier of GIS data, web services guarantee easier accessibility by providing several methods which enables users to access data stored in remote place. Open Geospatial Consortium (OGC) that was established for
Manuscript received July 23, 2013; revised August 20, 2013. This research was a part of the project titled 'Gyeonggi Sea Grant Program', funded by the Ministry of Oceans and Fisheries, Korean.
Hyung Woo Kim is with Pukyong National University, Daeyon3Dong 599-1, Namgu, Busan, South Korea (e-mail: [email protected]).
Yang Won Lee is with Pukyong National University, Daeyon3Dong 599-1, Namgu, Busan, South Korea (corresponding author to provide phone:+82-51-629-6660;fax:+82-51-629-6653;e-mail:[email protected]).
standards of general GIS services has legislated standards for diverse GIS web services such as Web Map Service(WMS), Web Feature Service(WFS), Web Coverage Service(WCS) and thus far, a lot of vendors have complied with them. Especially, as WMS can compose mashup by combining with other web services, it has been utilized as a method for visualizing geographic data on Web. Since Google known as pioneer of public map service model unveiled their 2D and 3D Map Services, mashup has been a sort of industry norm to implement Web GIS. These map services basically offer deployable functions through specific Application Programming Interfaces (API). As a typical example of this, Google map services provide objects such as ‘Map’, ‘Marker’, ‘Polygon’ as interaction methods between users and map contents [3].
In spite of these methodological advancements to implement web GIS, in respect that several types of geographical data such as raster cannot be freely utilized on web yet, there is a point that improvement is needed.
Geographic data which can be classified into vector and raster are used in the form of objects such as polygon, polyline and others or image according to whether it reflects discrete or sequential features. While vector can be compatible to current web GIS environment sufficiently, raster that is used in the form of image is inappropriate to web GIS environment in respect of its availability. That is, it is hard to visualize raster data on web browsers in that raster can’t be easily modified on web browsers due to the difficulty of handling the bits streams of image data. Accordingly, several studies have thus far tried to search the appropriate technology which can cover this flaws and WebGL have been suggested as a tool for realizing a geo-browser [9].
Single and Multiple Thread Programming for
Geo-visualization by Using WebGL with Web Workers
Hyung Woo Kim, Yang-Won Lee
[image:1.595.331.521.164.391.2]S
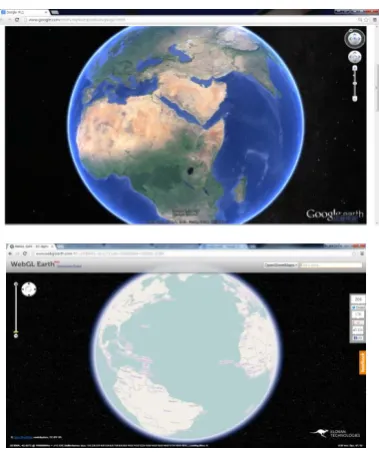
WebGL is a 3D graphic library which is bound in browsers and it allows GPU acceleration on web browsers. And also, it is a low-level language based on Open GL ES 2.0 suggested for mobile environment [4]. The most representative feature that makes WebGL to be welcomed as foundation technology of 3D visualization system is that it can realize cross-browsing and render 3D object specifically. A typical instance of existing 3D visualizer, Google Earth needs additional plug-in installation to be used on Web browser and this disadvantage is inadequate for current Web environment in which various devices and browsers coexist. And when raster data are overlaid on globe of Google Earth, there is a limit to visualizing the sequential feature of raster values unless raster is preprocessed outside browser. On the contrary, as most recent web browsers are supporting WebGL and each of pixel data of raster can be drawn manually by WebGL, it can be a best solution for geo-visualizing. For this reason, its availability is tested in several papers [5][6].
At this point in time, however, this diversification of methods for visualizing raster can toss a one question about handling data on Web browser. How can mass data such as raster be handled on browser effectively? When we handle the data for WebGL, most data should be processed in form of Javascript array and raster which contain plenty of numerical values can cause a problem about overloading in this situation. Generally, browsers are composed of browser engine, rendering engine and etc., and especially, the rendering engine which renders web contents on the browser is single threaded [7]. This can intensify the problem suggested above, so multi-thread environment is needed to handle raster which contain as much values as browsers can’t handle in one time. As a solution of this problem, HTML5 recently released Web Worker Object which can realize multi-thread environment on browser and we suggest it as a proper solution of the problem.
In this study, to develop proper methods for visualizing raster by WebGL in the web environment in which data easily overflow and to test suitability and efficiency of them, methods for preprocessing raster data through single and concurrent threads were devised and benchmarking between both methods was operated through processes of WebGL visualizing. To confirm effectiveness of multi-threading environment by web workers on various kinds of devices, we measured CPU usage of mobile and desktop separately and compared.
This paper consists of 5 chapters which depict processes of 3D visualization for raster and benchmarking between single and multi-thread processes. In chapter 2, detailed account of components and processes for visualizing raster data by WebGL are represented and a description about multi-threaded methodology of the processes introduced in chapter 2 is explained in chapter 3. Methods and environment variables of benchmarking are delineated in chapter 4 and conclusion about the results and the future works are in chapter 5 lastly.
II. Procedure of 3D Raster Visualization
To visualize raster data by 3D rendering, there are some essential rendering procedures as depicted in Figure 2. The elements of the processes are composed of shaders, divider, producer and renderer and each of components is involved in each process of 3D visualization. These processes are totally performed in web environment and, from now, let us
call a terminology of components which implement the visualizing processes as 3D Web App.
Initially, there are two kinds of shader, vertex shader which manipulates vertex data of buffers and fragment shader which manipulates fragment data in the form of buffers [8]. The rough rendering process in shaders is that vertex shader first receives data from the specific variable of Javascript via uniform and attribute variables and both of shaders process the received data to be displayed along with the pipeline of vertex and fragment shaders. Each of the shaders is written by Graphic Library Shading Language (GLSL) and is built by Web browser. After building the shaders, to receive raster data from remote location, 3D Web App connects to a specific Web service which provides raster data as a JSON format. We adopted the RESTful Web service suggested from [9] which is linked with spatial DBMS. Transmitted data from the Web service is made up by spatial attributes which represent features of raster such as pixel values, width, height, resolution and so on. Pixel values compose a 2-dimensional
Building Vertex and Fragment Shaders for Rendering
Connecting to Web Service to get Raster Data
Dividing data and producing list of proper spatial Objects
Spatial Object
[image:2.595.326.532.44.296.2]Producing Vertices, Indices, etc., Arrays Spatial Objects Making buffers Rendering Arrays Buffers
Fig. 2. Procedure of Raster Rendering
② Loop
② Loop
① Dividing ③ Making
Vertex and Index A
Pixel
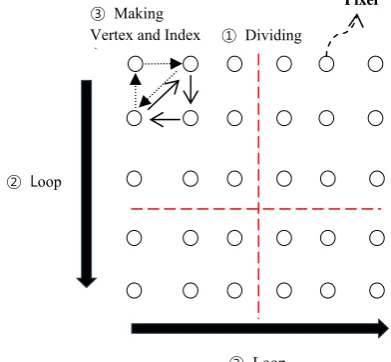
[image:2.595.331.527.576.757.2]array that indicates sequential features of raster data and other attributes are used to produce index buffer afterwards. After transmission of raster data, 3D Web App executes preprocessing tasks such as checking data length, dividing raster data, transforming data to array. The reason of preprocessing is related with limitation of WebGL. When we use raster as a source of 3D rendering, in accordance with the size of raster data, the length of the data can be stretched from tens of thousands to hundreds of thousands. However, WebGL buffers, especially the index buffer for coordinates of polygon has length limit (16bits, 65535) [4] and if it is exceeded its own limit, rendering error could be occurred. Thus to prevent this, we need a dividing procedure of the array before transforming. In this research, ‘100’ is adapted as a boundary number for division and hereby the index buffer length can’t be over 30000. When the dividing procedure is completed, the received data sliced completely as several pieces of raster are saved as the list of raster tiles and are converted into one dimensional array such as vertex, index, normal and color arrays. The vertex array produced from pixel values is the array which saves raster pixels in order of 3D coordinates, X, Y, Z. As values of the vertex arrays are saved like the direction of double loop ② in Figure 3, left to right, top to bottom and the values of index arrays represents the rendering order of ③. Color and normal arrays produced with vertex and index arrays save the values for rendering color and light. In this procedure, according to intention of a WebGL user, the information which should be visualized can be drawn in the specific aspect like color, Z-coordinates. After producing these essential array, 3D Web App produces buffers for WebGL rendering and each shader performs 3D rendering.
III. Concurrent Method for Raster Rendering To maximize effectiveness of data processing, concurrent process is essential in the era of multi-core CPU and as of now, we can conveniently adopt multi-thread environment through Web Worker of HTML5 as denoted in introduction. Web Worker is the standard for implementing multi-thread environment which was impossible until the past. It is a background thread object which is executed on Javascript environment and is separated from main function when it utilized [10].
In this research, to apply concurrent environment to the rendering process suggested in previous chapter, we distributed the loop statements such as dividing raster tile, producing index buffers in several Web Worker objects and balanced data load of raster tiles. The number of Web Worker followed the number of cores of each devices used in this study. Hereby, although operational flow of web application is still managed in main function but efficiency of rendering process which can be collapsed by single thread is secured by Web Worker.
IV. Benchmark on a Desktop and a Smart Device Single and multithreaded processes for rendering suggested from previous chapters, was compared with each other. We analyzed them from aspects of CPU performance to aspects of data size in this chapter. Total 5 types of data which are split in different size are utilized in benchmarking for checking availability of each method and mobile and desktop devices were used for evaluating
suitability in diverse operational environments. All of other variables are fixed except the type of devices and data size for fair comparison and the environment of benchmarking in detail is same as below.
Type of Device : Intel i5 3550 Quad-core(Ivy bridge), nVidia Quad-Core Tegra 3(Nexus 7) Raster Size : 100x100, 500x500, 1000x1000,
2000x2000, 3000x3000
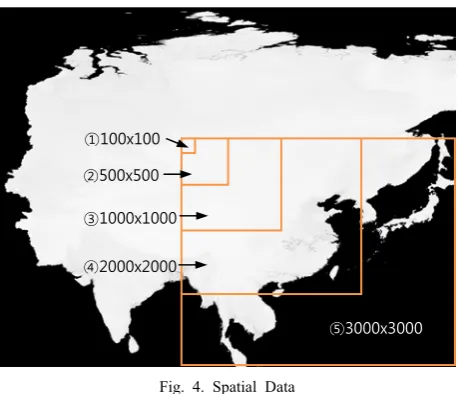
Spatial data used in benchmarking are USGS DEM data which has 1 kilometers resolution and size is same with Figure 4. Types of web browsers used in benchmarking are, in case of desktop, Chrome 28 built for windows and in case of Android, same one built for Android. The methods of visualization are the way described in chapter 2 and chapter 3 and spatial DBMS for raster web service is Postgresql with PostGIS which has raster data type.
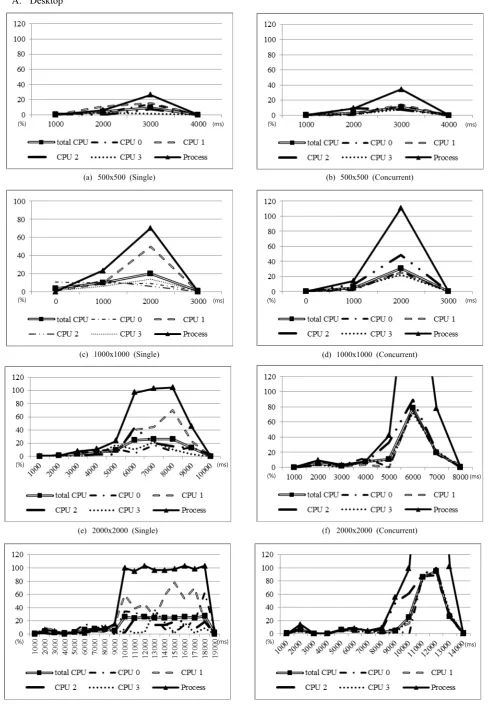
[image:3.595.313.543.52.249.2]As a result of benchmarking, use time of each devices and methods is indicated in Figure 5. In case of 100x100, as boundary value of spit was selected 100 in chapter 3, division is not applied. So, the data are processed by just one Web Worker and this causes same result with Single processing method. Considering this fact, Figure 5 shows exact results of operation between single and concurrent methods. From the case of 500x500, single and concurrent methods start to show trivial gap between each use time and as data size increases, the gap between devices and methods are clear and certain. Each result of benchmarking is depicted in Figure 6 and Figure 7 except the case of 100x100.
Fig. 5. Use Time of Each Process
(%) (ms)
Fig. 4. Spatial Data ①100x100
②500x500
⑤3000x3000
③1000x1000
[image:3.595.311.546.614.779.2]A. Desktop
(a) 500x500 (Single)
(%) (ms)
(b) 500x500 (Concurrent)
(%) (ms)
(c) 1000x1000 (Single)
(%) (ms)
(d) 1000x1000 (Concurrent)
(%) (ms)
(f) 2000x2000 (Concurrent)
(%) (ms)
(e) 2000x2000 (Single)
(%) (ms)
(g) 3000x3000 (Single)
(%) (ms)
(h) 3000x3000 (Concurrent)
[image:4.595.55.548.56.761.2](%) (ms)
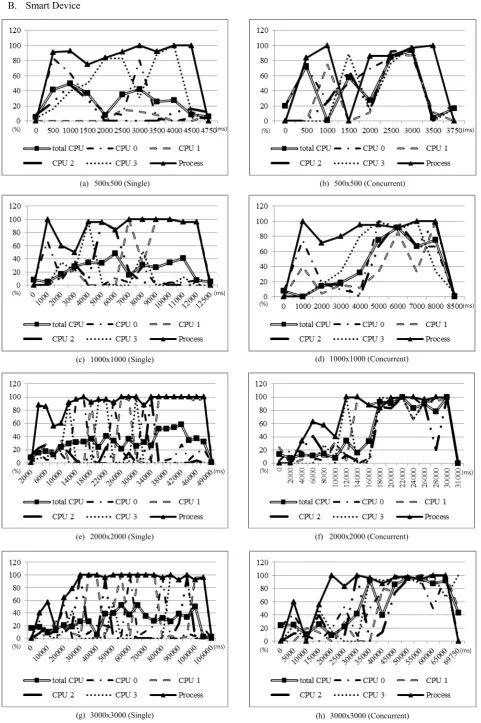
B. Smart Device
[image:5.595.59.541.51.775.2]
Fig. 7. Benchmarking of Mobile
(a) 500x500 (Single) (b) 500x500 (Concurrent)
(c) 1000x1000 (Single) (d) 1000x1000 (Concurrent)
(e) 2000x2000 (Single) (f) 2000x2000 (Concurrent)
(g) 3000x3000 (Single) (h) 3000x3000 (Concurrent)
(%) (ms) (%) (ms)
(%) (ms)
(%) (ms)
(%) (ms)
(%) (ms)
(%) (ms)
In the results of desktop benchmark, as desktop CPU originally show outstanding performances than tablet CPU, use time average(9s, 7.25s) in desktop is quite shorter than those(43s, 28.2s) in tablet. In the case of 500x500, there is no distinct difference between single thread rendering and concurrent thread rendering, but from the case of 1000x1000, subtle difference is appeared. Complete time still has no difference but cooperation of CPU cores is appeared in (c) and (d) charts of Figure 6. Particularly, in data processing of 2000x2000 and 3000x3000, we can check start point of visualizing process at the middle of the charts (5s in 2000x2000, 8~9s in 3000x3000) as process graphs skyrocket at that time. The former time range of start point is estimated as the step of data transmission and as size of data increase, we can check that the time range of transmission and visualizing process are extended proportionally. During visualizing process, while concurrent-thread process regularly keeps CPU usage of each core to be balanced, single-thread process releases the CPU usage.
In case of tablet, unlike the case of desktop, CPU use time of rendering process is more spent than the time of desktop. And usage of each CPU is more variable because of frequent calls of other mobile applications. Change pattern of graphs shows that it uses about a half of time to receive raster data which is similar with desktop results. Use time of each core in single and concurrent processes also shows similar trends with the cases of desktop during
rendering process as CPU use time of each core in single-threaded process is unbalanced but the time in multi- threaded process shows opposite results. As a result of rendering, DEM is printed as Figure 8.
V. Conclusion and Future Works
Thus far, to use raster data effectively and delicately in web environments in which various web browsers and devices is used together, we suggested the methods of raster visualization by using WebGL of HTML5. In this rendering process, whole raster data from Web services was split into several raster tiles and essential arrays for rendering on browsers were produced on Web browsers. However, this preprocessing of the suggested method can cause excessive data load on Web browsers, as a solution of this problem, concurrent environment by Web Worker is adopted in this study and benchmarking between both single and concurrent rendering environments considering raster size and type of devices was operated. Benchmarking was implemented by distributing loop statements which could cause data overloading in each Web Workers and visualizing raster data. As a result, concurrent task by Web Worker is more efficient and less spent time than single threaded task.
In the future work, to expand the usage range of concurrent process by Web Worker used for preprocess of WebGL data in this research, we will try to develop other usage examples by using other map services. And for efficient cooperation of each CPU core, we also have a plan to try to design the task scheduling which focus on web GIS system and User Interface.
REFERENCES
[1] D. Butler, “Virtual globes: The web-wide world,” Nature 439, 2006, pp. 776-778
[2] T. C. Patterson, “Google Earth as a (Not Just) Geography Education Tool” in Journal of Geography, 2007, pp. 145-152
[3] Google, Google Maps JavaScript API v3, https://developers.google.com, 2013
[4] Khronos Group, WebGL Specification, https://www.khronos.org, 2013
[5] P. Sloup, 2011, “WebGL Earth,” Baschelor Thesis, Faculty of Infromatics, Masaryk University
[6] M. MILIVOJEVIĆ, I. ANTOLOVIĆ, D. RANČIĆ, “Evaluation and visualization of 3D models using COLLADA parser and WebGL technology”, in Proceedings of the 2011 international conference on
Computers and computing(ICCC), 2011, pp. 153-158
[7] T. Garsiel, “How browsers work,” on http://taligarsiel.com
[8] A. Munshi, D. Ginsburg, D. Shreiner, OpenGL ES 2.0Programming Guide, 2008
[9] H. W. Kim , J. S. Ahn, Y. W. Lee, “Implementation of an Open API for Raster Database,” in Journal of the Korean Cartographic Association, Vol. 12, No. 3, 2012, pp. 45-53
[image:6.595.54.287.386.568.2][10]W3C, Web Workers, http://www.w3.org, 2012
Fig. 8. Results of Rendering (a) Rendering result of desktop