Comparing Soft Computing Techniques for Estimating
Demand of Season Ticket Holders
Mehmet Şahin
Department of Business Administration, Adiyaman University, Adiyaman, Turkey
ABSTRACT
Sports have macroeconomic effects and profound impacts on the level of development of countries. Therefore, sports economics deserves and receives attention in the literature. In this study, season ticket holders (STHs), who have a significant effect on sports economics, are the main concern. STHs have strategic and financial importance to professional sports teams. STHs play a key role on stadium economics of soccer teams. Considering these points, soft computing techniques, adaptive neuro-fuzzy inference system (ANFIS) and artificial neural network (ANN), were utilized to predict demand of season ticket holders of soccer clubs in this study. Real data of soccer clubs from multiple countries were used in the training and testing processes of the models. The performance measures indicated that both of the proposed models could be used for prediction purposes effectively. However, the ANFIS model with hybrid optimization outperformed the ANN model. Contrary to the studies concentrating on analyzing determinants of the STH demand, this study is the first for predicting the demand of season ticket holders by using two competitive methods.
Keywords
Stadium Economics; ANFIS; Demand Forecasting; ANN
1.
INTRODUCTION
Sports have macroeconomic impacts for all countries. The macroeconomic effects of sports can be explained in the following way for European Union. Considering the European Union, the direct impacts of sports, add up to 2.98% (294.36 billion Euros) of overall gross value added. The stake of sports in European Union value added is comparable to the stake of joint fishing, forestry, and agriculture and about two and a half times as high as quarrying and mining. In addition, it embodies at least more than one fifth of financial service activities, including insurance and pension funds. Every sixtieth Euro produced and received in the European Union is sports-related. In addition, considering the European Union, for the narrow definition the stake of sports-related employment is 1.49% and 2.12% for the broad definition of sports. Considering both direct and indirect impacts, it can be concluded that sports provides employment of 5,085,137 people that means 2.42% of European Union employment in the narrow definition. Growth in the sports-related economy, as a consequence, generates above average employment growth [1]. Therefore, it can be inferred that sports and sports economics are integral parts of macroeconomics.
Gross domestic product (GDP) is considered to be the most commonly used macroeconomic factor to determine the health of a country’s economy. There is a relation between GDP and sports investments of a country. In other words, a country with high GDP is able to allocate more funds for sports that lead better performance in international competitions. Better
performance in international competitions mean generating more revenue that may affect development of countries. Sports economics has also great impact on development economics. Underdeveloped countries cannot afford widespread sport development, allocating enough money for sports and sports facilities. Therefore, they are not able to generate enough income that can contribute their economic development.
Economic development of a country affects the country’s investment in sports that affect the economy of the country considerably. A developed country will be able to invest more money in providing sports facilities that leads to sports participation, success in sports and more income for the country ultimately. This situation is relevant for individuals as well. Individuals are likely to allocate more budgets for sports equipment purchases in case economic development occurs [2].
Sports participation plays a significant role on development of a country’s economy in different perspectives. Sports participation strengthens economy and society to a certain extent in real ways. It helps developing skills, which affect productivity of people at work. It builds social unity and social capital—keys to prosperity and development as well. Active sport participation in sufficient amounts, improves health by building personal fitness. In addition, at a macroeconomic level, the aggregated spending of all people basically determines the employment level and the overall health of the sports industry of the country [3]. Thus, it affects the number of jobs offered and numbers of people working in service, retail, and manufacturing industries directly.
In this study, as an economic indicator, attendance demand of sports events is considered. Season ticket holders (STHs) are an essential part of the sports clubs and events. First, STHs are a prominent source of direct income, which can be equal to one third or more of the total revenue of a club [4]. This allows the club to make investments and plans in advance of the season. Second, STHs generate indirect revenue by spending on food, merchandise, parking, etc. in the stadium. Third, STHs provide valuable data in terms of spectator behaviors (attendance, spending, etc.). This helps clubs to develop their future plans such as improving stadium atmosphere. Finally, a large number of STHs may attract sponsorships that mean additional revenue for the club [5]. Therefore, an accurate demand prediction of STHs is vital for sports clubs.
35 STHs, Beccarini and Ferrand [7], McDonald et al. [8], Shaw
and McDonald [9], McDonald et al. [10] examined factors influencing STHs’ satisfaction, Schreyer et al. [11] predicted STH loyalty by using geographical information. The majority of the studies in the sports economics and marketing are about revealing determinants of the sports demand [12-22]. Hence, it can be concluded that there is a need for studies regarding predicting demand of STHs.
Soft computing techniques are utilized for various purposes in the literature. They are capable of predicting results of games [23], selecting players and talents [24], estimating winner of games [25] and demand forecasting [26]. Thus, it is believed that the soft computing techniques are able to produce effective and competitive forecasting results.
The central aim of this study is to extend the literature by proposing ANFIS and ANN forecasting models for predicting demand of STHs of soccer clubs specifically for the first time. These techniques were used by Şahin and Erol [27] before, however the models they proposed were for game-specific attendances rather than STHs. To do so, effective factors were determined based on an extensive literature review and expert knowledge. These factors were used as the inputs in the models. The results of the model might be a valuable input for sports economics. The proposed models could be utilized by sports decision makers, regulators, and administrators either. Last but not least, it is also valuable to evaluate the attendance of STHs within the macroeconomics perspective.
2.
MATERIALS AND METHODS
2.1
Adaptive Neuro-Fuzzy Inference
System
[image:2.595.316.543.517.696.2]The adaptive neuro-fuzzy inference system (ANFIS) is one of the soft computing techniques. The ANFIS is considered to be more powerful than neural networks and fuzzy logic algorithm as it integrates the advantages of both methods including fast learning capacity, adaptation capability and nonlinear ability. The ANFIS has ability to build a fuzzy rule-base and tune the parameters of the membership functions based on a data set. It comprises of five layers that can be explained as given in Table 1 [26].
Table 1. The properties of the ANFIS layers
Label Description
1 The fuzzification layer that contains membership functions, which can be triangular, Gaussian, etc.
2 The rule layer that calculates the strength of rule multiplication.
3 The normalization layer that plays a normalization role to the firing strengths of the layer 3.
4 The defuzzification layer, in which the nodes are adaptive.
5 The output layer that calculates the sum of the outputs of layer 4.
2.2
Artificial Neural Networks
Artificial neural networks (ANNs) mimic a human brain’s learning and decision making processes. ANNs can be described as structures composed of adaptive and interconnected nodes that have ability to perform data processing and knowledge representation. The architecture of ANNs can be classified as single layer feedforward, multilayer feedforward, and recurrent network based on the
interconnection and disposition of the neurons, and the composition of the layers. In this study, multilayer perceptron (MLP) neural network is applied. The typical MLP comprises of three layers. The first layer is called as input layer and receives data from the external environment. The second layer is called hidden layer, and comprises of neurons and transforms the input to a functional form by the output layer. The output layer also comprises of neurons, and produces and presents the final outputs. As a training method, Levenberg-Marquardt is used due to its highest efficiency. It is the fastest method and suitable for training small-sized networks.
2.3
Methodology
[image:2.595.54.287.536.664.2]For the use in the ANFIS and ANN models, the three most effective input variables were determined depending on the comprehensive literature review and expert knowledge. First, the occupancy rate was chosen as it covered some effective factors such as success of the team, performance of star players, etc. [5, 6, 10]. It was calculated as the ratio of the average attendance of the team in the given season to the capacity of its stadium. Second, the performance of the team was selected since it played a key role on STHs’ decisions [5-7, 10]. It was calculated as the ratio of the total points collected by the team to total possible points in the season. Finally, the rank of the team in the given season was considered to be an effective variable [5]. The rank was deemed to be a significant performance indicator. The values of it were standardized to improve the accuracy of the forecasting results. The output variable is the STHs rate, which was calculated by dividing the number of season ticket holders by the capacity of the stadium. Therefore, the predicted values are to be multiplied by the capacity of the stadium of the team to obtain demand of STHs. The requisite data were collected for the input and output variables from different sources. Forty five years’ data of the soccer clubs were used for training the models, and eight years’ data were used for testing the models. The data were collected from the official websites of the clubs. The data of the various soccer clubs from various countries were utilized to generalize the proposed models. In this way, the models can be used for any club from any country.
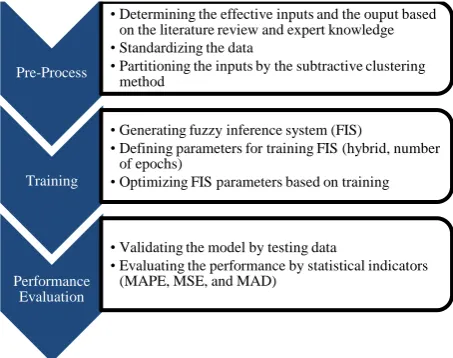
Figure 1. The steps of developing the ANFIS model
The application of the ANFIS was developed in three main phases as summarized in Figure 1. The application comprises of three main stages that are pre-process, training, and
Pre-Process
• Determining the effective inputs and the ouput based on the literature review and expert knowledge • Standardizing the data
• Partitioning the inputs by the subtractive clustering method
Training
• Generating fuzzy inference system (FIS)
• Defining parameters for training FIS (hybrid, number of epochs)
• Optimizing FIS parameters based on training
Performance Evaluation
• Validating the model by testing data
performance evaluation. In the pre-process step, the effective inputs and the output were determined based on a comprehensive literature review and expert knowledge. Then, the data were standardized. The inputs were portioned by the subtractive clustering method subsequently. In the training step, the fuzzy inference system was generated and the parameters that include number of epochs were defined for the training. Then, the FIS parameters were optimized based on the training. In the performance evaluation step, the model was validated by testing the model. Then, the performance of the model was evaluated by the performance measures. The structure of the proposed ANFIS model is illustrated in Figure 2.
Figure 2. The structure of the proposed ANFIS model
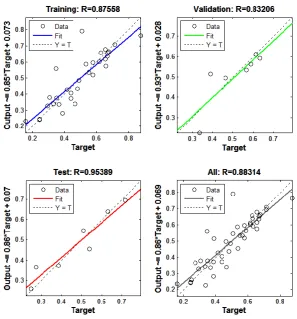
Figure 3. The proposed ANN training regression
The steps involved in the application of the ANN are as follows. First, the data were separated into training and test sets. Second, the structure of the network was defined. Third, the Levenberg-Marquardt learning algorithm was selected after a trial and error process. Fourth, the parameters and initial weights were selected. Fifth, the training was started, and the weights were determined and revised after experimenting different values. The training regression of the proposed model is depicted in Figure 3. Finally, the models
were simulated and tested, and the most efficient model was determined and proposed.
2.4
Performance Measures
[image:3.595.149.447.296.616.2]37
3.
RESULTS AND DISCUSSION
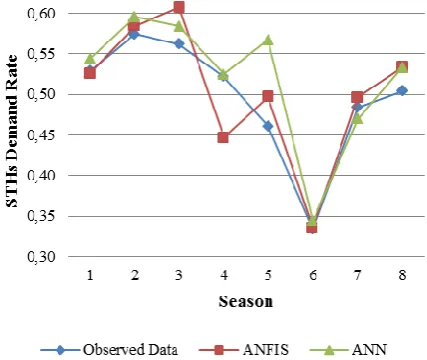
[image:4.595.54.289.207.307.2]The results of the proposed ANFIS and ANN models are compared to the real data in Table 2. The results are also depicted in Figure 4. The predicted results were obtained from the ANFIS model with hybrid optimization method for training fuzzy inference system and the ANN model, whose network type was feed-forward backpropagation, with one hidden layer with fourteen neurons.
Table 2. The comparison of the predicted demand values to the observed data
Season Observed Data ANFIS ANN
1 0.529 0.526 0.543
2 0.574 0.584 0.595
3 0.562 0.607 0.584
4 0.522 0.447 0.524
5 0.461 0.497 0.567
6 0.334 0.336 0.344
7 0.484 0.496 0.470
8 0.504 0.534 0.533
The results in the table indicate that the estimation results of the both models are effective. Especially, the estimations for the sixth season are among the most successful results. The ANFIS model produced the most competitive results for the seasons 1, 2, 5, 6, 7, and 8. Likewise, the ANN model generated the most successful predictions for the seasons 1, 2, 3, 4, 6, 7, and 8. The outcome of the season 5 might be considered as an exception for the ANN model. Overall, the prediction results of the proposed ANFIS model seem more accurate.
Figure 4. Comparing the predictions with the observed data
The results of the MAD, MAPE, and MSE are 0.03, 0.05, and 0 respectively for the ANFIS and 0.03, 0.06, and 0 respectively for the ANN models. All values of the performance measures are less than 10% that mean both of the models can be effectively utilized for the prediction purposes. However, the ANFIS model is the most accurate model for that purpose.
4.
CONCLUSIONS
The ANFIS and ANN models were developed to predict the demand of STHs of soccer clubs. By examining real data of the soccer clubs, the models were trained and tested. The real data of different clubs from different countries were utilized to generalize the models. In order to evaluate the performance of the models, statistical indicators were used. After the evaluation, the performance measures of both models revealed that both models were able to predict the demand effectively. However, the ANFIS model was able to perform better prediction results compared to the ANN.
This study is considered to be a valuable contribution in terms of utilizing and comparing soft computing techniques that were used for the first time to estimate STH’s demand. It is also worthwhile to evaluate the sports economics in terms of macroeconomics.
The future studies can focus on the demand determinants that can be increased in case it is need. Different forecasting models may also be utilized to compare the results.
5.
REFERENCES
[1] Austria, S. 2012. Study on the contribution of sport to economic growth and employment in the EU. Final Report Retrieved from http://ec. europa. eu/sport/library/studies/study-contribution-spors-economic-growth-final-rpt. pdf. Accessed on August. 5: p. 2014.
[2] Mandle, J.R. 2012. Sport and economic development: The case of Bangladesh.
[3] Bloom, M.R., M.W. Grant, and D. Watt. 2005 Strengthening Canada: The socio-economic benefits of sport participation in Canada. Conference Board of Canada.
[4] Wakefield, K.L. 2007. Team sports marketing. Elsevier.
[5] McDonald, H. 2010. The Factors Influencing Churn Rates among Season Ticket Holders: An Empirical Analysis. Journal of Sport Management. 24(6): p. 676-701.
[6] McDonald, H., A.J. Karg, and C. Leckie. 2014. Predicting which season ticket holders will renew and which will not. European Sport Management Quarterly. 14(5): p. 503-520.
[7] Beccarini, C. and A. Ferrand. 2006. Factors Affecting Soccer Club Season Ticket Holders’ Satisfaction: The Influence of Club Image and Fans’ Motives. European Sport Management Quarterly. 6(1): p. 1-22.
[8] McDonald, H., C. Leckie, A. Karg, and N. Zubcevic-Basic. 2017. Female season ticket holders: how their satisfaction is derived differently from males. European Sport Management Quarterly: p. 1-19.
[9] Shaw, R.N. and H. McDonald. 2006. Season-ticket holder satisfaction and sponsor-related behaviour: evidence of a positive relationship. International Journal of Sports Marketing and Sponsorship. 7(4): p. 23-30.
[10] McDonald, H., A.J. Karg, and A. Vocino. 2013. Measuring season ticket holder satisfaction: Rationale, scale development and longitudinal validation. Sport Management Review. 16(1): p. 41-53.
[image:4.595.68.282.440.620.2]geographical information. Applied Economics Letters: p. 1-6.
[12] Borland, J. and R. MacDonald. 2003. Demand for sport. Oxford review of economic policy. 19(4): p. 478-502.
[13] Buraimo, B. and R. Simmons. 2008. Do sports fans really value uncertainty of outcome? Evidence from the English Premier League. International Journal of Sport Finance. 3(3): p. 146.
[14] Cox, A. 2015. Spectator demand, uncertainty of results, and public interest: Evidence from the English Premier League. Journal of Sports Economics: p. 1527002515619655.
[15] Dobson, S. and J. Goddard. 2011. The Economics of Football. Cambridge University Press.
[16] Dobson, S.M. and J.A. Goddard. 1992. The demand for standing and seated viewing accommodation in the English Football League. Applied Economics. 24(10): p. 1155-1163.
[17] Forrest, D. and R. Simmons. 2002. Outcome uncertainty and attendance demand in sport: the case of English soccer. Journal of the Royal Statistical Society: Series D (The Statistician). 51(2): p. 229-241.
[18] García, J. and P. Rodríguez. 2002. The determinants of football match attendance revisited: Empirical evidence from the Spanish football league. Journal of Sports Economics. 3(1): p. 18-38.
[19] Martins, A.M. and S. Cró. 2016. The Demand for Football in Portugal: New Insights on Outcome Uncertainty. Journal of Sports Economics: p. 1527002516661602.
[20] Pawlowski, T. and C. Anders. 2012. Stadium attendance in German professional football–The (un) importance of uncertainty of outcome reconsidered. Applied Economics Letters. 19(16): p. 1553-1556.
[21] Peel, D.A. and D.A. Thomas. 1992. The demand for football: Some evidence on outcome uncertainty. Empirical Economics. 17(2): p. 323-331.
[22] Reilly, B. 2015. The demand for league of Ireland football. The Economic and Social Review. 46(4, Winter): p. 485-509.
[23] Rotshtein, A.P., M. Posner, and A. Rakityanskaya. 2005. Football predictions based on a fuzzy model with genetic and neural tuning. Cybernetics and Systems Analysis. 41(4): p. 619-630.
[24] McCullagh, J. 2010. Data mining in sport: a neural network approach. International Journal of Sports Science and Engineering. 4(3): p. 131-138.
[25] Purucker, M. 1996. Neural networks quarterbacking-how different training methods perform in calling the games. IEEE Potentials: p. 9-15.
[26] Şahin, M. and R. Erol. 2018. Prediction of Attendance Demand in European Football Games: Comparison of ANFIS, Fuzzy Logic, and ANN. Computational Intelligence and Neuroscience. 2018: p. 14.