11
Computational Intelligence based Data-Driven
Modeling: A case Study in Hydrology
Tanveer Ahmed Siddiqi
Department of Mathematics
University of Karachi
Karachi, Pakistan
Muhammad Jawed Iqbal
Institute of Space and Planetary
Astrophysics, University of Karachi
Karachi, Pakistan
ABSTRACT
Nonlinearity exists in most of the real phenomenon and it is difficult to model the behaviour of such indefinite systems. Neural computing is one the important tools for modeling the nonlinear structures and efficiently applying in the measurement of inexplicit systems. The monsoon rainfall in Pakistan shows an important part in upstream flow in the Upper Indus Basin (UIB). This study, suggests different Dynamic Neural Network (DNN) models, based on time delayed autoregressive structures, for the upstream water flow of Tarbela Dam on upper Indus basin. The appropriateness of the models for training, validation and testing phases established on evaluation metrics which exhibit the accuracy of the models. This paper also gives a major preference when only the upstream flow gauge stations data are available, which can be beneficial for water-resource engineers.
General Terms
Computational Intelligence, Time Series Forecasting
Keywords
Upper Indus Basin, Dynamic Neural Network, Upstream water flow.
1.
INTRODUCTION
Monsoon precipitation plays a significant part in discharge in Indus River and its tributaries from April to September [1]. Yearly precipitation changes from 1000-1400 mm in the whole area. Around 10% of the precipitation is lost by dissipation and about a 41 million section of land foot is lost by leakage from unlined trenches [2]. The losses could have been minimized with the suitable stream-flow estimating and enhancing the stream structures in Pakistan. We have different methods for estimation of stream flow analysis, such as estimation of hydrological parameter etc. A study estimates the risk of flood in River Indus of Pakistan by utilizing recorded information of most peak discharges which calculates the return period of various dams in Pakistan using probabilistic distributions e.g. Weibull distribution, Pearson type-3 analysis. GIS technique is also used for assessing the flood risk. A recent study has been employed nonlinear techniques of forecasting to analyze the long-term stream flow of the Indus River. On the other hand, completed a thorough study on the flood determining framework for the using a simulated neural system (NN) model [3] and they have reported that there is a space for further improvement for the NN model. During most recent couple of decades, different techniques have been produced for forecasting in which ARMA or NN model building methodologies are well accepted. The aim of this paper is to develop some Neural Network models of upper Indus Basin at Tarbela Dam. The other phase of this research is that it gives an
inclination if only the observations of upstream flow station is possible, which might have been valuable for water-resource organizers.
2.
RELATED WORK
Pakistan has different types of climatic conditions in different parts of the country. We see the extreme variations of temperature seasonally. The climate extremes in Pakistan incorporate high and low temperatures, heaviest precipitation which causes floods. Flood disasters in Pakistan are regularly activated by strong Indus River. The Indus River is an important trans-limit stream in Asia with nine tributaries. Its five tributaries on the left bank are the Beas, Chenab, Jhelum, Ravi, and Sutlej streams. The fundamental right bank tributaries are the Gomal, Kabul, Swat and Kurram streams.
12
3.
DATA DESCRIPTION AND
LOCATIONS
The Indus River is around 2,800 km long, with 2,682 km of it, extended in the middle of northern and southern bounds Pakistan. Its alluvial plain zone is around 207,200 km while its deltaic region is about 20,000 km. It starts in the Tibetan tableland, on Kailas Parbat (mountain) close to Mansarwar Lake. It then goes through the Himalayan range, and gathers overflow from the Hindu Kush and Suleiman ranges. In upper to mid district scopes of Indus Basin, are the fundamental tributaries like Jhelum and Chenab reasons for floods, stream floods especially hit Punjab and Sindh. Tarbella Dam is the world largest earth fill dam on the Upper Indus Basin (UIB) in Khyber Pakhtunkhwa in Pakistan and also largest by structural volume.
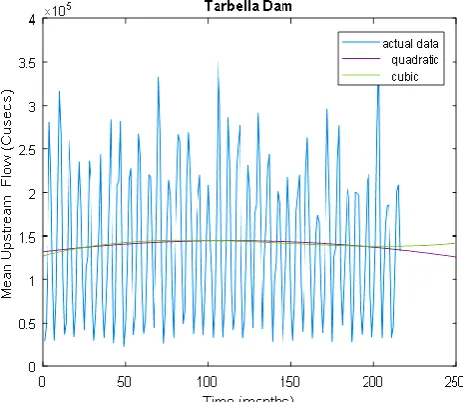
For upstream flow forecasting model, it is not improved to make use of rainfall precipitation because of the elongated difference in time (order of days) between rainfall and the consequent river water flow. In other words, there is a weak correlation between rainfall and flows. So, the utilization of stream flow observations is most likely to adopt for the good upstream flow forecasting model. This paper considers mean monthly upstream flow observations of upper Indus Basin (UIB) i.e. Tarbela Dam from April to September (rainfall season) for each year, ranging from 1977 to 2012 as in Figure 1.
Fig1: Tarbella Dam Historical Observations.
4.
NEURAL NETWORK
[image:2.595.330.515.73.376.2]Neural Network (NN) [8, 9] is one of the major research area, unaided or integrated, in the paradigm of computational intelligence. NN consist of neurons functioning in parallel which are inspired by biological nervous phenomena. In general, functioning of the NN depends on the interconnection between the neurons and train the network by adjusting the values of the connections, called weights. The Figures 2 and 3, as a pictorial example, exhibit the procedure of NN.
[image:2.595.75.307.377.578.2]Fig 2: NN Simple Architecture
Fig 3: NN Procedure
In general, NN can be divided into two types i.e. static and dynamic. The first one does not have response neurons and no delays. On the other hand, dynamic NN take recollection in the method of delays or repeated loops and it is good for training of time varying forms. Because considering the mean monthly upstream flow nonlinear time series, it is required to employ Dynamic Neural Network (DNN).
5.
PROPOSED MODELS OF DNN
The Dynamic Neural Network (DNN) models are based on the following known inputs and the target variable Qt
[image:2.595.327.541.582.698.2]depends on nonlinear autoregressive structure in which the predicted series built on past or delayed observations. DNN is a three-layers model consist of one input, one hidden layer with different number of neuron (based on the behaviour of the system) and a single output layer. Integrated with 70% observations set for training, 5% for validation and 25% for testing purpose.
Table 1. Dynamic Neural Network functional models Model
No. Delayed Inputs Functional Models
1 Qt = f ( Qt-1, Qt-2 )
2 Qt = f (Qt-1, Qt-2, Qt-3)
3 Qt = f (Qt-1, Qt-2, Qt-3, Qt-4)
4 Qt = f (Qt-1, Qt-2, Qt-3, Qt-4, Qt-5, Qt-6)
Qt = Mean monthly upstream water flow at time t
Qt-1 = Mean monthly upstream water flow at time t-1
(lag 1)
13 (lag 2)
Qt-3 = Mean monthly upstream water flow at time t-3
(lag 3)
Qt-4 = Mean monthly upstream water flow at time t-4
(lag 4)
Qt-5 = Mean monthly upstream water flow at time t-5
(lag 5)
Qt-6 = Mean monthly upstream water flow at time t-6
(lag 6)
Standard Training Parameters
Total number of epochs 1000
minimum gradient 1.0 e-07
Initial step size (mu) 0.001
Step decrementing rate 0.10
Step incrementing rate 10
maximum step size 1.0 e+10
Training function
The Levenberg–Marquardt (LM) method [10, 11] is used in training phase for predicting of nonlinear system of upstream flow at Tarbella Dam because LM is a standard optimization technique for nonlinear least-squares problems.
Evaluation Metrics
Mean Squared Error = 𝑀𝑆𝐸 = 𝑄𝑖
𝑜− 𝑄 𝑖 𝑓 2 𝑛
𝑖=1 𝑛
Root Mean Squared Error = RMSE = 𝑀𝑆𝐸
Coefficient of Correlation = R
= (𝑄𝑖
𝑜− 𝑄 𝑜)(𝑄 𝑖 𝑓
− 𝑄 𝑓) 𝑛
𝑖=1
(𝑄𝑖𝑜− 𝑄 𝑜) (𝑄
𝑖 𝑓
− 𝑄 𝑓) 𝑛
𝑖=1 𝑛
𝑖=1
𝐶𝑜𝑒𝑓𝑓𝑖𝑐𝑖𝑒𝑛𝑡𝑜𝑓𝐷𝑒𝑡𝑒𝑟𝑚𝑖𝑛𝑎𝑡𝑖𝑜𝑛 = 𝑅2= 𝑄𝑖 𝑓
− 𝑄 𝑜 2
𝑄𝑖𝑜− 𝑄 𝑜 2
where 𝑄𝑖𝑜= observed upstream flow at time t
𝑄𝑖𝑓= forecasted upstream flow at time t
𝑄 𝑜= mean of observed upstream flow
𝑄 𝑓= mean of forecasted upstream flow
6. RESULTS AND DISCUSSION
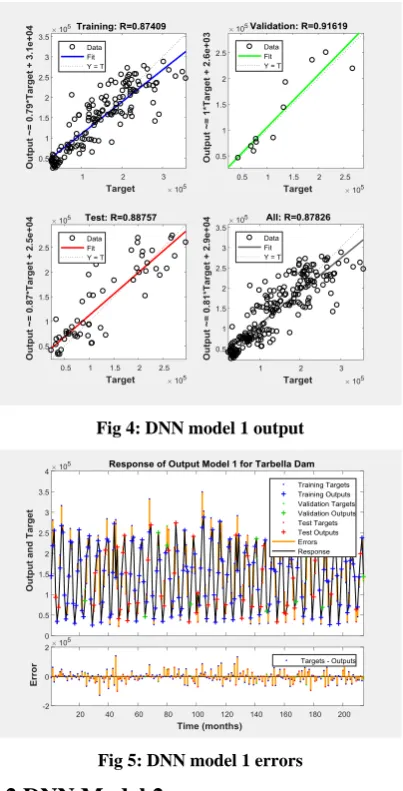
6.1 DNN Model 1
Number of neurons in hidden layer 10
[image:3.595.277.527.66.698.2]Number of delays 2
Fig 4: DNN model 1 output
Fig 5: DNN model 1 errors
6.2 DNN Model 2
Number of neurons in hidden layer 10
[image:3.595.334.536.71.467.2]Number of delays 3
[image:3.595.334.527.449.692.2]
14 Fig 7: DNN model 2 errors
6.3 DNN Model 3
Number of neurons in hidden layer 12
Number of delays 4
[image:4.595.83.288.69.672.2]Fig 8: DNN model 3 output
Fig 9: DNN model 3 errors
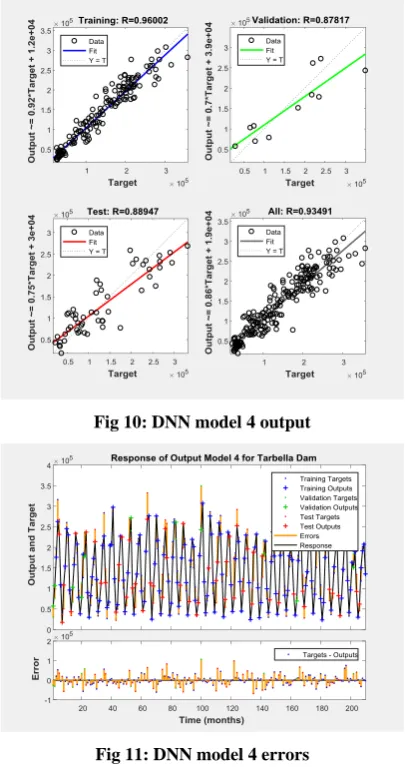
6.4 DNN Model 4
Number of neurons in hidden layer 12
[image:4.595.333.536.74.458.2]Number of delays 6
Fig 10: DNN model 4 output
Fig 11: DNN model 4 errors
6.5 Models’ Evaluation Metrics
The following tables of evaluation metrics of DNN models are given for mean monthly upstream flow at Tarbela Dam and will select a network model on the basis of the following criteria:
a. Network model has maximum value of the coefficient of correlation (R) on the validation set to test forecasts.
b. Network model has maximum value of the coefficient of determination (R2) on the validation set to test forecasts.
c. Network model has minimum error (RMSE) on the validation set to test forecasts.
Table 2. Evaluation criteria of R
Model No. Training Validation Testing
1 0.8901 0.8012 0.8287
2 0.8967 0.8245 0.8707
3 0.9282 0.9176 0.8614
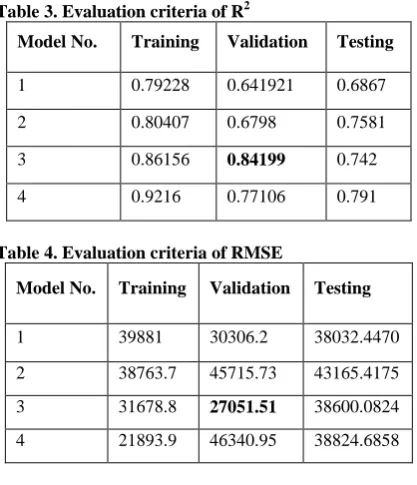
15 Table 3. Evaluation criteria of R2
Model No. Training Validation Testing
1 0.79228 0.641921 0.6867
2 0.80407 0.6798 0.7581
3 0.86156 0.84199 0.742
4 0.9216 0.77106 0.791
Table 4. Evaluation criteria of RMSE
Model No. Training Validation Testing
1 39881 30306.2 38032.4470
2 38763.7 45715.73 43165.4175
3 31678.8 27051.51 38600.0824
4 21893.9 46340.95 38824.6858
7.
CONCLUSIONS
This paper Presented the pursued of our research for developing Neural Network based models which could predict and forecast mean monthly upstream flow through delayed or lagged variables. Within the paradigm of Dynamic Neural Network (NN), it is obvious to follow a criterion where a system could select a Network from the different trained networks models and employ them in predictions and forecasting. The nonlinear autoregressive (NAR) based four different DNN models are inferred or extracted through Figures 4 to 11 with the optimized parameter of number of neurons in a hidden layer. By using the three measures of goodness of fit through models’ evaluation metrics Tables from 2 to 4 over training, validation, and testing sets, it is concluded that the values of the performance measures are sufficient to obtain the DNN model 3 as an appropriate autoregressive structure based neural network model for mean monthly upstream flow on upper Indus Basin at Tarbela. As a future research, extend the proposed approach with other computational intelligence techniques such as Fuzzy Logic (FL) or Differential Evolution (DE) based modeling to accomplish the optimal behavior and higher accuracy of the system.
8. ACKNOWLEDGEMENT
Thanks to Irrigation Department, Karachi city, Sindh, Pakistan to provide the historical gauge observations of upstream flow at Tarbella Dam.
9. REFERENCES
[1] Khan, B., Iqbal, M. J., and Yosufzai, M. A. Y. 2011 Flood risk assessment of river Indus of Pakistan, Arab J Geosci. 4, 115-122.
[2] Hassan, S. A. and Ansari, M. R. K. 2010 Nonlinear analysis of seasonality and stochasticity of the Indus River, Hydro. Sci. J. 55, 250-265.
[3] Coulibaly, P., Anctil, F. and Bobfe, B. 2001 Multivariate reservoir inflow forecasting using temporal neural networks, J. Hydrol. Eng., 6, 367.
[4] Smith K. 1997 Environmental hazards, Assessing Risk and Reducing Disaster, 2nd ed., Routledge: London & New York.
[5] Maier, H. R. and Dandy, G. C. 1997 Modelling cyano bacteria (blue green algae) in the River Murray using artificial neural networks, Mathematics and Computers in Simulation 43, 377– 386.
[6] Tokar A. S. and Johnson, P. A. 1999 Rainfall-Runoff Modeling using Artificial Neural Networks, J Hydrol. Eng. ASCE 4, 232-239.
[7] Mellit, A., Pavan, A. M. and Benghanem, M. 2013 Least squares support vector machine for short-term prediction of meteorological time series, Theoretical and applied climatology 111, 297-307.
[8] Ivakhnenko, A. G. and Grigorʹevich L. V.
1967 Cybernetics and forecasting techniques,
American Elsevier Pub. Co.
[9] Haykin, S. 2009 Neural Networks: A Comprehensive Foundation, eight ed., Pearson Prentice Hall, India. [10] Levenberg, K. 1944 A Method for the Solution of
Certain Non-Linear Problems in Least Squares. Quarterly of Applied Mathematics, 2, 164– 168.
[11] Marquardt, D. 1963 An Algorithm for Least-Squares Estimation of Nonlinear Parameters, SIAM Journal on Applied Mathematics, 11 (2), 431–441. doi:10.1137/0111030.