PERFORMANCE EVALUATION OF CLASSIFIERS FOR EDU
1
Prof. Dr. P. K. Srimani F.N.A.SC,
1Director, R&D Division, Bangalore University
2 Assistant Professor, Dept. of ISE, J.S.S. Academy of Technical Education, Bangalore, Karnataka, India,
Research Scholar, Bharatiyaar University, Coimbatore, Tamilnadu, India
3Professor and Director, ABPL, Bangalore
ARTICLE INFO ABSTRACT
This paper mainly focuses on the performance evaluation of the three types of classifiers viz., Rule-based, Decision tree based and Baysian networks on Edu
consisting of data related to technical education system; which is considered as a benchmark system for the study of Edu
Faculty and Management. The study comprises of 3 modules in student stakeholder, 3 modules in faculty stakeholder and finally an integrated module. Totally 3500 instances are taken for each module and the results of the present
module.(ii) the accuracy and time complexity for all the classifiers and (iii)facilities to take the effective managerial decisions. No doubt the results of the present integrated approach provid unique platform for making effective predictions at all the levels.
INTRODUCTION
Database can be defined, as the collection of data usually associated with any organization based on its various functions. Many organizations have accumulated vast amounts of data with the rapid advance of technology in data collection. Databases today can range in gigabytes, terabytes or even petabytes of size. Within these large databases, there lies a hidden information of strategic importance which is achieved through Data mining. Actually, DM is neither an
research nor a theoretical one, since no experiments are conducted with an initial start and no theory is proved by using the data. Data mining is concerned with the analysis of data and the use of the software techniques for finding patterns, regularities in the sets of data. The computational techniques are responsible for finding the patterns, which are previously unknown, presently useful for future analysis. DM is an integral part of Knowledge Discovery in Databases (KDD), which is the overall process of converting raw dat
and structured information. KDD typically encompasses more than DM. The knowledge discovery process comprises of six phases, Viz., Data selection, Data cleaning, Data enrichment, Data transformation or encoding, Data mining, Reporting and display of the discovered information. Many organizations worldwide are already using DM techniques to explore the hidden useful information from the respective databases. Edu data is a large data repository consisting of data related to educational systems. It has earned lot of scope in educational
*Corresponding author: [email protected]
ISSN: 0975-833X
International Journal of Current Research
Vol.
Article History:
Received 27th
November, 2011 Received in revised form
10th
December, 2011
Accepted 28th
January, 2011
Published online 29th
February, 2012
Key words:
Data mining, Classifiers, data, Edu-mining, Stakeholder, Integrated approach, Performance evaluation.
RESEARCH ARTICLE
PERFORMANCE EVALUATION OF CLASSIFIERS FOR EDU-DATA: AN INTEGRATED APPROACH
Dr. P. K. Srimani F.N.A.SC,
2Mrs. Malini M. Patil,
3Prof.Dr.P.K.Srivathsa
ector, R&D Division, Bangalore University , DSI, Bangalore, Karnataka, India
Assistant Professor, Dept. of ISE, J.S.S. Academy of Technical Education, Bangalore, Karnataka, India, Research Scholar, Bharatiyaar University, Coimbatore, Tamilnadu, India
Professor and Director, ABPL, Bangalore
ABSTRACT
This paper mainly focuses on the performance evaluation of the three types of classifiers viz., based, Decision tree based and Baysian networks on Edu-data which is a large repository consisting of data related to technical education system; which is considered as a benchmark system for the study of Edu-mining. The three important stakeholders
Faculty and Management. The study comprises of 3 modules in student stakeholder, 3 modules in faculty stakeholder and finally an integrated module. Totally 3500 instances are taken for each module and the results of the present investigation predict (i) the optimal classifiers for each module.(ii) the accuracy and time complexity for all the classifiers and (iii)facilities to take the effective managerial decisions. No doubt the results of the present integrated approach provid unique platform for making effective predictions at all the levels.
Copy Right, IJCR, 2012, Academic Journals
Database can be defined, as the collection of data usually associated with any organization based on its various functions. Many organizations have accumulated vast amounts of data with the rapid advance of technology in data collection. bases today can range in gigabytes, terabytes or even petabytes of size. Within these large databases, there lies a hidden information of strategic importance which is achieved Actually, DM is neither an empirical one, since no experiments are conducted with an initial start and no theory is proved by using the data. Data mining is concerned with the analysis of data and the use of the software techniques for finding patterns, The computational techniques are responsible for finding the patterns, which are previously unknown, presently useful for future analysis. DM is an integral part of Knowledge Discovery in Databases (KDD), which is the overall process of converting raw data into useful and structured information. KDD typically encompasses more than DM. The knowledge discovery process comprises of six phases, Viz., Data selection, Data cleaning, Data enrichment, Data transformation or encoding, Data mining, Reporting and play of the discovered information. Many organizations worldwide are already using DM techniques to explore the hidden useful information from the respective databases. Edu-data is a large Edu-data repository consisting of Edu-data related to
It has earned lot of scope in educational
research. Edu-data is evolved because of huge collection of data mainly from World Wide Web, e
adopting MIS methods to edit, store and maintain
[image:1.612.357.516.544.642.2]online registration schemes for admission process , student information system, examination evaluation systems etc. Educational Mining (Edu mining) is a method of mining Educational data. Data mining focuses on different ideas such as sampling, estimation, hypothesis testing from statistics, search algorithms, modeling techniques machine learning theories from artificial intelligence, pattern recognition and machine learning and hi-performance computing,. Thus, data mining is represented as a confluence of many disciplines as shown in the figure 1.
Figure 1: Data mining as a confluence of many disciplines
The advancement of technology has resulted in the evolution of different techniques in the area of DM. New research findings resulted in new issues in each technique. To quote some; Association rule mining, Classification, Clustering, SVM, SDM, Data stream mining etc.
literature reveals that very sparse literature is available
ternational Journal of Current Research
Vol. 4, Issue, 02, pp.183-190, February,2012
OF CURRENT RESEARCH
DATA: AN INTEGRATED APPROACH
Prof.Dr.P.K.Srivathsa
, DSI, Bangalore, Karnataka, India ,
Assistant Professor, Dept. of ISE, J.S.S. Academy of Technical Education, Bangalore, Karnataka, India, Research Scholar, Bharatiyaar University, Coimbatore, Tamilnadu, India.
This paper mainly focuses on the performance evaluation of the three types of classifiers viz., data which is a large repository consisting of data related to technical education system; which is considered as a benchmark mining. The three important stakeholders of the system are Student, Faculty and Management. The study comprises of 3 modules in student stakeholder, 3 modules in faculty stakeholder and finally an integrated module. Totally 3500 instances are taken for each investigation predict (i) the optimal classifiers for each module.(ii) the accuracy and time complexity for all the classifiers and (iii)facilities to take the effective managerial decisions. No doubt the results of the present integrated approach provides a
, Academic Journals. All rights reserved.
data is evolved because of huge collection of data mainly from World Wide Web, e-learning systems, adopting MIS methods to edit, store and maintain the data, online registration schemes for admission process , student information system, examination evaluation systems etc. Educational Mining (Edu mining) is a method of mining Educational data. Data mining focuses on different ideas such , estimation, hypothesis testing from statistics, search algorithms, modeling techniques machine learning theories from artificial intelligence, pattern recognition and performance computing,. Thus, data confluence of many disciplines as
Figure 1: Data mining as a confluence of many disciplines
The advancement of technology has resulted in the evolution of different techniques in the area of DM. New research in new issues in each technique. To quote some; Association rule mining, Classification, Clustering, . A thorough survey of the literature reveals that very sparse literature is available
pertaining to the present work. Clustering approach has been developed to establish a recommendation model for students in similar situations [1]. Recently a machine learning approach for Edu-mining is studied by[2], for student as a stake holder. Here,the authors have used J48, Naïve bayes and ZeroR classifiers only. While a classification model for Edu-mining is studied by[3], for faculty as a stakeholder. Here the authors have used J48, LMT, Randomtree, random forest and REPtree classifiers. In [4], the authors have made a comprehensive study of 16 different classifiers for the three modules of student stakeholder only. They have predicted optimal classifiers for the three modules. Some other works include[5,6,7,8,9,10]. But no work is available with regard to the present work. Hence, the present investigation is carried out by using an Integrated approach to study the technical education system. The performance evaluation of different classifiers on Edu-data is done effectively in order to achieve excellent improvement of teaching, learning and administration of the system.
OVERVIEW OF TECHNICAL EDUCATION SYSTEM (TES)
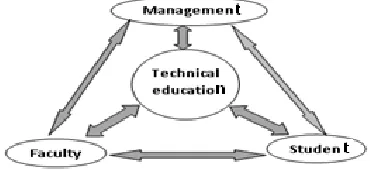
[image:2.612.365.519.75.151.2]This section mainly focuses on the Technical Education System, which is considered as a bench mark system for the study of Edu-mining. The system is organized by three main components, which are called as stakeholders shown in the Figure 2.
Figure 2. Stake holders of technical education system
The three important stakeholders of the system are discussed as follows: Stakeholder 1 is Management, which is the supreme authority to manage the system. Stakeholder 2 is Students who are considered as the main revenue generators in the system, who work on a give and take policy. Stakeholder 3 is Teachers who are instrumental in strengthening of the system and are in teaching and learning process. The managerial perspectives of the present analysis could be cited as: goal seeking analysis, optimization analysis, sensitivity analysis. The detailed discussion on these different approaches of analysis is based on the typical education systems approach to problem solving which is done by proper System Analysis And Design phases(SSAD). The three different phases of SSAD are:
Phase I : Analysis Phase (A)
Phase II : Design and Development (D&D) Phase III: Implementation phase (I)
[image:2.612.71.258.385.470.2]The detailed hierarchy of SSAD is presented in figure 3.
Figure 3: The hierarchy of SSAD
Phase 1 (Figure 3) of SSAD is the analysis phase which consists of Conceptualization(C), which is the first level blue print of the system; Initialization(I) consists of feasibility analysis(Technical, Economical, Operational and Organizational) is self explanatory. Detailed Analysis(DA) which mainly consists of data structures, information flow diagram, and the micro analysis of situation.
Phase II (Figure 3) of SSAD is the Design and Development(D&D) phase, where in the Design step consists of design of procedure, software design of solution etc. Development step consists of development of GUIs.
Phase III (Figure 3) of SSAD is the implementation(I) phase, which mainly consists of Pre and Post implementation(PR&PO). Evaluation(E), consists of pre implementation which includes training of stake holders and the feedback collection. Post implementation includes comparison of the existing and the designed systems. Evaluation step includes performance evaluation of the system
GOAL SEEKING ANALYSIS
This analysis mainly focuses on the aims and objectives of the institution set by the management or in other words, it can be stated as the goal of the management. They are summarized as follows: The mission and vision of the management is to scale new heights and enhance the brand image of the system. It also aims at providing sophisticated infrastructure, learning platform to grow to a new height. It also aims at conducting activities to enhance the performance to achieve excellence.
OPTIMIZATION ANALYSIS
This kind of analysis in the system is mainly concerned with the qualitative measures of the system. They include standardization of policies related to administrative procedures for the students, proper faculty recruitment procedures as per the norms, designing the infrastructure, facilities to cope up with development of the institution. This is designed so as to maximize the quality output of the students and faculty.
SENSITIVITY ANALYSIS
harmony and the individual goals merge with the organization goals. The above three analyses will greatly act as a decision support system.
RECOMMENDATIONS FOR STUDENTS AND FACULTY
The main objective of the present investigation is to provide recommendations directly to the students, faculty and management with respect to their personalized activities. Several DM techniques have been usedfor this task and the most common are Association-rule mining, Clustering, and Sequential pattern mining. But no work is available where in the classification models are studied. This paper emphasizes a classification model in an integrated way by considering all the above aspects. Here, an estimation of the unknown value of a variable that describes the student/faculty is predicted while in the case of faculty the predicted variables are faculty development, faculty involvement in department and institution activities and faculty behavior. This can be indicated as overall rating of faculty. Classification is a procedure in which individual items are placed into groups based on quantitative information regarding one or more characteristics inherent in the items, which are based on a training set of previously labeled items [3].
DETECTING UNDESIRABLE STUDENT AND FACULTY BEHAVIORS
The objective of detecting undesirable student behavior is to discover/detect those students who have some type of problem or unusual behavior such as erroneous actions, low motivation, playing games, misuse, cheating, dropping out, academic failure, etc. Some of the classification algorithms that have been used to detect problematic student’s behavior are decision tree neural networks, Naive Bayes, Instance-based learning, Logistic regression [5,6]. The objective of detecting undesirable faculty behavior is to discover/detect those faculty who have some type of problem or unusual behavior such as: erroneous actions, low motivation, improper feedback by students, teaching inabilities, attitudes towards superiors, colleagues and students, faculty interest in learning new things etc. Several DM techniques (mainly, classification, and clustering) have been used to reveal these types of faculty [2,3]. The results generated from two modules namely student and faculty, provide guidelines for taking up effective and optimal managerial decisions in the case of a large education institution. This is no doubt an integrated approach which facilitates the prediction of grading of the institution in a systematic manner. Such a kind of analysis requires a detailed study of the classification models with regards to three stake holders. This requires a thorough knowledge of stake holders. Certainly the performance evaluation of the different classifiers on Edu-data is capable of providing such fruitful results in this novel approach.
EXPERIMENTS AND ANALYSIS
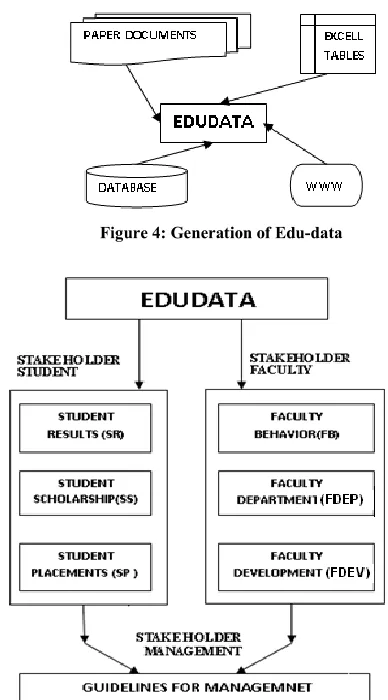
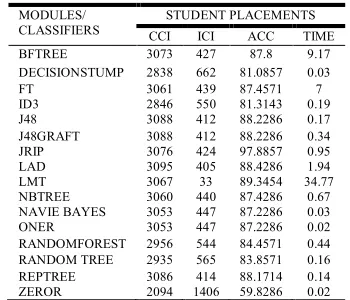
As discussed earlier the main objective of the present investigation is to provide an integrated classification model that facilitates the prediction of grading of the institution in a
[image:3.612.325.519.120.470.2]systematic manner by taking into consideration the respective databases. The steps for generating the edu-data is shown in the figure 4 and modules Edu-mining for TES in figures respectively.
Figure 4: Generation of Edu-data
Figure 5: Edu-mining modules in the integrated approach
DATA SET DESCRIPTION
The following three tables (Table 1, Table 2 and Table 3) present the data set description used in Edu-mining which is self explanatory.
SELECTION OF CLASSIFIERS
For the present investigation, the classifiers[13] considered are: Network Based : Neive Bayes, Rule Based: Jrip, OneR, ZeroR. Decision tree based: BFtree, Decision stump, FT, LADtree, LMT, J48, J48graft, REPtree, Random Tree, Random forest, ID3, NBTree. A brief description of all the classifiers is presented here.
ZeroR-is the simplest classification method, which relies on the target and ignores all predictors. ZeroR classifier simply
Table 1.Attributes of EDUDATA-Faculty Data Set
Attribute Description of attribute and value
Designation Indicates designation of faculty , P/AP/SGl/SL/L
no role in KDD, professor/Asst.Prof/ Selection Grade Lecturer/Senior Lecture/Lecturer
Fbk_stud student feedback for faculty EX/G/AVG/P/VP
Excellent/good/average/poor/very poor
C_report confidential report of faculty by HOD, R/NR/W, recommended/not recommended/waiting
Hghr_qlfn Faculty pursuing higher qualification or not, Yes/No
Dept_act faculty involvement in department activities, More often/seldom, M/S
col_act faculty involvement in collage activities more often/seldom, M/S
teaching_ab teaching skills of faculty by HOD, EX/G/AVG/P/VP Excellent/good/average/poor/very poor
att_sup faculty relationship with superiors, obedient/disobedient, O/DO
att_col faculty relationship with colleagues, co-operative/non cooperative. CO/NC
att_stud faculty relationship with students supportive/non-supportive, S/NS
Projects faculty involvement in external funding agencies, involved/not involved. I/NI
intrst_new aspirations towards learning new things, very good/moderate/marginal, VG/M/Mg
sem_attd seminars attended by faculty, Yes/No
conf_attd conferences attended by faculty, Yes/No
paper_press papers presented by faculty, Yes/No
wrkshp_attd workshop attended by faculty, Yes/No
trng_attd training program attended by faculty, Yes/No
summer_schl summer schools attended by faculty, Yes/No
wintr schl winter schools attended by faculty, Yes/No
acdmc man involvement in academic manual preparation work, Yes/No
text books text books written, Yes/No
univ_actvts involvement in university level activities, Yes/No
intrnl_conf international conference attended by faculty, Yes/No
gest_lectre involvement in guest lectures, Yes/No
CCE involvement in co-curricular activities, Yes/No
Overll_ratng overall performance faculty, EX/G/AVG/P/VP
[image:4.612.314.519.112.188.2]Excellent/good/average/poor/very poor
Table 2. Attributes of EDUDATA-Student Dataset
Attribute Description of attribute and value
Sl.NO. The serial number of the instance, no role in KDD
USN NO Unique ID of student( numeric value)
Name Name of student
Gender M=male /F=female -Gender of the student
Category BCM/SC/GM=caste of student
INCOME ICH/ICL, whether high or low income
SCH_AVAIL YES/NO
SSLC Marks Marks
mode of entry R/D, R= regular, D = Diploma
seat_type CET/MGT/CMK, CET, Management or COMED-K
PUC Pre University marks
aggregate Aggregate Percentage of all eight semesters
Result FCD/FC/SC/PC/FL
Status C/DC, whether a student is continued or discontinued
predicts the majority category (class). Although there is no predictability power in ZeroR, it is useful for determining a
baseline performance as a benchmark for other classification methods.
Table 3. Attributes of of EDUDATA-Intergrated Data set
_____________________________________________________
Attribute Description of attribute and value ________________________________________________
S-RES student result
S_PL student placement
F_BEH faculty behavior
F_DEV faculty development
F_DEPT faculty department
MGT Management
OneR-OneR(One Rule), is a simple, yet accurate, classification algorithm that generates one rule for each predictor in the data, then selects the rule with the smallest total error as its "one rule". To create a rule for a predictor, a frequency table is constructed for each predictor against the target.
JRIP-implements ripper including heuristic global optimization of the rule set. This class implements a propositional rule learner, Repeated Incremental Pruning to Produce Error Reduction (RIPPER), which was proposed by William W. Cohen as an optimized version of IREP. It is based in association rules with reduced error pruning (REP), a very common and effective technique found in decision tree algorithms.
J48-In order to classify a new item, it first needs to create a decision tree based on the attribute values of the available training data. Therefore, whenever it encounters a set of items (training set) it identifies the attribute that discriminates the various instances most clearly.
LMT-Logistic Model Trees A logistic model tree (LMT)[9] is an algorithm which creates a model tree with a standard decision tree structure with logistic regression functions at leaf nodes. In LMT, leaves have a associated logic regression functions instead of just class labels.
Random Forest-is an ensemble classifier that consists of many decision trees and outputs the class that is the mode of the class's output by individual trees. Random Forests grows many classification trees without pruning. Then a test sample is classified by each decision tree and random forest a ssigns a class which have maximum occurrence among these classifications.
J48graft decision tree is a predictive machine-learning model that decides the target value (dependent variable) of a new sample based on various attribute values of the available data.
Random trees-Random trees can deal with both classification and regression problems. the random trees classifier takes the input feature vector, classifies it with every tree in the forest, and outputs the class label that receives the majority of “votes”.
[image:4.612.60.300.113.523.2]Decisionstump-builds one-level binary decision tres for datasets with a categorical or numeric classs , dealing with missing values by treating them as a separate value and extending a third branch from the stump.
NBtree-is a hybrid tree between decision trees and Naïve Bayes. It creates trees whose leaves are Naïve Bayes classifiers for the instances that reach the leaf. When constructing the tree, cross validation is used to decide whether the node should be split further or a naïve Bayes model should be used instead.
LMT-Logistic Model Tree (LMT) Uses regression methods. When fitting the logistic regression functions at a node it uses cross validation to determine how many iterations to run just once and employs the same number throught the tree instead of cross validating at each node. This has a little effect on the accuracy.
LAD-Logical Analysis of Data (LAD) builds a classifier for binary target variable based on learning a logical expression that can distinguish between positive and negative samples in a data set. The basic assumption of LAD model is that a binary point covered by some positive patterns, but not covered by any negative pattern is positive, and similarly, a binary point covered by some negative patterns, but not covered by positive pattern is negative.
FT-Functional trees (FT) which are classification trees that could have logistic regression functions at the inner nodes and/or leaves. The algorithm can deal with binary and multi-class target variables, numeric and nominal attributes and missing values.
RESULTS AND ANALYSIS (STUDENT)
The results of the performance of the 16 classifiers for student stakeholder comprising of three modules Student Scholarships (SS), Student Results (SR), Student Placements (SP) are presented in tables 4, 5 and 6 respectively. It is important to note that each module consists of the same number of instances i.e. 3500 while the number of attributes after feature selection happens to be 9, 7, 6 in SP, SR and SS modules respectively. For each classifier the tables 4, 5 and 6 clearly present the accuracy and time complexity for all the three (SP, SR and SS) modules.
For SS module
REPtree(87.1714%) performs extremely well while others perform equally well
J48GRAFT (87%), JRIP (86.9429%), LAD (86.4857%), LMT (86.4286),
NEIVEBAYES (86.8851%), NBTREE (86.8857%),
[image:5.612.350.520.89.246.2]RANDOMFOREST (86.7714%), RANDOMTREE (86.5143%), REPTREE (87.1714%), BFTREE (86.8857%), FT (86.8571%),
Table 4. Results of Student as a Stake Holder in TES for SS module
MODULES/ CLASSIFIER
STUDENT SCHOLARSHIPS
CCI ICI ACC TIME
BFTREE 3041 459 86.8857 7.06
DECISIONSTUMP 2937 563 83.9143 0.05
FT 3040 460 86.8571 4.5
ID3 2959 485 84.5429 0.06
J48 3044 456 86.9714 0.31
J48GRAFT 3045 455 87 0.02
JRIP 3043 457 86.9429 1.05
LAD 3027 473 86.4857 1.3
LMT 3025 475 86.4286 29.7
NBTREE 3041 459 86.8857 0.55
NAVIE BAYES 3041 459 86.8851 0.03
ONER 2937 563 83.9143 0.02
RANDOMFOREST 3037 463 86.7714 0.34
RANDOM TREE 3028 472 86.5143 0.03
REPTREE 3051 449 87.1714 0.19
[image:5.612.351.520.269.420.2]ZEROR 2015 1485 57.5714 0
Table 5. Results of Student as a Stake Holder in TES for SR module
MODULES/ CLASSIFIERS
STUDENT RESULTS
CCI ICI ACC TIME
BFTREE 3361 139 96.0286 5.86
DECISIONSTUMP 2238 1262 63.9429 0.03
FT 3361 139 96.0286 8.89
ID3 3271 213 93.4571 0.05
J48 3361 139 96.0286 0.03
J48GRAFT 3361 139 96.0286 0.31
JRIP 3359 141 95.9714 0.25
LAD 3271 213 93.4571 2.74
LMT 3361 139 96.0286 39.72
NBTREE 3361 139 96.0286 0.66
NAVIE BAYES 3361 139 96.0286 0.03
ONER 3361 139 96.0286 0.02
RANDOMFOREST 3302 198 94.3429 0.16
RANDOM TREE 3235 265 92.4286 0.02
REPTREE 3359 141 95.9714 0.13
ZEROR 1825 1675 52.1429 0.0
For SR module
BFTREE, FT, J48, J48GRAFT, LMT, NEIVEBAYES, NBTREE, ONER Perform (96.0286%) extremely well others ID3 (93.4571%), LAD (93.4571%), J48 (86.9714%), DECISIONSTUMP (83.9143%), ONER (83.9143%) perform equally well best while zeroR (57.1714%) worst.
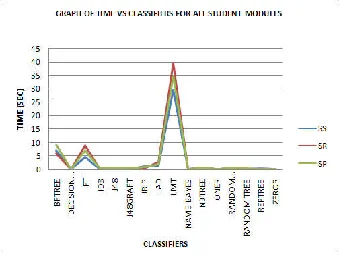
For SP module
[image:5.612.347.522.558.708.2]JRIP (97.8897%) performs best while zeroR (59.8286%) worst.
Table 6. Results of Student as a Stake Holder in TES for SP module
MODULES/ CLASSIFIERS
STUDENT PLACEMENTS
CCI ICI ACC TIME
BFTREE 3073 427 87.8 9.17
DECISIONSTUMP 2838 662 81.0857 0.03
FT 3061 439 87.4571 7
ID3 2846 550 81.3143 0.19
J48 3088 412 88.2286 0.17
J48GRAFT 3088 412 88.2286 0.34
JRIP 3076 424 97.8857 0.95
LAD 3095 405 88.4286 1.94
LMT 3067 33 89.3454 34.77
NBTREE 3060 440 87.4286 0.67
NAVIE BAYES 3053 447 87.2286 0.03
ONER 3053 447 87.2286 0.02
RANDOMFOREST 2956 544 84.4571 0.44
RANDOM TREE 2935 565 83.8571 0.16
REPTREE 3086 414 88.1714 0.14
Figure 6. Graph of Accuracy vs Classifiers
Figure 6, clearly illustrates the performance of the 16 classifiers on student-edu-data comprising three modules. The figure is self explanatory.
Figure 7. Graph of Time vs Classifiers
Figure 7, presents the performance of the 16 classifiers with regards to time complexity on the student–edu-data comprising of three modules. The figure is self explanatory.
RESULTS AND ANALYSIS (FACULTY)
The results of the performance of the 16 classifiers for faculty stakeholder comprising of three modules faculty behavior(FB), faculty development(FDEV), faculty department(FDEP) activities are presented in tables 7, 8 and 9 respectively. It is important to note that, each module consists of the same number of instances i.e. 3526 while the number of attributes after feature selection happens to be 8, 15, 10 in FB, FDEV and FDEP modules respectively. For each classifier, the tables 7, 8, and 9 clearly presents the accuracy and time complexity for all the three modules. From the tables it is found that:
For FB module REPtree(92.2008%) performs extremely well and other classifiers namely J48, BFTREE, J48GRAFT perform equally well , while ZeroR(32.6716%) worst.
For FDEV module J48, JRIP, perform(94.0442%) extremely well and other extremely classifiers namely REPTREE(93.9875%),RANDOMFOREST (93.8174%), RANDOMTREE(93.8174%) perform equally well while zeroR(32.6716%) performs worst.
[image:6.612.338.532.153.314.2]for FDEP module NBTREE(88.0885%) performs extremely well and other classifiers namely REPTREE(87.8332%), J48(87.1809), BFTREE(86.8406%), LMT(86.4152%) and RANDOMFOREST(86.4436%) perform equally best while zeroR (32.6716%) worst.
Table 7: Faculty as a Stake Holder in TES for FB module
MODULES/ CLASSIFIER
FACULTY BEHAVIOR
CCI ICI ACC TIME
BFTREE 3216 310 91.2082 3.44
DECISIONSTUMP 1412 2114 40.0454 0
FT 3210 316 91.038 9.92
ID3 3204 322 90.8678 0.19
J48 3245 281 92.0306 0.22
J48GRAFT 3245 281 92.0306 0.28
JRIP 3191 335 90.4991 1.02
LAD 2674 852 75.8336 1.77
LMT 3203 323 90.8395 296.74
NBTREE 2483 1043 70.4197 0.02
NAVIE BAYES 3247 279 92.0874 1.88
ONER 1604 1922 45.4906 0
RANDOMFOREST 3203 323 90.8395 0.55
RANDOM TREE 3204 322 90.8678 0.02
REPTREE 3251 275 92.2008 0.19
[image:6.612.95.265.270.401.2]ZEROR 1152 2374 32.6716 0
Table 8. Faculty as a Stake Holder in TES for FDEV module
MODULES/ CLASSIFIERS
FACULTY DEVELOPMENT
CCI ICI ACC TIME
BFTREE 3125 401 88.6273 4.63
DECISIONSTUMP 1524 2002 43.2218 0
FT 3114 412 8.3124 8.31
ID3 3315 211 94.0159 0.27
J48 3316 210 94.0442 0.22
J48GRAFT 3136 390 88.9393 0.28
JRIP 3316 210 94.0442 1.25
LAD 2583 943 73.2558 1.49
LMT 3117 409 88.4005 113.75
NBTREE 2031 1495 57.6007 0.03
NAVIE BAYES 3048 478 86.4436 3.34
ONER 1606 1920 45.5474 0.03
RANDOMFOREST 3308 218 93.8174 0.27
RANDOM TREE 3308 218 93.8174 0.05
REPTREE 3314 212 93.9875 0.19
ZEROR 1152 2374 32.6716 0
[image:6.612.337.532.340.507.2].
Table 9. Faculty as a Stake Holder in TES for FDEP module
MODULES/ CLASSIFIERS
FACULTY DEPARTMENT
CCI ICI ACC TIME
BFTREE 3062 464 86.8406 4.78
DECISIONSTUMP 1606 1920 45.5474 0.02
FT 3031 495 85.9614 12.44
ID3 3026 500 85.8196 0.13
J48 3074 452 87.1809 0.16
J48GRAFT 1733 1793 49.1492 0.02
JRIP 3000 526 85.0822 0.95
LAD 2728 798 77.3681 1.36
LMT 3047 479 86.4152 125.48
NBTREE 2161 1365 61.2876 0
NAVIE BAYES 3106 420 88.0885 1.98
ONER 1733 1793 49.1492 0.02
RANDOMFOREST 3048 478 86.4436 0.25
RANDOM TREE 3026 500 85.8196 0.02
REPTREE 3097 429 87.8332 0.08
[image:6.612.343.530.534.705.2]Figure 8, clearly illustrates the performance of the 16 classifiers on faculty-edu-data comprising three modules. The figure is self explanatory,
Figure 8. Graph of Accuracy vs Classifiers for all faculty modules
Figure 9. Graph of Time vs Classifiers for all faculty modules
Figure 9, presents the performance of the 16 classifiers with regards to time complexity on the student–edu-data comprising of three modules. The figure is self explanatory.
RESULTS AND ANALYSIS (INTEGRATED)
The results of the performance of the 16 classifiers for the present integrated approach in TES is presented in table 10. The integrated system comprises of three stake holders namely student, faculty and management with 3 and 1 modules respectively. Here the data set consists of 3500 instances. For each module and the number of attributes are as mentioned earlier. This integrated approach is unique and very effective in predicting optimal managerial decisions at right time. This model is generic and can be applied to any higher or secondary education system. Of the 16 classifiers LAD(99%) and LMT(99%) perform extremely well while other classifiers perform equally well. The performance of other classifiers are as follows :
BFTREE(98.9714%),DECISIONSTUMP(98.1143%),FT(99.0 571%), ID3(98.9143%),J48(98.9714%),
J48GRAFT(96.5667%),JRIP(98.9714%),
NAIVEBAYES(99.0286%),NBTREE(99.0286%), ONER(98.6286%),
RANDOMFOREST(98.9143%),(98.9714%),
RANDOMTREE,REPTREE(98.9143%), ZEROR(91.0857%)
Figure 10, presents the performance of 16 classifiers on the integrated Edu-data(TES) which comprises of 7 modules and
with the total number of attributes as 9,7,6,8,5,10 and 6 respectively. The figure is self explanatory.
Table 10: Results of Integrated approach in TES
MODULES/ CLASSIFIER
INTEGRATED APPROACH IN TES
CCI ICI ACC TIME
BFTREE 3464 36 98.9714 1.5
DECISIONSTUMP 3464 66 98.1143 0.02
FT 3467 33 99.0571 3.69
ID3 3462 34 98.9143 0.03
J48 3464 36 98.9714 0.09
J48GRAFT 3463 37 96.5667 12.04
JRIP 3464 36 98.9714 0.52
LAD 3465 35 99 2.09
LMT 3465 35 99 36.33
NBTREE 3466 34 99.0286 0.02
NAVIE BAYES 3466 34 99.0286 0.86
ONER 3452 48 98.6286 0
RANDOMFOREST 3462 38 98.9143 0.14
RANDOM TREE 3464 36 98.9714 0.02
REPTREE 3462 38 98.9143 0.05
ZEROR 3188 312 91.0857 0
Figure 10. Graph of accuracy vs classifiers
Figure 11, presents the performance of 16 classifiers on the integrated Edu-data (TES) with regards to time complexity which comprises of 7 modules and with the total number of attributes as 9,7,6,8,5,10 and 6 respectively. The figure is self explanatory.
Figure 11. Graph of Time vs Classifiers
CONCLUSIONS
3526 instances with 24 attributes for faculty stakeholder and 3500 instances with 6 attributes for management stakeholder respectively. The investigation was carried out with an objective to provide effective managerial decisions in a technical institutions. The experiments on the Integrated Edudata(Student-Faculty-management were performed for all the seven different types of modules by applying 16 different classifiers from the three classification techniques namely: rule based, tree based and network based. The results are found to be quite interesting and of great practical importance. The structural aspects of the results provide a better platform for taking right decisions at right time from the management perspective. A comparative study of different classifiers is done to decide the effectiveness and efficiency of the system.
No work is available with regards to the present study. Hence, the present investigation is carried out by using integrated approach to study the technical education system. The performance evaluation of different classifiers on Integrated Edu-data(Student-Faculty-Management) is done effectively in order to achieve excellent improvement in teaching, learning and administration of the system. Finally, it is concluded that the present integrated model is a generic model which can be implemented for any higher or secondary education system. This innovative model provides an excellent and effective platform for making optimal managerial decisions at right time.
ACKNOWLEDGEMENT
One of the authors Mrs. Malini M Patil acknowledges J.S.S Academy of Technical education, Bangalore, Karnataka and Bharatiyar University, Coimbatore, Tamilnadu, India for providing the facilities for carrying out the research work.
REFERENCES
[1] Cristobal Romero, Sebastian Ventura,” Education Data mining A Review of the state of Art”, IEEE Transactions on Systems, Man and Cybernetics 2006, Vol 0, No. 6
[2] Srimani P.K, Malini M Patil, “ Eduminig: A Machine learning approach”AIP. Conf. Proc. 1414.pp.61-66.
[3] Srimani P.K, Malini M Patil, “ A classification Model for Eduminig ICICS-2012. PSRC, Proc. Page 35-40. [4] Srimani P.K, Malini M Patil,” A Comparative Study of
Classifiers for Student Module in Technical Education System(TES)”, IJCR, Vol. 4, Issue 01, pp.249-254, Jan-2012.
[5] Knauf, R. Boeck, Y. Sakurai, S. Dohi, and S. Tsuruta, “Knowledge mining for supporting learning processes”, Proc. Of the 2008 IEEE International Conference on Systems, Man, and Cybernetics (SMC 2008)}, Singapore, IEEE Catalog Number CFP08SMC-USB, ISBN 978-1-4244-2384-2, Library Of Congress: 2008903109.
[6] Y. Sakurai, S. Dohi, S. Tsuruta, and R. Knauf, R., “Modeling Academic Education Processes by Dynamic Storyboarding”, Journal of Educational Technology & Society”, vol. 12, ISSN 1436-4522 (online) and 1176-3647 (print), International Forum of Educational Technology & Society (IFETS), 2009, pp. 307-333. [7] H. Gardner, Frames of Mind: The Theory of Multiple
Intelligences. 1993, Basic Books.
[8] R.M. Felder and L.K. Silverman, “Learning and Teaching Styles in Engineering Education”, 78(7), 1988, pp. 674-681.
[9] Senol Zafer ERDOGAN, Mehpare TIMOR, ”A Data Mining Application in a Student Database”. Journal of Aeronautics and Space Technologies. Vol 2, No 2, pp, 53-57.
[10] Cesar Vialardi, Javier Bravo, Leila Shafti, Avlao Ortigosa, “ Recommendation in Higher Education using Data Mining Techniques” . Journal of Education Data mining, 2009, pp 192-1999.
[11] Shaeela Ayesha, Tasleem Mustafa, Ansar Raza Satter, M Inayat Khan, “ Data Mining Model for Higher Education “ European journal of scientific research. Vol 43, No(1) 2010, pp 24-29.
[12] Ryan J.D. Baker and Kalina Yacef, “The State of Education Data mining : A Review and Future Visions “. Journal of Education Data mining. 2009, Vol ,1 Issue 1, pp 3-17.
[13] Ian H. Witten and Eibe Frank “Data Mining :Practical Machine Learning Tools and Techniques , Second Edition,2008, Morgon Kaufman Publishers.