RESEARCH ARTICLE
ADSORPTION OF BISMARCK BROWN ONTO ACTIVATED CARBON FROM
CORN COBS
Valarmathy, K*., Gokulakrishnan, M., Amritha Bhat. K.,
Department of Biotechnology, The oxford college of Engineering, Bommanahalli,
Bangalore-560068
ARTICLE INFO ABSTRACT
Adsorption of a basic dye, Bismarck brown, from aqueous solutions onto acid activated corncobs was investigated. Various experiments were undertaken in a batch adsorption technique to study the effect of the process variables, which include initial pH, ads
dye concentration, particle size, temperature and agitation speed. The adsorption of Bismarck brown on to the adsorbent was found to improve with the increase in adsorbent dosage, finer the mesh size and at a neutral pH (value rangin
adsorption was better with increasing temperatures and the process was endothermic with a
followed was first order in nature. The results showed that both Langmuir and Freundl
results revealed that activated carbon from corncob, a waste material, proved to be an excellent low
INTRODUCTION
Colored compounds comprising pigments and dyes are used widely in textile and leather dyeing, paper, printing, pharmaceutical and cosmetic industries. 10,000 different dyes weighing about 0.7 million tons are produced annually for various industrial processes (Zollinger, 1987). A percentage of these dyes are lost in the effluent during the dyeing process. Many of these are toxic or even
carcinogenic (Rnmin Gong et al., 2005). Discharge
of these into water bodies would pollute the water
*Corresponding author:[email protected]
and make it unfit for aquatic life by their toxicity. Further, the dyes would color the water and make penetration of sunlight to the lower layers impossible. So, it is not possible for aquatic plants to perform photosynthes
1996)
animals but also harms the environment. Majority of these dyes are stable to light and oxidation. They are immune to aerobic digestion. Biological treatment may remove BOD, COD and su
solids but remains ineffective in removing the color of dyes. Many physical methods such as adsorption, coagulation, precipitation and filtration have been attempted for treatment of dye
ISSN:
0975-833X
International Journal of Current Research
Vol. 33, Issue, 2, pp.017-023, February,
Key words: Basic dye Bismarck brown Aqueous solutions Initial pH
Adsorbent dosage Article History:
Received 15th, September, 2010 Received in revised form 30th, October, 2010
Accepted 25th December, 2011 Published online 11th February, 2011
ARTICLE
ADSORPTION OF BISMARCK BROWN ONTO ACTIVATED CARBON FROM
CORN COBS
Amritha Bhat. K., Salma Kausar, M. and Kusumpaul
The oxford college of Engineering, Bommanahalli,
560068
Adsorption of a basic dye, Bismarck brown, from aqueous solutions onto acid activated corncobs was investigated. Various experiments were undertaken in a batch adsorption technique to study the effect of the process variables, which include initial pH, adsorbent dosage, initial dye concentration, particle size, temperature and agitation speed. The adsorption of Bismarck brown on to the adsorbent was found to improve with the increase in adsorbent dosage, finer the mesh size and at a neutral pH (value ranging from 6-8). It was observed that the adsorption was better with increasing temperatures and the process was endothermic with a H value of 35.698KJ/mole and the kinetics followed was first order in nature. The results showed that both Langmuir and Freundlich isotherms fit the equilibrium data. Also, the results revealed that activated carbon from corncob, a waste material, proved to be an excellent low-cost sorbent.
and make it unfit for aquatic life by their toxicity. Further, the dyes would color the water and make penetration of sunlight to the lower layers impossible. So, it is not possible for aquatic plants to perform photosynthesis (Reife and Fermann, 1996). Polluted water not only damages plants and animals but also harms the environment. Majority of these dyes are stable to light and oxidation. They are immune to aerobic digestion. Biological treatment may remove BOD, COD and suspended solids but remains ineffective in removing the color of dyes. Many physical methods such as adsorption, coagulation, precipitation and filtration have been attempted for treatment of dye
ternational Journal of Current Research 023, February, 2011
INTERNATIONAL JOURNAL OF CURRENT RESEARCH
containing effluent. Chemical methods such as oxidation have also been used. Biological methods would be economically simple but most dyes are resistant to bacterial degradation (Reife and Fermann, 1996).
The potential of various methods have been explored and adsorption of the chemical dyes has been found to be the most effective. Commercially available activated carbon as an adsorbent has yielded excellent results (Walker and Weatherly, 1998). However, taking into account the high costs involved in such a process, feasibility of alternate adsorbents have been studied. These include industrial as well as agricultural byproducts. Industrial waste products include slurry from fertilizer plant and blast furnace slag. A variety of agricultural products have been used namely rice straw, coconut husk, rice husk, bagasse and tree
bark (Gupta et al., 2003). In a country like India
where agriculture is the primary occupation, corncobs, an agricultural waste is abundantly available. There is need to develop cost effective low cost adsorbent from waste biomass. The area under maize cultivation in India is 6.5 million hectare with a production of 11.8 million tons (Anon, 2004). Dissection of five maize plants of single variety shows that grain represents 38% of the biomass (dry weight basis), 16% cobs and ear husks, remaining 46% consists of leaves, sheaths and stalks (Anon, 2004). Presently, the cobs alone are used in making paper, light packing material, fuel, smoking products and as a source of charcoal. Here we are reporting preparation of low cost active adsorbents from corncobs waste biomass and its utilization in removal of color (Bismarck brown as a model dye) from simulated dye bath effluents.
MATERIALS AND METHODS
Materials
Bismarck brown a cationic dye was supplied by S.D.Fine Chemicals, India. Sodium hydroxide, hydrochloric acid, and sulfuric acid were received from E.Merck Limited Mumbai, India. Preparation of activated carbon from corn cobs biomass. Corncobs, which has been used as the sorbent in this study was obtained from local agricultural field
(after grains being removed) and the waste cob alone was cut into pieces and activated by soaking it in concentrated sulfuric acid 1:2 (w/v) for 48 hours. The charred material was then removed, washed several times to remove the excess acid and soaked in distilled water for 24 hours till its wash water attained neutral pH. The water was then drained off and the material was dried in a hot
air oven at a temperature of 110oC till moisture was
completely removed. The dried material was then ground using mortar and pestle. The activated carbon thus obtained was then sieved into three different sizes, which are, 100 mm size, 36 mm size and 18mm sizes. These samples were stored in separate airtight containers free from moisture until further use.
Batch adsorption experiments
Stock solution of 5000 ppm was prepared by dissolving appropriate amount of Bismarck brown
and further dilutions were made to get particular
concentrations of adsorbate in the batch
experiments. Adsorption experiments were
conducted in a batch reactor system. An orbital shaker, Orbitek, Scigenics (Biotech. Pvt Ltd, Chennai, India) was used for the experiments. The
temperature was set at 30oC and the agitation speed
dosage in each mesh size was thereafter standardized. To understand the maximum uptake of the adsorbent and its behavior at very high dye concentrations, solutions of various concentrations ranging from 1 ppm to 5000 ppm were prepared in separate 100ml conical flasks. The standardized adsorbent dosage of 100 mm size was transferred into each of the conical flasks. These flasks were placed in the orbital shaker for 24 hours and the readings were taken after centrifuging. To study the effect of agitation, agitation speed was varied from 50 rpm to 200 rpm for a single concentration of dye of the same volume. Samples were withdrawn at intervals to understand the rate at which equilibrium is reached.
Adsorption Kinetics
Kinetic Study is important to study the rate of the adsorption process and understand when the steady state condition is reached after equilibrium. 250 ml
Bismarck brown dye solution of varying
concentrations, 50 ppm, 100 ppm, and 300 ppm were prepared and transferred into separate 250 ml conical flasks. The standardized adsorbent dosage of 100 mm mesh size adsorbent was transferred into each of the conical flasks and kept in an orbital shaker. Samples were withdrawn for every 5 minutes initially and centrifuged. The time gap for the withdrawal of successive samples was increased to 15 minutes, half an hour, 1 hour, and 2 hours and so on. The flasks were kept in the shaker for a total period of 360 minutes, to allow complete equilibration even for high concentrations. The samples thus obtained were withdrawn and centrifuged. The percentage removal of dye from solution is then analyzed
Analysis of dye
The concentration of Bismarck brown dye before and after the adsorption processes were monitored using UV-visible spectrometer (Shimadzu 2101
PC)) at λmax 516 nm.
RESULTS AND DISCUSSION
Variation in pH
pH studies are initially done to standardize the pH
at which the adsorption studies should be carried out.
0 2 4 6 8 10 12
90.0 92.5 95.0 97.5 100.0
%
ad
sorbe
d
Initial aquoeus phase pH Particle size
100 mesh 36 mesh 18 mesh
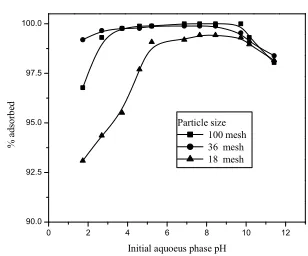
[image:3.504.279.433.73.201.2]Fig. 1. Effect of pH with initial concentration of 10 ppm, 10
ml solution, 300C, 100 rpm
0.0 0.2 0.4 0.6 0.8 1.0
98.6 98.8 99.0 99.2 99.4 99.6 99.8 100.0
%
ads
or
bed
Adsorbent dosage, g Particle size,
100 36 18
[image:3.504.279.436.253.377.2]
Fig. 2. Variation in adsorbent dosage with initial dye concentration of 10 ppm, 10 ml solution, 300C, 100 rpm,
neutral pH.
0 1000 2000 3000 4000 5000 0
20 40 60 80 100
%
ad
sorbe
d
Concentration (ppm) Particle size,
100 36 18
Fig. 3. Variation in initial dye concentration, 0.2g sizes, 1 ml solution,adsorbent for 100 mm, 0.3 g for 36 mm and 0.5 g
0.0 0.5 1.0 1.5 2.0 2.5 3.0 3.5 4.0 0.0
0.5 1.0 1.5 2.0 2.5 3.0 3.5 4.0 4.5
log
x
[image:4.504.53.295.63.590.2]log c
Fig. 4. Freundlich Isotherm
0 20 40 60 80 100
0.00 0.05 0.10 0.15 0.20
1
/x
1/c
Fig. 5. Langmuir Isotherm
0 50 100 150 200 250
92 93 94 95 96 97 98 99 100
%
ad
sorb
ed
Time (min) Effect of agitation, rpm
[image:4.504.273.436.79.214.2]50 100 150 200
Fig. 6. Effect of agitation speed, 100mm size, 5g adsorbent, 300 ppm.
0 50 100 150 200 250 300 350 400
-3.4 -3.2 -3.0 -2.8 -2.6 -2.4 -2.2 -2.0 -1.8 -1.6 -1.4 -1.2 -1.0 -0.8 -0.6 -0.4 -0.2 0.0 0.2
lo
g (
qe -qt
)
Time (min)
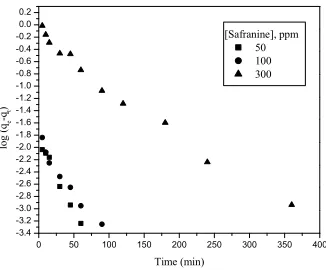
[image:4.504.273.438.269.397.2][Safranine], ppm 50 100 300
Fig. 7. Pseudo first order kinetics, 100 rpm, 250 ml, neutral pH, 5g adsorbent, neutral pH.
0 200 400 600 800 1000 1200 1400 1600 1800 2000 50
60 70 80 90 100
%
ad
sor
ptio
n
Time (min) Effect of temperature, 0
C 18
25 35 45
Fig. 8. Effect of temperature, 300 ppm, 100 rpm, 5g adsorbent, neutral pH
It was evident that the adsorbent showed best adsorption in neutral pH ranging from 6 to 8 as shown in graph. The experiment was repeated for 36 mm size and 18 mm sizes and a similar trend was seen in both the cases. Hence it was concluded that the adsorbent worked best in a neutral pH range. The reason could be because the basic dye becomes protonated in acidic medium and deprotonization takes place as the pH is increased. It remains almost constant for a pH range from 6-8 and thereafter there is a fall in the percentage removal .A similar kind of result is seen in
[image:4.504.47.215.421.583.2]Variation in adsorbent dosage
Increasing the adsorbent quantity provides more adsorption sites for the dye. As the adsorbent dosage increases, the available sites increase and consequently better the adsorption. However, review of literature reveals that with increasing dosage, the efficiency is not observed to increase in linear proportion. Records show that only up to certain stage there is linear relationship, beyond which there is only marginal raise in the percentage of dye removal. It is in this context, optimum
adsorbent dosage requires standardization
(Khanidtha Marungrueng and Prasert Pavasant, 2005). It was seen that 0.2g for 100 mm size, 0.3g for 36 mm size and 0.5 g for 18 mm mesh size for 10ml dye solution of 10 ppm was the optimum adsorbent dosage. This amount of adsorbent was standardized for further experiments.
Variation in initial concentration
The adsorbent had the capacity to remove up to 90% color even for a concentrated solution of 3000 ppm for the adsorbent mesh size of 100 mm. Almost 50% color removal was seen for 3000 ppm when the adsorbent mesh size used was 18 mm. The adsorbent was capable of color removal at very high concentrations as shown in graph.
Adsorption Isotherms
The two isotherms used to describe the adsorption process are Langmuir and Freundlich. The Langmuir model is based on the assumption that maximum adsorption corresponds to saturated monomolecular layer of dye molecules on the surface of the adsorbent. Langmuir isotherm is applicable to homogeneous sorption where the sorption onto each active site has equal activation energy. Freundlich isotherm is an empirical. It assumes that the sites on the surface of the adsorbent have different binding energies. It is employed to describe heterogeneous systems.
Langmuir Isotherm is given as:
Q = Qmax bCf
1+bCf (1)
Where Qmax is the maximum dye uptake (mg/g), Cf
is the equilibrium dye concentration (mg/l) solution
and b is the Langmuir equilibrium constant (dm
-3
/mg) which relates to adsorption energy. For fitting the experimental data, the Langmuir model is linearized as follows (Langmuir, 1916).
1/Q = 1/ Qmax + 1/ b Qmax Cf (2)
The Freundlich model is given by:
Q= KCf
1/n
(3)
where K (dm-3/mg) and n are constants indicative
of adsorption capacity and intensity respectively. For fitting the experimental data, the Freundlich
model is linearized as follows, ln Q = ln K + 1/n
ln Cf (Freundlich, 1906). The data for variation in
concentration fitted both the above mentioned isotherms and the values of the Langmuir and
Freundlich isotherms are as reported in
Table1. The fit for Freundlich and Langmuir
isotherms are as shown in Fig.4 and Fig. 5.
Effect of particle size
Finer the particle size, larger the surface area, better the area of contact between the adsorbate and adsorbent and hence better the adsorption capacity. There is a tendency that smaller particles take shorter time to equilibrate (Freundlich, 1906;
Vasanth Kumar et al., 2005; Reyad et al., 2003). It
is evident that 100 mm mesh size when compared to 36 mm size and 18 mm sizes showed better adsorption characteristics.
Kinetics study
The kinetic study for any experiment provides useful data regarding the efficiency of the process and feasibility for scale up operations. It represents the rate of adsorbate uptake by the adsorbent
(Vasanth Kumar et al., 2005). The pseudo first
order rate equation (Lagergren, 1898) is used to describe the process and given as follows:
Dqt/dt = k1(qe-qt) (4)
Where qe and qt are the adsorption capacities at
equilibrium and time t respectively (mg/g) K1 is the
integration with limits from t= 0 to t and q1= 0 to
q1, we have
log(qe-qt)= log(qe)-((k1/2.303)*t). (5)
The values of k for the varying concentration are as shown in Table 2. Also, the fit for pseudo First order reaction is as shown in Figure 6.
Effect of agitation
Varying the speed of agitation can always vary the rate of adsorption. By increasing the speed, the randomness increases which results in better contact between the adsorbate and adsorbent and hence enhancing faster rate of adsorption. It is quite obvious that adsorption should be better at
higher speeds (Namasivayam et al., 2004). A
similar trend was followed in this case. The effect of agitation is as shown in Figure 8.
Effect of adsorption with temperature
Whether a process is endothermic or exothermic, it
depends on the value of H. Here, the value of H
was found to be positive and hence the reaction involved is endothermic. Also the negative value of
G indicates the spontaneous nature of adsorption
of Bismarck brown on corncobs. The rate of
adsorption at 180C, 250C, 300C, 350C and 450C
temperatures was studied by withdrawing samples at specific time intervals. Interestingly, it was seen that as temperature increases the rate of adsorption got quicker. The process was hence concluded to be endothermic and spontaneous. The effect of temperature is as shown in Figure 7.
Thermodynamics of adsorption
The kinetics of the rate of adsorption was assessed
at different temperatures of 200C 300C and 400C.
Thermodynamic parameters G, S and H were
calculated using the following equations and the values are as shown in Table 3. The negative
values of G0 indicate the spontaneous nature of
adsorbent on the dye. The positive values of H0
confirm the endothermic nature of adsorption
(Gupta et al., 2003).
G0 = -RTlnK (6)
H0=-R((T2T1)/(T2-T1))ln(K2/K1) (7)
S0 = (H- G)/T (8)
where K1 and K2 are the Langmuir constants
corresponding to the temperatures 200C and 400C.
Determination of activation energy for adsorption process.
The rate of a reaction depends on the temperature in which it is carried out. As the temperature increases, randomness increases and hence the molecules tend to collide more frequently. The molecules also carry more kinetic energy. In 1889, SvanteArrhenius showed that the relationship between temperature and the rate constant for a reaction obeyed the following equation.
k= Ze-Ea
/RT
(9)
where k is the constant for the reaction, Z is a proportionality constant that varies from one
reaction to another, Ea is the activation energy for
the reaction and R is the universal gas constant in J/ mole K, T is the temperature in Kelvin. This equation can be used to determine the activation energy for the adsorption process. On taking natural logarithm on both sides we get,
ln k=ln Z-Ea/RT (10) or
ln k= (Ea/RT)(1/T) + ln Z. A plot of ln k vs 1/T
should give a straight line with a slope of –Ea/R as
shown in Figure 9. The value of Ea hence
calculated was found to be 114.62 KJ/mole.
Conclusions
The studies revealed that activated corncobs proved to be a good low-cost adsorbent. Freundlich and Langmuir isotherms fitted the data well. The thermodynamic studies showed that the process was endothermic and spontaneous and the kinetic data showed that the adsorption followed first order kinetics
REFERENCES
Rnmin Gong, Yingzhi Sun, Jain Chen, Huijun Liu and Chao Yang. 2005. Effect of chemical modification on dye adsorption capacity of
peanut hull. Dyes and Pigments, 67:175-181.
Reife, A. and Fermann, H.S. 1998. Environmental Chemistry of Dyes and Pigments, Wiley, 1996
G. M. Walker, L.R Weatherly. Environmental
Pollution, 99 : 133.
Gupta, V.K., Ali, I., Suhas, and Dinesh Mohan.
2003. Equilibrium uptake and sorption
dynamics for the removal of a basic dye (basic
red) using low cost adsorbents. Journal of
Colloidal Science and Interface, 265: 257-264. Anon. 2004. http://agricoop.nic.in/ statatglance
2004/atglance.pdf
Khanidtha Marungrueng, Prasert Pavasant, 2005. Removal of basic dye (Astrazon Blue FGRL)
using microalga Caulerpai litillifera.Journal of
Environmental Management, 1-7.
Langmuir, I. 1916. Journal of American Chemical Society, 38:2221-2295
Freundlich, H.M.F. 1906. Zeitschrift Fur
Physikalische Chemie (Leipzig) 57 A: 385-470.
Vasanth Kumar, K., Sivanesan, S. and
Ramamurthy, V. 2005. Adsorption of malachite green onto pithophorasp., a fresh water algae: equilibrium and kinetic modeling. Process Biochemistry 40: 2865-2872.
Erhan Demirbas, Mehmet Kobya, Elif Sentrurk and Tunacy Ozkan, 2004. Adsorption kinetics for the removal of chromium VI from aqueous solutions on the activated carbons prepared from agricultural wastes.Water SA 30: 4. Vasanth Kumar, V., Ramamurthy, S. and
Sivanesan, 2005. Modelling the mechanism involved during the sorption of methylene blue onto flyash, Journal of Colloid and Interface Science 284: 14-21.
Namasivayam, C., Dinesh Kumar, M., Selvi, K., Ashruffunissa Begum, R., Vanathi, T. and Yamuna, R.T. 2004. Waste Coir Pith- a potential biomass for the treatment of dyeing waters. Biomass and Bioenergy 21: 447-483.
Reyad, A. Shawabkeh, Maha F. Tutunji,
2003.Experimental study and modeling of basic dye sorption by diatomaceous clay. Applied Clay Science 24: 111-120.