University of Warwick institutional repository: http://go.warwick.ac.uk/wrap
A Thesis Submitted for the Degree of PhD at the University of Warwick
http://go.warwick.ac.uk/wrap/61777
This thesis is made available online and is protected by original copyright. Please scroll down to view the document itself.
AUTHOR:Reza Ghaffari DEGREE: Ph.D.
TITLE:Non-destructive Detection of Diseases Using Plant Emitted Volatiles
DATE OF DEPOSIT: . . . .
I agree that this thesis shall be available in accordance with the regulations gov-erning the University of Warwick theses.
I agree that the summary of this thesis may be submitted for publication.
I agree that the thesis may be photocopied (single copies for study purposes only).
Theses with no restriction on photocopying will also be made available to the British Library for microfilming. The British Library may supply copies to individuals or libraries. subject to a statement from them that the copy is supplied for non-publishing purposes. All copies supplied by the British Library will carry the following statement:
“Attention is drawn to the fact that the copyright of this thesis rests with its author. This copy of the thesis has been supplied on the condition that anyone who consults it is understood to recognise that its copyright rests with its author and that no quotation from the thesis and no information derived from it may be published without the author’s written consent.”
AUTHOR’S SIGNATURE: . . . . USER’S DECLARATION
1. I undertake not to quote or make use of any information from this thesis without making acknowledgement to the author.
2. I further undertake to allow no-one else to use this thesis while it is in my care.
DATE SIGNATURE ADDRESS
. . . .
Non-destructive Detection of Diseases
Using Plant Emitted Volatiles
by
Reza Ghaffari
Thesis
Submitted to the University of Warwick
for the degree of
Doctor of Philosophy
School of Engineering
To my Father, Mohammadreza Mother, Mahnaz
Contents
List of Tables ix
List of Figures x
Acknowledgments xvi
Declarations xviii
Publications and Presentations xix
Abstract xxii
Abbreviations xxiv
Chapter 1 INTRODUCTION 1
1.1 Chapter Overview . . . 1
1.2 Background . . . 1
1.3 Greenhouses . . . 3
1.4 Problem Description and Motivations . . . 5
1.5 Research Aim and Objectives . . . 7
1.6 Scope and Delimitation . . . 8
1.7.1 Chapter Two . . . 9
1.7.2 Chapter Three . . . 10
1.7.3 Chapter Four . . . 10
1.7.4 Chapter Five . . . 10
1.7.5 Chapter Six . . . 10
1.7.6 Chapter Seven . . . 11
1.8 Summary . . . 11
1.9 References . . . 12
Chapter 2 Plant Disease Detection: Tools and Methods 15 2.1 Chapter Overview . . . 15
2.2 Introduction . . . 16
2.3 Plant Diseases . . . 17
2.4 Greenhouse Diseases . . . 18
2.5 Disease Symptoms . . . 19
2.6 Disease Diagnosis . . . 21
2.7 Molecular Techniques . . . 22
2.7.1 Enzyme-linked Immunosorbent Assay (ELISA) . . . 23
2.7.2 Polymerase Chain Reaction (PCR) . . . 24
2.7.3 Limitations and boundaries . . . 25
2.8 Non-Destructive Methods . . . 26
2.8.1 Spectroscopic and Imaging Techniques . . . 27
2.8.2 Fluorescence Spectroscopy . . . 27
2.8.3 Visible and Infrared Spectroscopy . . . 29
2.8.4 Limitations and Boundaries . . . 31
2.9.1 VOCs and Plant Defence . . . 33
2.10 VOCs and Disease Indication . . . 33
2.11 VOCs and GC-MS Based Analysis . . . 35
2.11.1 Limitations and Boundaries . . . 36
2.12 Summary . . . 37
2.13 References . . . 38
Chapter 3 Pragmatic Approach To Plant VOC Analysis Via Gas Sensors 52 3.1 Chapter Overview . . . 52
3.2 Introduction . . . 53
3.3 Electronic Nose . . . 53
3.4 Field Asymmetric Ion Mobility Spectrometry (FAIMS) . . . . 55
3.5 Sampling Procedures . . . 56
3.5.1 Static Collection . . . 57
3.5.2 Pull Only . . . 58
3.5.3 Push & Pull . . . 58
3.6 Experimental Design at University of Warwick . . . 61
3.6.1 Plant Glass Chamber . . . 61
3.6.2 Watering System . . . 63
3.6.3 Air Circulation . . . 64
3.6.4 Pumps and Tubing . . . 65
3.6.5 Filters . . . 65
3.6.6 Environmental Factor Data Loggers and Probes . . . . 65
3.6.7 Lighting System . . . 68
3.7.1 Tomato (Solanum lycopersicum) . . . 68
3.7.2 Powdery Mildew and Spider Mites . . . 69
3.8 Inoculation Procedures . . . 69
3.9 Visual Observation of Infection Symptoms . . . 70
3.10 Sampling Procedure . . . 71
3.11 Data Acquisition . . . 72
3.11.1 EN . . . 72
3.11.2 FAIMS . . . 73
3.12 Summary . . . 74
3.13 References . . . 75
Chapter 4 Non-destructive Plant VOC analysis using Electronic Nose 84 4.1 Chapter Overview . . . 84
4.2 Introduction . . . 85
4.3 EN Sensors . . . 87
4.4 EN Sampling . . . 89
4.5 EN’s Data Structure . . . 90
4.6 Data Analysis . . . 91
4.6.1 Principal Component Analysis (PCA) . . . 94
4.6.2 K-Means . . . 97
4.6.3 Linear Discriminant Analysis . . . 100
4.7 Second Set of Experiments . . . 101
4.7.1 Feed-Forward Neural Networks . . . 102
4.7.2 Generalisation . . . 104
4.7.3.1 Linear Kernel . . . 109
4.7.3.2 Polynomial Kernel . . . 110
4.7.3.3 Multiclass SVM . . . 111
4.7.3.4 SVM Advantages and Disadvantages . . . 113
4.7.4 Discussion . . . 113
4.7.5 Summary . . . 115
4.8 References . . . 116
Chapter 5 Non-destructive Plant Disease Detection using Field Asymmetric Ion Mobility Spectrometry 125 5.1 Chapter Overview . . . 125
5.2 Introduction . . . 126
5.2.1 Ion Mobility Spectrometry (IMS) . . . 126
5.2.2 High-Field Asymmetric Ion Mobility Spectrometry . . 127
5.2.3 Fundamentals of FAIMS . . . 128
5.2.4 IMS vs. FAIMS . . . 131
5.3 Lonestar FAIMS device . . . 131
5.4 Experimental Setup . . . 131
5.4.1 DF – Dispersion Field . . . 132
5.4.2 CV – Compensation Voltage . . . 132
5.4.3 Ion Current . . . 133
5.4.4 DF Matrix . . . 133
5.5 Data Pre-processing and Analysis . . . 134
5.5.1 Disease Development . . . 139
5.6 Second Set of Experiment . . . 142
5.8 Summary . . . 147
5.9 Reference . . . 148
Chapter 6 Exploration of de-synchronisation of coupled chaotic systems for usage in signal processing and measurements 153 6.1 Chapter Overview . . . 153
6.2 Introduction . . . 154
6.3 Dynamical Systems . . . 155
6.4 DS Stability . . . 155
6.4.1 Lyapunov Stability . . . 155
6.4.2 Asymptotic Stability . . . 156
6.4.3 Uniform Stability . . . 156
6.4.4 Global and Local Stability . . . 157
6.4.5 DS Attractors . . . 157
6.5 Lyapunov Exponents . . . 158
6.6 Chaotic Dynamical Systems . . . 158
6.7 Lorenz System . . . 160
6.8 Synchronisation . . . 162
6.9 Synchronisation of Chaotic Systems . . . 163
6.9.1 Synchronisation Types . . . 163
6.9.2 Master-Slave Synchronisation of Chaotic Systems . . . 164
6.9.3 Synchronisation of Lorenz System Using OPCL . . . . 165
6.9.4 Generic Model . . . 170
6.10 Addition of Bias . . . 172
6.11 Application in Signal Processing . . . 175
6.11.2 Synchornisation of ENs with Cantilever Sensors . . . . 181
6.11.3 Synchronisation of Cantilevers in AFMs . . . 185
6.12 Summary . . . 191
6.13 References . . . 193
Chapter 7 Conclusion and Future Work 205 7.1 Chapter Overview . . . 205
7.2 Overview of Main Research Results . . . 206
7.2.1 Non-Destructive Plant Disease Detection . . . 206
7.2.1.1 EN and Plants Disease Detection . . . 206
7.2.1.2 FAIMS and Plants Disease Detection . . . 207
7.2.2 Synchronisation of Chaotic DS with Bias . . . 208
7.2.2.1 Synchronisation of Nano-mechanical Resonator 209 7.2.2.2 Synchronisation of Cantilevers in AFMs . . . 210
List of Tables
1.1 Global protected (greenhouse) production [23] . . . 4
2.1 Common greenhouse pest and diseases . . . 19 2.2 Direct and indirect disease detection techniques . . . 22 2.3 Examples of ELISA and PCR deployment for disease detection 25 2.4 Studies in which imaging and spectroscopic methods were
em-ployed for disease detection . . . 30 2.5 Analysis of VOC fingerprints for disease detection using GC-MS
in previous studies . . . 36
3.1 Sequential tasks conducted on a single day . . . 72
List of Figures
1.1 World’s population 1950-2050 (FAO). . . 2 1.2 Greenhouse production areas world-wide [12]. . . 4
2.1 Left: Microscopic view of Oidium neolycopersici, right: Micro-scopic view of Leveillula taurica [15]. . . 18 2.2 Left: powdery mildew colonies scattered around the plant,
mid-dle: powdery mildew colonies covers the entire leaf, right: colonies are visible on the stem [15]. . . 20 2.3 Left to right: bronzed colour caused by Tomato Spotted Wilt
Virus (TSWV), yellowing leaf is caused by Pepion Mosaic Virus (PEMV), angular small brown to black spots caused by Pseu-domonas syrigae bacteria, Chlorotic, wilted and dried leafs caused by Clavibacter michigensis bacteria [15]. . . 20 2.4 Typical fluorescence spectrum for a normal leaf experiencing no
stress [62]. . . 28 2.5 A typical GC-MS setup with thermal desorption unit and data
analysis unit ready for VOC sampling. . . 36
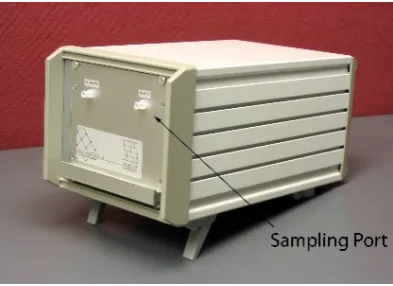
3.2 Lonestar FAIMS unit manufactured by Owlstone Ltd. . . 56 3.3 VOC sampling types: a) static collection (full plant), b) simple
pull collection (full plant), c) static collection (part of plant), d) push and pull collection (part of plant), e) push and pull collection (full plant) and f) simple pull collection (part of plant) 59 3.4 Field VOC sampling, top-left: Static collection (leaf), middle:
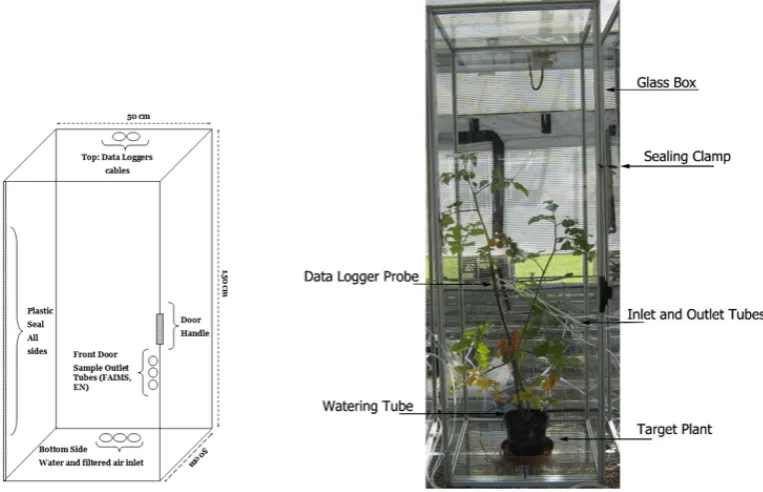
static collection (branch) and top-right: push-pull collection (full plant) [23]. . . 60 3.5 Left: The sampling glass enclosure and the positions of the
holes, right: Components of a sampling glass enclosure (front view) at University of Warwick . . . 62 3.6 Schematic view of the experimental setup showing three glass
enclosures for each plant . . . 63 3.7 Experimental setup showing the position of each glass enclosure 64 3.8 Components of a sampling glass enclosure (behind view) at the
University of Warwick . . . 66 3.9 PTFE filter, the tubing and the direction of the air flow . . . . 67 3.10 Left: Retronic Data Logger main unit, middle: field probe,
right: position of the probe in the sampling glass enclosure at Warwick University . . . 67 3.11 A sample of healthy (control) tomato plant at the University of
Warwick . . . 69 3.12 A tomato leaf covered with powdery mildew spores obtained
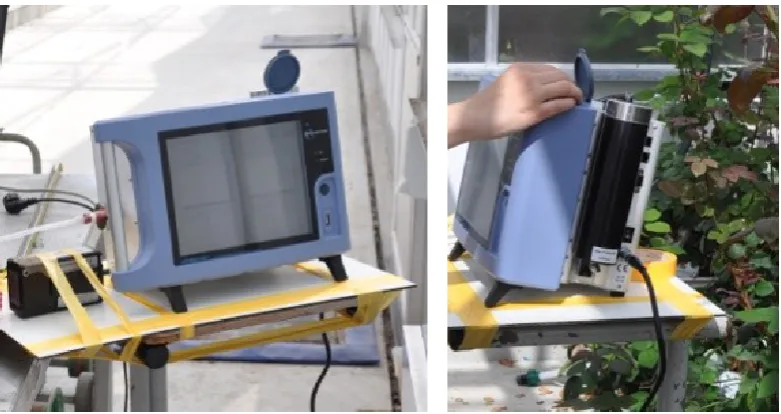
3.14 Left: FAIMS device on a sampling bench with an external pump, right: FAIMS on sampling bench with built-in FAIMS . 73
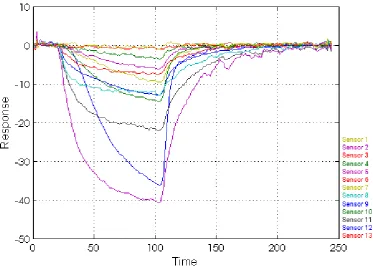
4.1 Typical EN response (raw data) acquired from a tomato plant.
Each line representing a single sensor. . . 90
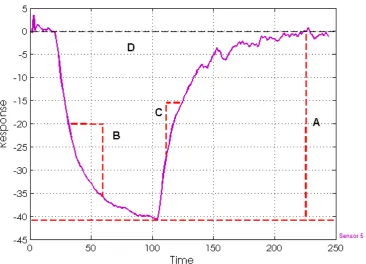
4.2 Parameters extracted from the raw data, a: Divergence (maxi-mum step response - positive or negative) - b: Absorption (max-imum positive rate of change) - c: Desorption (max(max-imum neg-ative rate of change) d: Area under the curve. . . 92
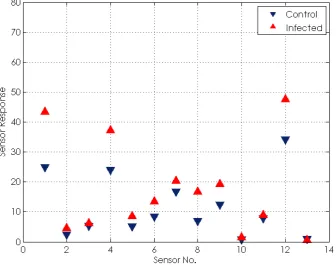
4.3 Mean divergence of control and infected samples on 4 DPI . . 93
4.4 4 DPI - a) Plant’s visual status - b) PCA projection . . . 96
4.5 6 DPI - a) Plant’s visual status - b) PCA projection . . . 96
4.6 8 DPI - a) Plant’s visual status - b) PCA projection . . . 97
4.7 9 DPI - a) Plant’s visual status - b) PCA projection . . . 97
4.8 K-means clustering showing projections on 4, 6, 8 and 9 DPIs 99 4.9 Silhouette plot with k = 3, k = 4 and k = 5 . . . 99
4.10 LDA result of 6 DPI with discriminant function 1 and discrim-inant function 2 . . . 101
4.11 ANN’s training and validation error . . . 104
4.12 FFNN with BP, classification performance on 4, 6, 8 and 9 DPI 104 4.13 SVM with Linear - left: 4 DPI - right: 6 DPI . . . 110
4.14 SVM with Polynomial kernel - left: 4 DPI right: 6 DPI . . . . 111
4.15 Multi-Class classification with polynomial kernel 91% . . . 112
5.1 Schematic representation of the IMS device a: ion source, b: ion gate, c: drift region and d: detector . . . 127
5.3 Ions oscillating between the FAIMS plates. left: ion hits lower plate, middle: ion in balanced condition, right: ion hits upper plate . . . 129 5.4 Typical FAIMS response - left: positive mode - right: negative
mode . . . 133 5.5 Left: normal FAIMS response - middle: processed FAIMS
re-sponse - Right: gray-scaled signal . . . 135 5.6 Positive and negative modes of the first sampling run . . . 136 5.7 Extracting (cutting) signal block from the full spectra . . . 137 5.8 Extracted sweeps showing lines 10, 15 and 20 of a single DF
matrix . . . 138 5.9 A single sweep extracted from the healthy and infected plants. 138 5.10 Intensity peaks detected on the pre-processed signal . . . 140 5.11 Peak intensity differences between the healthy and infected
sam-ples . . . 141 5.12 Development of powdery mildew disease from Day 1 to 26 DPI 142 5.13 Status of healthy plant - from Day 1 to DPI 26 - No visible
trend could be identified . . . 143 5.14 PCA projection of the second experiment: left: 2 DPI withpc1
= 81% and pc2 = 10%, right: 6 DPI withpc1 = 82% andpc2 = 11% . . . 144 5.15 Decision boundary produced by LDA on 6 DPI . . . 145
6.2 An example of 2-dimensional system, which is asymptotically
stable . . . 156
6.3 Strange attractor of Lorenz chaotic system . . . 161
6.4 2D illustration of the Lorenz chaotic systems representing (X, Y, Z) . . . 161
6.5 Time series of (x, y, z) vs. time evolution . . . 162
6.6 Synchronisation of Lorenz system . . . 165
6.7 RMSE vs. the value of p parameter. The error increases when the condition p <1−r is violated . . . 169
6.8 Synchronisation of two identical Lorenz systems (X, Y, Z) and (x, y, z) as described in the text . . . 170
6.9 Synchronisation of four identical Lorenz systems master, slave 1, slave 2, slave 3 and slave 4 . . . 171
6.10 Three regions of system dynamics: chaotic un-synchronised re-gion, fully synchronised region and unsynchronised region due to the added bias . . . 174
6.11 RMSE vs. the value of the added bias . . . 174
6.12 Chaotic behaviour of nano-mechanical duffing resonator with initial conditions set to 0 . . . 178
6.13 Synchronisation of two nano-mechanical resonators . . . 179
6.14 RMSE vs. the value of the added bias . . . 180
6.15 Basic cantilever dynamic operation mode [51] . . . 182
6.16 Observation of error of synchronisation . . . 184
6.17 Observation of error in relation to ∆m . . . 184
6.19 Chaotic behaviour of cantilever’s tip-sample interaction, left: master system with initial conditions set to (0,0), Right: slave system with initial conditions set to (0.1,0.1) . . . 188 6.20 Left: systems in non-synchronised region (de-synchronisation),
right: error of de-synchronisation . . . 189 6.21 Left: Systems in synchronised region, right: error of
synchroni-sation approaches 0 . . . 189 6.22 Left: systems in non-synchronised region (de-synchronisation),
Acknowledgments
First and foremost I want to thank my supervisors, Dr. Daciana D. Iliescu, Prof. Evor L. Hines and Dr. Mark Leeson for their guidance and support.
I would like to extend my sincerest thanks and appreciation to Dr Igor Kho-vanov for his generous support and priceless help. He is a true academic with real passion for spreading knowledge. He has not only guided me patiently but also has been a true inspiration.
My sincere gratitude is reserved for Prof. Richard Napier and Dr. Mark Pharaoh for their invaluable insights, kind assistance and extremely helpful suggestions.
I gratefully acknowledge the funding sources that made my PhD work possi-ble. The work was funded by the European Commission, Directorate General for Research, within the 7th Framework Programme of RTD.
I also would like to thank a dear friend, Dr. Behrouz Zafari, who has gener-ously helped me throughout the process. One should feel privileged to have such a friend who poses vast knowledge, insights, passion for life and incredible sense of humor.
Declarations
This thesis is presented in accordance with the regulations for the degree of doctor of philosophy. The work described in this thesis is entirely original and my own, except where otherwise indicated.
Publications and Presentations
Ghaffari, R., Iliescu, D., Hines, E., Leeson, M., Grosu, I. (2013), Dimension-ality Reduction For Sensory Datasets Based On Master-Slave Synchronization
Of Lorenz System, International Journal of Bifurcation and Chaos, 23, 05, doi:10.1142/S0218127413300139.
Ghaffari, R., Laothawornkitkul, J., Iliescu, D., Hines, E., Leeson, M., Napier, R., Moore, J., Tayloer, J., Paul, N. (2012),Plant Pest and Disease Diagnosis: Electronic Nose and Support Vector Machine Approach, Journal of Plant Dis-eases and Protection, 119, 200 - 207.
Ghaffari, R., Zhang, F., Iliescu, D., Hines, E., Leeson, M., and Napier, R. (2011). Detection of Diseases and Volatile Discrimination of Plants: An Electronic Nose and Self-Organizing Maps Approach. Intelligent Systems for Machine Olfaction: Tools and Methodologies, IGI Global, 214 - 230, doi: 10.4018/978-1-61520-915-6.ch008.
Ghaffari, R., Zhang, F., Iliescu, D., Hines, E., Leeson, M., Napier, R., Clark-son, J., Early detection of diseases in tomato crops: An Electronic Nose and intelligent systems approach, IEEE Neural Networks (IJCNN), 1 - 6, 18 - 23 July 2010, doi:10.1109/IJCNN.2010.5596535.
Ghaffari, R., Grosu, I., Iliescu, D., Hines, E., Leeson, Classification of Biomedical Datasets using Master-Slave Synchronisation of Lorenz System
11th IEEE Conference on Cybernetic Intelligent Systems (CIS), August 2012.
Ghaffari, R., Iliescu, D., Hines, E., Leeson, M., Intelligent Health Moni-toring Tool, Strictly Engineering, British Science Festival, Royal Academy of Engeneering, Edinburgh, September 2012, Finalist and Presenter.
Ghaffari, R., Iliescu, D., Hines, E., Leeson, M.,Intelligent Action Based Sys-tems, EPSRC UK ICT Pioneers Competition, Westminister, London, March 2011, Finalist and Presenter.
Ghaffari, R., Iliescu, D., Hines, E., Leeson, M.,Plant Disease Detection: Dis-criminating VOCs using High-Field Asymmetric Ion Mobility Spectrometry, 4th Oxford University SIAM Conference, Society for Industrial and Applied Mathematics (SIAM), University of Oxford, UK, February 2011, Presenter.
Ghaffari, R., Iliescu, D., Hines, E., Leeson, M., Greenhouse Intelligent Mon-itoring Software, New Technologies for Early Pest And Disease Detection, Association of Applied Biologists, Linconshire, UK, October 2011, Presenter.
Discriminating VOCs using High-Field Asymmetric Ion Mobility
Abstract
The detection of plant diseases is an important part of commercial greenhouse crop production and can enable continued disease and pest control which will ultimately lead to the economical benefit as well as the significant reduction in use of chemical and biochemical treatments. A plant subject to infection typically releases exclusive volatile organic compounds (VOCs) which may be detected by appropriate sensors. A set of experiments were designed, con-structed and conducted at University of Warwick in which the state-of-the-art gas sensors namely Electronic Nose (EN) and Field Asymmetric Ion Mobility Spectrometry (FAIMS) were employed to sample the VOC profiles in order to detect powdery mildew-infected and spider mite-infested tomato plants in a non-destructive manner. The data acquired from the EN and FAIMS de-vices was analysed using Principal Component Analysis, Linear Discriminant Analysis, Support Vector Machines and Artificial Neural Networks. Both EN and FAIMS proved to be able to distinguish between healthy and infected tomato plants with desirable accuracy when coupled with an appropriate data analysis technique. A review of the literature on plant diseases, destructive and non-destructive plant’s disease detection tools as well as VOC sampling procedures and instrumentation will be given throughout this thesis.
Abbreviations
AFM Atomic Force Microscopy
AN Artificial neuron
ANN Artificial neural network
CMOS Complementary metaloxidesemiconductor
CI Chemical ionization
CP Conducting polymer sensors
CV Compensation voltage
CVES Cross-validated early stopping
DF Dispersion field
DNA Deoxyribonucleic acid
DPI Day post infection
DS Dynamical Systems
ELISA Enzyme-linked immunosorbent assay
ERM Empirical risk minimization
FAIMS Field Asymmetric Ion Mobility Spectrometry
FAO Food and Agriculture Organization
FFNN Feed forward neural network
FISH Fluoresence in-situ hybridization
GCMS Gas chromatography-mass spectrometry
IFAS Immunofluorescence antibody staining
IFCS Immunofluorescence colony staining
IMS Ion mobility spectrometry
IS Intelligent systems
JA Jasmonic acid
LCE Lyapunov characteristic exponents spectrum
LDA Linear discriminant analysis
LSVM Linear Support Vector Machine
MEMS Microelectromechanical systems
MOS Metal oxide sensor
MSE Mean squared error
NMR Nuclear magnetic resonance
ODE Ordinary differential equation
OPCL Open-plus-closed-loop
PC Principal component
PCA Principal component analysis
PCR Polymerase chain reaction
PR Pattern recognition
PTFE Polytetrafluoroethylene
QDA Quadratic discriminant analysis
QP Quadratic programming
RBF Radial Basis Function
RNA Ribonucleic acid
RMSE Root-mean-square error
RSD Relative standard deviation
SMO Sequential minimal optimization
SRM Structural risk minimization
SVM Support vector machine
Chapter 1
INTRODUCTION
1.1
Chapter Overview
This chapter presents a comprehensive introduction to the research that is going to be reported in this thesis. Firstly, a background of the problem will be given. The issues and challenges concerned with world’s food security and crop production specifically greenhouse (protected) crop production will be covered in this chapter. Additionally, the motives, aim and objectives of the research will be specified, clearly indicating the tasks and deliverables. Finally, the chapter closes by presenting the summary of each chapter of this thesis.
1.2
Background
accelerated the development of a multi-disciplinary crop production industry, which has contributed immensely to the basis for a healthy and prosperous human civilisation [3].
Modern crop production with the aid of science and technology have provided enormous benefits including: reduction in nutrient deficiency-related diseases [4], harvests protection, enhanced food safety [5], consistent food quality [6], decreased food-preparation time [7], reduced food waste [8], lower household food costs [9], specifically formulated products for specific subpopulations [10] and efficient global food distribution [11] to deal with the ever growing world population. Food and Agriculture Organisation of the United Nations (FAO) recently [12] announced that the world population is projected to grow by 31% from 7.1 billion today to 9.20 billion in 2050 (Fig. 1.1).
Figure 1.1: World’s population 1950-2050 (FAO).
per annum [13]. Yet due to poor practices in production, harvesting, storage and transportation, as well as market and consumer wastage, it is estimated that 30–50% (1.22 billion tonnes) of all productions never reaches a consumer. Subsequently, large amounts of land, energy, fertilisers and water have also been lost in the production of crops which end up as waste. A complex, linked and collaborative global strategy is needed to ensure efficient and equitable crop production which will safeguard a sustainable food security [14]. Such strategies require innovative, scientific and technological foundations covering all aspects of the crop production including farmlands andgreenhouses.
1.3
Greenhouses
In order to feed the world’s more urban population, food production must increase by 70% [12]. Thus, the global greenhouse industry is attaining ever greater importance since it offers the following tangible benefits: a)throughout the year crops can be grown due to the availability of required environmental conditions (i.e. temperature and humidity), b) the long-term productivity of the crop is increased considerably,c)superior quality produce can be obtained as they are grown under suitably controlled environment, d) automated sys-tems for efficient use of various inputs like water, fertilisers, seeds and crop protection chemicals can be precisely maintained in a greenhouse,e)products can grow in large quantities on a relatively small surface area, andf )crop pro-duction schedules can be planned effectively to take advantage of the market needs [12].
consid-ered to play a significant role in the horticultural industry. An approximation of greenhouse production areas world-wide is presented in figure 1.2.
Figure 1.2: Greenhouse production areas world-wide [12].
The gross income from greenhouses may reach values of£30,000-£60,000/ha, up to £300,000/ha in case of potted or ornamental crops [15]. For example, the greenhouse industry in Holland, generated a total added value of£4 billion in 2005 [16]. Analogously, other countries around the globe such as Mexico and Spain have substantial greenhouse crop export trade as illustrated in table 1.1.
Tomatoes Cucumbers Peppers
Exporte % Export e % Exporte %
Netherlands 1,331,119,143 24 422,078,439 25 924,016,890 32 Mexico 1,119,341,215 20 380,719,319 24 583,503,608 21 Spain 1,009,908,150 18 407,353,639 22 581,899,463 21 Others 2,169,659,836 38 498,509,372 29 734,117,983 26
Although greenhouses offer exceptional benefits, they do present some crucial challenges. Elevating productivity [17, 18], optimising energy consumption [19, 20], minimising environmental impacts [21, 22], avoiding chemicals [23, 24] and preventing/controlling diseases [25-28] are some of the problems that both scientists and growers face in regards to commercial greenhouse crop production. This thesis attempts to propose a prototype methodology to deal with the latter problem using non-destructive and non-invasive methods in a small scale.
1.4
Problem Description and Motivations
The greenhouse controlled environment is known to be very conducive to sev-eral diseases which may cause economic losses up to 100% in a single season [29]. In reality, any crop or fruit that cannot be sold due to disease, infection, insect damage, overall appearance, or poor market timing can greatly hin-der a greenhouse operation’s ability to be economically profitable [30]. Plant diseases may be caused by viral, fungal, bacterial and pest sources [31]. A complete survey of greenhouse plant diseases and their sources will be given in chapter 2.
and bio-control products (e.g. Bacillus thuringiensis, Encarsia formosa and Lecanicillium) available, most of which are targeted for greenhouse crops but have high costs, environmental impacts and are toxic to human beings [33]. Reduction in using chemicals in greenhouses is not only economically benefi-cial but also prevents the rapid development of plant resistance against them [34].
Additionally, environmental and health concerns have increased public atten-tion and pressure to reduce chemical use in agriculture and greenhouse produc-tion [20]. The European Commission (EC) strongly encourages agricultural practices to reduce or eliminate pesticide use. In response, the parliament recommended a 50% reduction in the use of these chemicals over 10 years (Resolution of the European Parliament 2002/2277). Hence, chemical control in greenhouse environment is gaining ever more importance in both local and global scale.
The motives mentioned above have urged the industry to find alternative methods to control pest and diseases for sustainable and profitable green-house production. A major challenge is to detect and quantify diseases within a plant population before they spread throughout a greenhouse to allow agile control within a short timeframe since this would reduce cost, resource use and environmental pressure. A unique niche is now created for the innovative tools for predicting and controlling the diseases within the greenhouse [35].
1.5
Research Aim and Objectives
There are many systems which employ various sensors to monitor the envi-ronmental conditions of a plant. The complete overview of such systems will be given in the next chapter. However, the available sensors hardly monitor the internal state of the crop and may require the use of exhaustive laboratory testing for diagnosis. Such laboratory procedures are often time consuming, involve destructive methods and most are not feasible for daily practice. Lab-oratories and instruments are indeed expensive making them unsuitable. Fur-thermore, advanced scientific skills are required to carry out laboratory based diagnosis taking control away from growers.
This thesis propose a methodology for non-destructive, rapid, cost-effective, easy to deploy disease detection system. The unique contribution of this thesis comes from two directions:
Spectrometry) are employed to analyse the Organic Volatile Compounds emit-ted from tomato plants in order to construct a rapid and non-destructive plant disease detection tool.
b) The subordinate objective of this work, presented in chapter 6, is to de-velop a method based on the master-slave synchronisation of chaotic dynamical systems for signal processing and measurements. The usability of the newly-proposed method is assessed by considerations of two distinct applications: first: the synchronisation of multiple Nano-mechanical Resonators using the open-close control loop approach to demonstrate the relationship between the synchronisation error and an added bias and, second: the synchronisation of identical cantilevers (NEMS) typically found in ultra-sensitive Electronic Noses and Atomic Force Microscopes in the case of mismatch of cantilever parameters. The schema predominantly investigates the estimation of param-eters change (i.e. cantilever mass or cantilever-surface interaction) in such high precision instruments based on the error of synchronisation.
1.6
Scope and Delimitation
and diseases, d) commercial tomato plant is mainly grown under protected (greenhouse) environment and e) tomato plant is a biologically recognised model in plant pathogen and disease interactions research and can be applied on other species [23].
Powdery Mildew (Oidium neolycopersici) is an infection caused by the fungal family of B. graminis. Spider mites (Tetranychus urticae) is a plant-feeding mite found across the world, and is considered as a pest. This mite has been reported [36] to be infesting over 200 species of plants around the world. A number of vegetable plants such as tomatoes, squash, eggplant and cucumber are routinely subject to spider mite infestations and damage [37].
The incentive to select powdery mildew and spider mites in this study is based on the two following facts: first, these diseases are two of the most comprehen-sively studied conditions, and thus extensive body of research and literature are available. Secondly, these diseases are considered as the major cause for substantial damage and loss in a wide range of plant species including tomato plants.
1.7
Thesis Outline
In this section the outline of this thesis is presented.
1.7.1
Chapter Two
method-culture. It covers both theoretical and practical aspects of plant’s disease detection methods using different instruments and procedures.
1.7.2
Chapter Three
Chapter three gives a detailed introduction to the experimental methodology, samples, features and parameters of the proposed disease detection experimen-tal procedures and techniques. The chapter also introduces the gas sensors used in the experiments reported in this thesis.
1.7.3
Chapter Four
Chapter four is concerned about the analysis of data acquired from sensor arrays particularly Electronic Noses (EN). Datasets generated by the ENs will be analysed using clustering and classification methods in order to detect unhealthy samples. The experimental technique will be evaluated and the results will be compared and discussed in details.
1.7.4
Chapter Five
In chapter five the data acquired form a Field Asymmetric Ion Mobility Spec-trometry (FAIMS) device will be discussed and analysed. This chapter assesses the performance of FAIMS in categorising the healthy and infected samples.
1.7.5
Chapter Six
parameters needed for full synchronisation. The application of bias and com-puted synchronisation error in signal processing via a novel approach is also presented in this chapter.
1.7.6
Chapter Seven
Finally, chapter seven summarises the main findings of the research presented throughout this thesis. A brief conclusion will be provided which discusses the overall results. The thesis closes by outlining a framework for further research as well and recommending potential enhancements.
1.8
Summary
1.9
References
1. Ungar, P.S. and M.F. Teaford, Human diet: its origin and evolution. 2002: J F Bergin & Garvey.
2. Thompson, N.S. and F. Tonneau, Perspectives in Ethology: Evolution, Culture, and Behavior. 2000: Springer.
3. Floros, J.D., et al., Feeding the World Today and Tomorrow: The Impor-tance of Food Science and Technology. Comprehensive Reviews in Food Science and Food Safety, 2010. 9(5): p. 572-599.
4. Go, V.L.W., et al., Nutrient-Gene Interaction: Metabolic Genotype-Phenotype Relationship. The Journal of Nutrition, 2005. 135(12): p. 3016S-3020S.
5. Patel, P.D., (Bio)sensors for measurement of analytes implicated in food safety: a review. TrAC Trends in Analytical Chemistry, 2002. 21(2): p. 96-115.
6. Gunasekaran, S., Computer vision technology for food quality assurance. Trends in Food Science & Technology, 1996. 7(8): p. 245-256.
7. Bittman, M., J.M. Rice, and J. Wajcman, Appliances and their impact: the ownership of domestic technology and time spent on household work. The British Journal of Sociology, 2004. 55(3): p. 401-423.
9. Ronteltap, A., et al., Consumer acceptance of technology-based food inno-vations: Lessons for the future of nutrigenomics. Appetite, 2007. 49(1): p. 1-17.
10. Kreitzman, S.N., et al., Safety and effectiveness of weight reduction using a very-low-calorie formulated food. Archives of internal medicine, 1984. 144(4): p. 747.
11. Popkin, B.M., Technology, transport, globalization and the nutrition tran-sition food policy. Food Policy, 2006. 31(6): p. 554-569.
12. FAO, How to Feed the World in 2050. Food and Agriculture Organisation of the United Nations, 2010.
13. Fox, T., Global Food, Waste Not, Want Not. Institution of Mechanical Engineers, 2013.
14. Misselhorn, A., et al., A vision for attaining food security. Current Opinion in Environmental Sustainability, 2012. 4(1): p. 7-17.
15. Pardossi, A., F. Tognoni, and L. Incrocci, Mediterranean greenhouse tech-nology. Chronica Hort, 2004. 44(2): p. 28-34.
16. Breukers A, H.O., & Ruijs M, The power of Dutch greenhouse vegetable horticulture: An analysis of the private sector and its institutional frame-work. LEI Wageningen UR, The Hague, 2008.
17. Schaechter, M., Desk Encyclopedia of Microbiology. 2010: Elsevier Science.
19. van Lenteren, J.C., A greenhouse without pesticides: fact or fantasy? Crop Protection, 2000. 19(6): p. 375-384.
20. Neto, M., et al., A Greenhouse Tomato Crop Grey Mould Disease Early Warning System. 2011.
21. Elad, Y., N.E. Malathrakis, and A.J. Dik, Biological control of Botrytis-incited diseases and powdery mildews in greenhouse crops. Crop Protection, 1996. 15(3): p. 229-240.
22. Cook, R. and U. Braun, Conidial germination patterns in powdery mildews. Mycological Research, 2009. 113(5): p. 616-636.
Chapter 2
Plant Disease Detection: Tools
and Methods
2.1
Chapter Overview
2.2
Introduction
A 1950 publication by Chester et al. [1] presented the principles of plant dis-ease appraisal and since then other studies measured production losses caused by plant diseases in agricultural and horticultural settings [2-5]. Cheatham et al. [6], presented a framework in which the direct and indirect plant disease impact on the entire ecosystem of food services were outlined. However, the most commonly considered impact of plant disease is on crop yield, and, at times, losses are so great that famine results [7].
production by 16% for a total of $48 billion a year [12].
2.3
Plant Diseases
There are about 50,000 parasitic and non-parasitic plant diseases [13]. A plant disease may be defined as any disturbance that prevents the normal develop-ment of a plant, interferes with the regular function of part of a plant or reduces its yield, quality or aesthetic value. Disease in plants are caused by living agents (micro-organisms) and non-living agents (environmental factors, faulty nutrition, and chemical substances). The former group, are also known as pathogens or biotic agents and the latter group are referred to as abiotic agents [14].
Fungi are among the most important plant pathogens. They are microscopic organisms which unlike plants, lack chlorophyll and conductive tissue. There are more than 100,000 species of fungi found so far, of which around 8000 species are known to cause disease in plants. Fungi reproduce mainly by means of spores which are specialised propagative or reproductive bodies, consisting of one or a few cells. Figure 2.1 illustrates the microscopic view of two com-mon fungi (i.e. Oidium neolycopersici and Leveillula taurica) which cause the powdery mildew disease in tomato plants.
Figure 2.1: Left: Microscopic view of Oidium neolycopersici, right: Micro-scopic view of Leveillula taurica [15].
2.4
Greenhouse Diseases
It is falsely assumed that greenhouse environments are relatively free of disease and pests because the system is mostly enclosed. Pathogens, viruses and pests may be introduced when greenhouse vents are opened and through the move-ment of individuals or plantations through accidental introduction of infected plant material [17]. Another route for the spread of pathogens is through or-namental plants that act as hosts.
Pests
Whiteflies Spider Mites Broad mites
Thrips Broad mites Caterpillars
Rutherglen bug Flies (fungus gnats) Aphids Diseases
Fungal moulds and mildews
Botrytis (grey mould) Downy mildew Sclerotinia (white mould)
Leaf mould Powdery mildew
Bacterial leaf spots and soft rots
Angular leaf spot Bacterial speck Bacterial spot Bacterial soft rot
Fungal leaf spots, blights and cankers
Alternaria leaf spot Anthracnose leaf spot Grey leaf spot Gummy stem blight
Bacterial wilts
Bacterial canker Bacterial pith necrosis Bacterial wilt Fungal wilts and root rots
Black root rot Damping off Fusarium
Verticillium Viruses
Mosaic viruses Cucumber yellows Tomato spotted wilt virus Table 2.1: Common greenhouse pest and diseases
2.5
Disease Symptoms
neolycop-ersici.
Figure 2.2: Left: powdery mildew colonies scattered around the plant, middle: powdery mildew colonies covers the entire leaf, right: colonies are visible on the stem [15].
The following images (2.3) illustrate the visual symptoms of diseases caused by bacteria and viruses in tomato plant.
A plant disease develops over a period of time, whereas an injury that is caused by an insect feeding on a plant or damage from equipment or machin-ery occurs immediately or over a vmachin-ery short period of time. Usually a disease has been developing for several days before any symptoms on the plant are visible. For instance, it takes four to five days for leaf spots and potato late blight to become visible whereas symptoms of many other pathogens may take seven to 14 days to become visible [19].
2.6
Disease Diagnosis
After the onset of plant disease symptoms, the presence of disease in plants is verified using disease detection techniques.
Disease Detection
Direct Methods Indirect Methods
Serological Methods Biomarkers for disease detection
Flow Cytometry Gaseous metabolite profiling
Enzyme-Linked Plant metabolite profiling
Immunosorbent assay (ELISA)
Molecular Methods Plant Properties/stress
Fluorescence in situ hybridisation (FISH) Imaging Techniques Polymerase chain reaction (PCR) Spectroscopic Techniques DNA Arrays
Table 2.2: Direct and indirect disease detection techniques
2.7
Molecular Techniques
Detection and diagnosis of plant viruses has included molecular and serologi-cal laboratory tests since the 1960s [21]. Molecular methods for plants disease detection includes characterising, isolating, and manipulating the molecular components of cells and organisms such as nucleic acids, that include deoxyri-bonucleic acid (DNA, the repository of genetic information) and rideoxyri-bonucleic acid (RNA, which serves the structural, functional, enzymatic, and informa-tion carrier role) [22].
2.7.1
Enzyme-linked Immunosorbent Assay (ELISA)
Enzyme-linked Immunosorbent Assay (ELISA) is a rapid and sensitive sero-logical method [23] which tests for the presence of the specific protein that the transgene produces in the plant and is employed for the identification of viral [24-26], bacterial [27] and fungal plant pathogens [28]. Applications of ELISA technique for the diagnosis of plant diseases have already been reviewed by Schaad et al. [29] and Henson et al. [30]. The following steps construct a typical ELISA procedure in a laboratory:
Step 1: Coat solid phase with either antibody or analyte. Step 2: Block remaining binding sites on the solid phase.
Step 3: Add either analyte or anti-analyte antibody to be detected. Step 4: Wash out excess reagent. This separates bound from free analyte. Step 5: If reagent in step 4 is an analyte, add a second anti-analyte antibody with detection molecule attached. If reagent is an anti-analyte antibody, add an anti-Ig antibody with detection molecule attached.
Step 6: Wash out excess reagent
Step 7: Add substrate. The colour change or amount of light emitted is pro-portional to the level of target analyte.
2.7.2
Polymerase Chain Reaction (PCR)
Polymerase Chain Reaction (PCR) is a technique used to make copied DNA sequences of interest through repetitive temperature cycling. PCR has been used in molecular biology, medical diagnosis, forensic analysis, plant biology, evolutionary and medical diagnosis [34]. The following tasks are required to be completed for a typical PCR procedure conducted in a laboratory.
Step 1 – Denaturation: DNA fragments are heated at high temperatures, which reduce the DNA double helix to single strands. These strands become accessible to primers.
Step 2 – Annealing: The reaction mixture is cooled down. Primers an-neal to the complementary regions in the DNA template strands, and double strands are formed again between primers and complementary sequences. Step 3 – Extension: The DNA polymerase synthesises a complementary strand. The enzyme reads the opposing strand sequence and extends the primers by adding nucleotides in the order in which they can pair. The whole process is repeated over and over as required.
Reference Plant Source Type Method [35,36] Citrus Xylella fastidiosa Bacteria PCR, ELISA
[37] Onion Sclerotium cepivorum Fungi ELISA
[38] Coffee Leaf Xylella fastidiosa Bacteria PCR
[39] Olive Pseudomonas savastanoi Bacteria PCR
[40] Potato Candidatus Liberibacter Bacteria PCR
[41] Tomato Pepino mosaic virus Virus PCR, ELISA
[42] Almond Candidatus Phytoplasma Bacteria PCR, ELISA Table 2.3: Examples of ELISA and PCR deployment for disease detection
2.7.3
Limitations and boundaries
Ready to use self-contained ELISA and PCR kits are produced in large quanti-ties to allow detection of specific pathogens including Calibrachoa mottle virus [47], Xanthomonas fragariae [48], Ralstonia solanacearum [49], Tobacco mo-saic virus [50] and Tomato spotted wilt virus [51]. Alvarez et al. [52] reported that there are around 100 commercially available immunodiagnostic tools for the detection pathogens in plants. In spite of the availability of these tools, the laboratory based techniques are time consuming, and require destructive sampling and thus they cannot be deployed as a preliminary screening tool for processing large number of plant samples due to the complexity involved in the process. Some of the specific and tangible limitations of the molecular techniques are as follow:
Time consuming: although some of the techniques may produce conclusive result in few minutes, the overall time to collect, prepare and analyse the sam-ple may be significantly long. Time is the most crucial factor as the disease has to be detected and treated within the shortest time to avoid contaminating other crops within the greenhouse.
horticulturalists to be able to prepare the samples and interpret the results. Hiring skilled technicians to collect and analyse samples on daily basis is im-practicable and is considered economically unviable. Additionally, not all the tests conducted produces conclusive result. Obtaining reliable and accurate results requires skill. More importantly, the fact that human interaction is required for conducting the procedures eliminates the opportunity of such procedures to be integrated to the greenhouse management systems.
Destructive sampling: molecular techniques require a part of the plant to be detached for sampling. Destructive methods of disease detection are not suitable for rapid detection of diseases.
Elaborate procedure is required: especially during sample collection, ex-traction and preparation.
Cost: The overall cost of equipment, training and maintenance is high. Ad-ditionally, these techniques require consumable reagents that must be tailored to detect each specific pathogen (e.g. sequence-specific primers for PCR). Considering the limitations outlined above, there is a demand for a fast, sen-sitive, and selective method for the non-destructive detection of plant diseases in early stages for economic, production and agricultural benefits.
2.8
Non-Destructive Methods
approaches were selected as a) they offer non-destructive testing and b) they could possibly be integrated with an automated agricultural management sys-tem for a fast, reliable, and real-time plant disease monitoring for disease control and management.
Novel methods such as spectroscopic and imaging techniques for disease de-tection are among the non-destructive approaches since they do not required to detach any part(s) of the plant.
2.8.1
Spectroscopic and Imaging Techniques
Various spectroscopic and imaging techniques have been studied for the de-tection of symptomatic and asymptomatic plant diseases including fluores-cence imaging [53], multispectral or hyperspectral imaging [54], infrared spec-troscopy [55, 56], fluorescence specspec-troscopy [57], and Nuclear Magnetic Res-onance (NMR) spectroscopy [58]. Such imaging and spectroscopic technolo-gies have been applied for plant stress detection including water-stress and nutrient-stress detection. In addition, there have also been applications for monitoring the quality of postharvest fruits and vegetables [59].
2.8.2
Fluorescence Spectroscopy
Fluorescence Spectroscopy refers to a type of spectroscopic method, where the fluorescence from the object of interest is measured after excitation with a beam of light (usually ultraviolet spectra).
detect stress caused by water or other environmental factors or b) identify diseases based on plants visual symptoms. Two types of fluorescence: a) blue-green fluorescence (400-600 nm range), and b) chlorophyll fluorescence (650-800 nm), are produced by green leaves in plants [60]. In Fig. 2.4 a typ-ical fluorescence spectrum of a healthy leaf for excitation at 532nm is shown which is due to the chlorophyll emission. The relative intensities of chlorophyll and blue-green fluorescent bands are highly sensitive to intrinsic leaf properties and environmental factors and therefore could be utilised to monitor nutrient deficiencies, nitrogen stress [61], environmental conditions based stress levels, and diseases in plants [62]. Lenk et al. [63] described the multispectral
fluores-Figure 2.4: Typical fluorescence spectrum for a normal leaf experiencing no stress [62].
[image:57.595.173.459.357.571.2]caused by the (Xanthomonas axonopodis pv. Citri) bacteria using 532nm, 10 mW excitation laser. Marcassa [65] used a system which composed of a spectrometer with the range of 350-850nm to detect water stress in orange trees (Citrus aurantium L.). Finally, Brling et al. [66] applied laser-induced fluorescence spectroscopy measured between 370 and 800 nm to detect leaf rust (Puccinia triticina) in wheat (Triticum aestivum L.) cultivars. In all in-vestigations, the laser power has unanimously [62, 65] reported to be on the order of 10mW, assuring no thermal effect on the plant.
2.8.3
Visible and Infrared Spectroscopy
Studies have also been conducted on the detection of stress, injury, and dis-eases in plants using visible and infrared spectroscopy. The visible and infrared regions of the spectra is reported [60] to provide the valuable information on the physiological stress levels in the plants and thus, some of these wavebands specific to a disease can be used to detect plant diseases [67].
observed specific differences in vegetation indices and wavelength intervals be-tween virus-infected and uninfected leaves in the 550, 900, 1600 and 2200nm regions.
Other imaging and spectrometry techniques such as hyperspectral imaging was investigated by Huang et. al [71], Chen et. al [72] and Delalieux et. al [73] to detect the symptoms of Sclerotinia Rot disease in celery crop (Apium graveolens), Verticillium wilt in cotton canopy and stress caused by Venturia inaequalis in apple trees respectively. In hyperspectral imaging, the spectral reflectance of each pixel is acquired for a range of wavelengths in the elec-tromagnetic spectra. The wavelengths may include the visible and infrared regions of the electromagnetic spectra. The resulting information is a set of pixel values (intensity of the reflectance) at each wavelength of the spectra in the form of an image.
The following table summarises the studies previously conducted using spec-troscopic methods.
Reference Method Plant Application
[59] NIR spectroscopy Nectarines Fruit Ripening
[74] NIR spectroscopy Apples Sugar Content
[75] NIR spectroscopy Tomato Rhizopus stolonifer spores [62] Fluorescence spect. Citrus Xanthomonas axonopodis pv [76] Fluorescence spect. Tomato Field monitoring
[71] Hyperspectral sensing Celery Sclerotinia rot [77] Hyperspectral sensing Citrus Citrus canker
[78] NMR Spectroscopy Rose Phytoplasma Infection
2.8.4
Limitations and Boundaries
Most of the imaging techniques are relying on the visible symptoms and there-fore the higher the visual symptoms, better is the accuracy of the technique. This is considered as a major drawback since the visual symptoms indicate that the disease has been developed already. Additionally, majority of wave-lengths used in imaging techniques are limited to the ones that are produced by the photosynthesis process. Although such imaging techniques may be able to indicate the plant stress or photosynthesis deficiencies, there are not yet proficient in indicating underlying complex plant diseases [79]. Besides, the instrumentation and tools required for such detection are expensive, especially if techniques such as hyperspectral imaging are used. Predictably, fewer the wave bands used, cheaper will be the instrument. Standalone or networked computer systems are also needed for data collection and analysis which may add to the cost and may require an IT infrastructure. Such systems are not of-ten rigorously ruggedized and therefore may not be suitable for inof-tense weather conditions found in horticultural settings. Last but not the least, the devices need to be calibrated on regular basis which may affect the consistency of the result generated by the system.
2.9
Plant’s Volatile Organic Compounds
roots into the soil [80]. VOCs are lipophilic liquids with high vapour pressures which can cross membranes freely and be released into the atmosphere or soil in the absence of a diffusion barrier [81]. The VOC released by plants con-tribute to approx. 60% of the total VOC emissions present in the atmosphere. Various studies [82, 83] have been conducted to explore the VOCs emitted from different species of plants around the world because of their important role in: a) shaping global atmospheric and tropospheric chemistry, b) regional photochemical formation, c) balancing the global carbon cycle, and d) produc-tion of organic acids which contribute to acidic deposiproduc-tion in rural areas [84].
2.9.1
VOCs and Plant Defence
The principal functions of airborne VOCs are as follow: a) to defend plants against herbivores and pathogens [81], and b) to provide a potential repro-ductive advantage by attracting pollinators and seed dispersers [91]. VOCs emitted from vegetative tissues, as a part of the plant defence strategy, can repel or intoxicate [92] microbes and animals [93]. This is also known as a direct defence. VOCs can also attract natural predators of attacking herbi-vores, protecting the plant via tri-trophic interactions [94]. This is known as an indirect defence.
By releasing VOCs, a signalling plant not only reduces the number of attacking herbivores but can also warn the neighbouring plants about the herbivore or pathogen attack [95]. These warnings induce the expression of defence genes or emission of VOCs in neighbouring plants [96] or prime these plants to re-spond faster to future herbivore attack [97]. VOCs emitted from roots can contribute to a below-ground defence system by acting as anti-microbial or anti-herbivore substances, or by attracting enemies of root feeding herbivores [98].
2.10
VOCs and Disease Indication
develop-mental stage of the plant, insects, and presence of other herbs. These VOCs may vary qualitatively and quantitatively in response to abiotic and biotic stresses, including infection. The VOC profiles emitted from attacked plants show a degree of specificity and exclusivity which is associated with the cat-egory of attackers, and these profiles are different from those of undamaged or healthy plants [96]. Suitably, by examining the change of such profiles a non-destructive means of plant health evaluation may be developed.
Jansen et al. investigated whether plant-emitted volatiles can be used to detect a Botrytis Cinerea infection [101]. In a similar study, Sankaran re-viewed the methods that can be employed in sensing diseases by analysing the plants VOCs [60]. Cevallos-Cevallos [102] reported that compounds such as hesperidin, naringenin, and quercetin present in the leaves could be used as a biomarker to identify huanglongbing disease in citrus trees. Finally, in a paper published by Tholl [103], the methods for VOC sampling and analy-sis for in-situ experiments as well as some for field experiments were described.
more portable which make them a suitable choice for deploying in large scale and multi-side operation.
2.11
VOCs and GC-MS Based Analysis
The most prominent technique in use for examining plant species VOCs is Gas Chromatography - Mass Spectrometry also known as GC-MS. GC-MS is an instrumental technique, comprising a gas chromatograph (GC) coupled to a mass spectrometer (MS), by which complex mixtures of chemicals may be sep-arated in time, identified and quantified using electron or chemical ionisation techniques allowing the analysis of the hundreds of relatively low molecular weight compounds found in environmental materials. In order for a compound to be analysed by GC-MS it must be sufficiently volatile and thermally stable.
GC-MS systems with distinct topologies are used but for analysing VOCs the GC-MS need to be coupled with a thermal desorption unit which enables the analysis of concentration samples including air pollutants and living entities (i.e. plants). Figure 2.5 shows a typical installation of GC-MS which includes a GC unit, MS unit, thermal desorption unit and a PC for data analysis.
Figure 2.5: A typical GC-MS setup with thermal desorption unit and data analysis unit ready for VOC sampling.
Reference Plant Cause of disease
[107] Cucumber, Pepper Oidium neolycopersici [108] Blueberry fruit Botrytis cinerea
[109] Tomato Trichoplusia ni
[110] Potato Phytophthora infestans
[102] Citrus Huanglongbing
[111] Carrots Botrytis cinerea
[112] Mango Lasiodiplodia theobromae
Table 2.5: Analysis of VOC fingerprints for disease detection using GC-MS in previous studies
2.11.1
Limitations and Boundaries
Although GC-MS based systems are proven to be very effective in identifying the plants VOCs, the technology is costly, bulky, and requires skilled oper-ators to process the resultant data. Therefore, these devices are unlikely to be suitable for use as user-friendly, practical and fully automated systems for early warning of pest and disease attacks in commercial greenhouses.
car-rier gas (usually helium) to be fully operational. Selecting and supplying the appropriate carrier gas is a major drawback for a portable and rapid diagnosis tool.
Alternatively, gas sensor array systems (i.e. Electronic Noses) are known to offer a more attractive means of investigating VOCs as they are relatively cheaper, portable and can facilitate automated sampling procedures. Chapter 4 will investigate the use of Electronic Noses in detecting the plant’s VOCs and hence discriminating between healthy and infected plants. Chapter 5 in-troduces a novel technique in which High-Field Asymmetric Waveform Ion Mobility Spectrometry (FAIMS) is utilised to sample the VOCs emitted from healthy and infected plants, thus, discriminating between them.
2.12
Summary
2.13
References
1. Chester, K.S., Plant disease losses: their appraisal and interpretation. Plant Disease Reporter (Suppl.), 1950(193): p. 190-362.
2. Alam, K. and J. Rolfe, Economics of plant disease outbreaks. Agenda, 2006. 13(2): p. 133-146.
3. Bowers, J.H., et al., The impact of plant diseases on world chocolate pro-duction. 2001: APSnet.
4. Chakraborty, S. and A.C. Newton, Climate change, plant diseases and food security: an overview. Plant Pathology, 2011. 60(1): p. 2-14.
5. Peterson, R.K.D. and L.G. Higley, Biotic Stress and Yield Loss. 2010: Taylor & Francis.
6. Cheatham, M.R., et al., Beyond Yield: Plant Disease in the Context of Ecosystem Services. Phytopathology, 2009. 99(11): p. 1228-1236.
7. Verdin, J., et al., Climate science and famine early warning. Philosophical Transactions of the Royal Society B: Biological Sciences, 2005. 360(1463): p. 2155-2168.
8. James, W.C., Assessment of plant diseases and losses. Annual Review of Phytopathology, 1974. 12(1): p. 27-48.
10. Pimentel, D., R. Zuniga, and D. Morrison, Update on the environmental and economic costs associated with alien-invasive species in the United States. Ecological Economics, 2005. 52(3): p. 273-288.
11. Oerke, E.-C., et al., Crop production and crop protection: estimated losses in major food and cash crops. 1994: Elsevier Science Publishers.
12. David Pimentel, P.D., Biological Invasions: Economic and Environmental Costs of Alien Plant, Animal, and Microbe Species. 2010: Taylor & Francis.
13. Pimentel, D., et al., Environmental and economic costs associated with non-indigenous species in the United States. Biological Invasions. CRC, Boca Raton, 2002: p. 285-303.
14. Lucas, G.B., C.L. Campbell, and L.T. Lucas, Introduction to Plant Dis-eases: Identification and Management. 1992: Springer.
15. Blancard, D., et al., Tomato Diseases: Identification, Biology and Control. 2012: Manson Publishing Limited.
16. Parry, D., Plant pathology in agriculture. 1990: Cambridge University Press.
17. Jensen, M.H. and A.J. Malter, Protected agriculture: a global review. 1995: World Bank Publications.
18. Sharma, P.D., Plant Pathology. 2004: Rastogi Publications.
20. Putnam, M.L., Evaluation of selected methods of plant disease diagnosis. Crop Protection, 1995. 14(6): p. 517-525.
21. Martin, R.R., D. James, and C.A. Lvesque, Impacts of Molecular Diagnos-tic Technologies On Plant Disease Management. Annual Review of Phy-topathology, 2000. 38(1): p. 207-239.
22. Singh, A., et al., Chapter 13 - Molecular Techniques, in Chemical Analysis of Food: Techniques and Applications. 2012, Academic Press: Boston. p. 407-461.
23. Khan, J.A. and J. Dijkstra, Plant viruses as molecular pathogens. 2002: Food Products Press.
24. Narayanasamy, P., Microbial Plant Pathogens-Detection and Disease Diag-nosis: Viral and Viroid Pathogens. 2011: Springer London, Limited.
25. Maramorosch, K., Plant Diseases and Vectors: Ecology and Epidemiology. 1981: Elsevier Science.
26. Hobbs, H., et al., Use of direct antigen coating and protein A coating ELISA procedures for detection of three peanut viruses. Plant disease, 1987. 71(8): p. 747-749.
27. Flood, J. and P.D. Bridge, Ganoderma diseases of perennial crops [elec-tronic resource]. 2000: CABI Publ.
29. Schaad, N.W. and R.D. Frederick, Real-time PCR and its application for rapid plant disease diagnostics. Canadian Journal of Plant Pathology, 2002. 24(3): p. 250-258.
30. Henson, J.M. and R. French, The Polymerase Chain Reaction and Plant Disease Diagnosis. Annual Review of Phytopathology, 1993. 31(1): p. 81-109.
31. Miller, S.A. and R.R. Martin, Molecular Diagnosis of Plant Disease. Annual Review of Phytopathology, 1988. 26(1): p. 409-432.
32. Kole, C., Transgenic Crop Plants: Principles and development. Volume 1. 2010: Springer Berlin Heidelberg.
33. Gnanamanickam, S.S., Plant-Associated Bacteria. 2007: Springer.
34. Lim, C.T. and J.C.H. Goh, 13th International Conference on Biomedical Engineering. 2009: Springer Berlin Heidelberg.
35. Pooler, M. and J. Hartung, Specific PCR detection and identification of Xylella fastidiosa strains causing citrus variegated chlorosis. Current Mi-crobiology, 1995. 31(6): p. 377-381.
36. Arajo, W.L., et al., Diversity of endophytic bacterial populations and their interaction with Xylella fastidiosa in citrus plants. Applied and Environ-mental Microbiology, 2002. 68(10): p. 4906-4914.
38. De Lima, J., et al., Coffee leaf scorch bacterium: Axenic culture, pathogenic-ity, and comparison with Xylella fastidiosa of citrus. Plant Disease, 1998. 82(1): p. 94-97.
39. Penyalver, R., et al., Detection of Pseudomonas savastanoi pv. savastanoi in olive plants by enrichment and PCR. Applied and Environmental Micro-biology, 2000. 66(6): p. 2673-2677.
40. Secor, G., et al., Association of ’Candidatus Liberibacter solanacearum’ with zebra chip disease of potato established by graft and psyllid trans-mission, electron microscopy, and PCR. Plant Disease, 2009. 93(6): p. 574-583.
41. Martinez-Culebras, P., et al., A RTPCR assay combined with RFLP anal-ysis for detection and differentiation of isolates of Pepino mosaic virus (PepMV) from tomato. European journal of plant pathology, 2002. 108(9): p. 887-892.
42. Chalak, L., et al., Attempts to eliminate Candidatus phytoplasma phoeni-cium from infected Lebanese almond varieties by tissue culture techniques combined or not with thermotherapy. European journal of plant pathology, 2005. 112(1): p. 85-89.
43. Odell, I.D. and D. Cook, Immunofluorescence Techniques. J Invest Derma-tol, 2013. 133(1): p. e4.
45. Singh, R., J. Jiang, and B.S. Gill, Current status and the future of fluo-rescence in situ hybridization (FISH) in plant genome research. Genome, 2006. 49(9): p. 1057-1068.
46. Wan, J., M.F. Dunning, and A.F. Bent, Probing plant-pathogen interac-tions and downstream defense signaling using DNA microarrays. Functional & integrative genomics, 2002. 2(6): p. 259-273.
47. Liu, H.-Y., et al., First report of Calibrachoa mottle virus infecting petunia. Plant Disease, 2003. 87(12): p. 1538-1538.
48. Roberts, P., et al., Survival of Xanthomonas fragariae on strawberry in sum-mer nurseries in Florida detected by specific prisum-mers and nested polysum-merase chain reaction. Plant Disease, 1996. 80(11): p. 1283-1288.
49. Elphinstone, J., et al., Sensitivity of different methods for the detection of Ralstonia solanacearum in potato tuber extracts. EPPO Bulletin, 1996. 26(34): p. 663-678.
50. Van Regenmortel, M. and J. Burckard, Detection of a wide spectrum of to-bacco mosaic virus strains by indirect enzyme-linked immunosorbent assays (ELISA). Virology, 1980. 106(2): p. 327-334.
51. Zindovic, J., et al., First Report of Tomato spotted wilt virus on Pepper in Montenegro. Plant Disease, 2011. 95(7): p. 882-882.
53. Sauer, M., J. Hofkens, and J. Enderlein, Handbook of Fluorescence Spec-troscopy and Imaging: From Ensemble to Single Molecules. 2010: Wiley.
54. Chang, C.I., Hyperspectral imaging: techniques for spectral detection and classification. 2003: Kluwer Academic/Plenum Publishers.
55. Stuart, B.H., Infrared Spectroscopy: Fundamentals and Applications. 2004: Wiley.
56. Nicola, B.M., et al., Nondestructive measurement of fruit and vegetable quality by means of NIR spectroscopy: A review. Postharvest Biology and Technology, 2007. 46(2): p. 99-118.
57. Lakowicz, J.R., Principles of fluorescence spectroscopy. 2009: Springer London, Limited.
58. Keeler, J., Understanding NMR Spectroscopy. 2011: Wiley.
59. Prez-Marn, D., et al., Non-destructive determination of quality parameters in nectarines during on-tree ripening and postharvest storage. Postharvest Biology and Technology, 2009. 52(2): p. 180-188.
60. Sankaran, S., et al., A review of advanced techniques for detecting plant diseases. Computers and Electronics in Agriculture, 2010. 72(1): p. 1-13.
61. Tremblay, N., Z. Wang, and Z. Cerovic, Sensing crop nitrogen status with fluorescence indicators. A review. Agronomy for Sustainable Development, 2012. 32(2): p. 451-464.
63. Lenk, S., et al., Multispectral fluorescence and reflectance imaging at the leaf level and its possible applications. Journal of Experimental Botany, 2007. 58(4): p. 807-814.
64. Usha, K. and B. Singh, Potential applications of remote sensing in horti-cultureA review. Scientia Horticulturae, 2013. 153(0): p. 71-83.
65. Marcassa, L.G., et al., Fluorescence spectroscopy applied to orange trees. Laser Physics, 2006. 16(5): p. 884-888.
66. Brling, K., et al., UV-induced fluorescence spectra and lifetime determina-tion for detecdetermina-tion of leaf rust (Puccinia triticina) in susceptible and resis-tant wheat (Triticum aestivum) cultivars. Functional Plant Biology, 2011. 38(4): p. 337-345.
67. Muhammed, H.H. Using hyperspectral reflectance data for discrimination between healthy and diseased plants, and determination of damage-level in diseased plants. in Applied Imagery Pattern Recognition Workshop, 2002. Proceedings. 31st. 2002. IEEE.
68. Xu, H.R., et al., Near-infrared Spectroscopy in detecting Leaf Miner Dam-age on Tomato Leaf. Biosystems Engineering, 2007. 96(4): p. 447-454.
69. Wang, D., et al., Classification of Fungal-Damaged Soybean Seeds Us-ing Near-Infrared Spectroscopy. International Journal of Food Properties, 2004. 7(1): p. 75-82.
71. Huang, J.F. and A. Apan, Detection of sclerotinia rot disease on celery using hyperspectral data and partial least squares regression. Journal of Spatial Science, 2006. 51(2): p. 129-142.
72. Chen, B., et al., Spectrum Characteristics of Cotton Canopy Infected with Verticillium Wilt and Inversion of Severity Level, in Computer And Com-puting Technologies In Agriculture, Volume II, D. Li, Editor. 2008, Springer US. p. 1169-1180.
73. Delalieux, S., et al., Detection of biotic stress (Venturia inaequalis) in apple trees using hyperspectral data: Non-parametric statistical approaches and physiological implications. European Journal of Agronomy, 2007. 27(1): p. 130-143.
74. Nicola, B.M., K.I. Theron, and J. Lammertyn, Kernel PLS regression on wavelet transformed NIR spectra for prediction of sugar content of apple. Chemometrics and Intelligent Laboratory Systems, 2007. 85(2): p. 243-252.
75. Hahn, F., I. Lopez, and G. Hernandez, Spectral Detection and Neural Network Discrimination of Rhizopus Stolonifer Spores on Red Tomatoes. Biosystems Engineering, 2004. 89(1): p. 93-99.
76. Saito, Y. Laser-induced fluorescence spectroscopy/technique as a tool for field monitoring of physiological status of living plants. in 14th Interna-tional School on Quantum Electronics: Laser Physics and Applications. 2007. International Society for Optics and Photonics.
![Figure 2.4: Typical fluorescence spectrum for a normal leaf experiencing nostress [62].](https://thumb-us.123doks.com/thumbv2/123dok_us/9604302.463538/57.595.173.459.357.571/figure-typical-uorescence-spectrum-normal-leaf-experiencing-nostress.webp)