University of Warwick institutional repository:http://go.warwick.ac.uk/wrap
A Thesis Submitted for the Degree of PhD at the University of Warwick
http://go.warwick.ac.uk/wrap/77676
This thesis is made available online and is protected by original copyright. Please scroll down to view the document itself.
Improvement of Consistency, Accuracy and Interpretation
of Characterisation Test Techniques for Li-ion Battery cells
for Automotive Application
By
Anup Barai
A thesis submitted in partial fulfilment of the requirements for the
degree of
Doctor of Philosophy in Engineering
University of Warwick, Warwick Manufacturing Group (WMG)
Contents
CONTENTS...II
LIST OF FIGURES ... V
LIST OF TABLES ... XI
ACKNOWLEDGEMENT...XII
DECLARATION... XIII
LIST OF PUBLICATIONS...XIV
ABSTRACT ...XVI
ABBREVIATIONS ... XVII
1. INTRODUCTION ...1
1.1 AN INTRODUCTION TO THE RECENT TRENDS IN THE AUTOMOTIVE INDUSTRY.1 1.2 AN INTRODUCTION TOEVOPERATION...3
1.3 AN INTRODUCTION TOEVBATTERY...6
1.3.1 EV requirements from battery...6
1.3.2 Battery chemistries ...6
1.3.3 Current concern with Li-ion battery...8
1.4 AN INTRODUCTION TO TESTING REQUIREMENTS OFEVBATTERIES...9
1.5 RESEARCH PROBLEM...10
1.6 RESEARCH QUESTION...12
1.7 THESISOUTLINE...13
2.1 ESSENTIAL PARTS OF AUTOMOTIVE BATTERY...16
2.2 LI-ION BATTERY CELL CONSTRUCTION AND MATERIAL...20
2.2.1 Components of Li-ion battery cell ...20
2.2.2 Cathode...20
2.2.3 Anode materials ...23
2.2.4 Electrolyte...24
2.2.5 Separator and current collector ...25
2.2.6 Production and types of commercial Li-ion cell...26
2.3 OPERATION OF ALI-ION BATTERY CELL...27
2.3.1 Origin of cell voltage and capacity...29
2.3.2 Origin of cell power capability and impedance...32
2.3.3 Variation of cell capacity, OCV, power and impedance with other variables...35
2.3.3.1 Charge-discharge rate dependency...35
2.3.3.2 Temperature dependency...35
2.3.3.3 Time dependency ...36
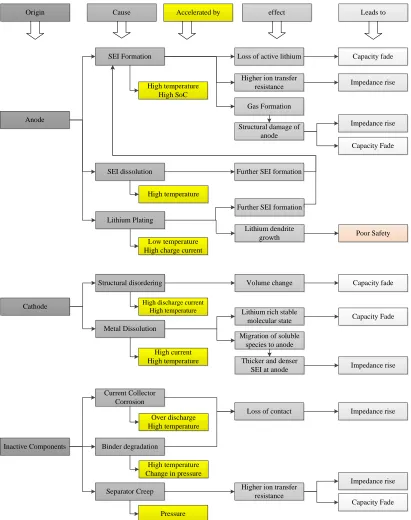
2.3.4 Ageing process of the cell ...37
2.3.4.1 Summary of ageing mechanisms...39
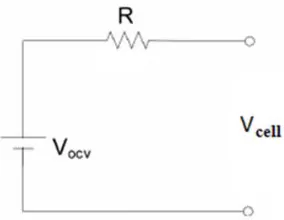
2.4 ELECTRICAL EQUIVALENT CIRCUIT OF A CELL...41
2.5 SUMMARY...43
3. A REVIEW OF EXISTING CHARACTERISATION TESTS OF LI-ION BATTERY ...44
3.1 CAPACITY TEST...45
3.2 PULSEPOWERTEST...51
3.4 OPENCIRCUITVOLTAGETEST...62
3.4.1 OCV hysteresis...64
3.5 SUMMARY...67
4. THE GAP BETWEEN AUTOMOTIVE REQUIREMENTS AND CURRENT TESTING PROCEDURES...69
4.1 CAPACITY TEST...69
4.2 EISTEST...73
4.3 OCVTEST...75
4.4 SUMMARY...79
5. METHODOLOGY OF RESEARCH ...80
6. DRIVING RANGE ESTIMATION THROUGH CAPACITY TESTING .83 6.1 CHAPTERINTRODUCTION...83
6.2 EXPERIMENTAL METHOD...86
6.2.1 Standard constant current capacity test ...87
6.2.2 Capacity test with drive cycle ...87
6.2.3 Introduction of current de-rating into capacity test ...89
6.2.4 Validation test with drive cycle...89
6.3 RESULTS AND DISCUSSION...90
6.3.1 Standard constant current capacity...90
6.3.2 Extracted capacity with drive cycle ...91
6.3.3 Capacity and energy after de-rating...92
6.3.4 Validation...100
6.3.5 Future potential application ...101
7. CONSIDERATION OF THE RELAXATION PHENOMENON FOR THE
EIS TEST TECHNIQUE...105
7.1 CHAPTERINTRODUCTION...105
7.2 EXPERIMENTAL METHOD...106
7.3 RESULTS AND DISCUSSION...109
7.3.1 Short duration relaxation test ...109
7.3.2 Long duration relaxation test ...114
7.3.3 SoC dependence of relaxation ...124
7.3.4 Discharge current rate dependency...126
7.3.5 Temperature dependency...129
7.4 CHAPTERCONCLUSION...131
8. OCV AND OCV HYSTERESIS TESTING OF LI-ION CELLS ...134
8.1 CHAPTER INTRODUCTION...134
8.1.1 OCV characterisation ...134
8.1.2 OCV hysteresis...135
8.1.2.1 Introduction of OCV hysteresis into BMS ...137
8.2 EXPERIMENTAL METHOD...139
8.2.1 Discharge & charge OCV characterisation procedure...140
8.2.1.1 OCV with different step size test procedure...140
8.2.1.2 OCV test procedure at different temperature and charge/discharge rate 142 8.2.2 Proposed OCV Hysteresis Test Procedure...142
8.3 RESULTS AND DISCUSSION...144
8.3.1 Charge and discharge OCV characteristics...144
8.3.1.2 OCV characteristics with different step size ...145
8.3.1.3 Temperature dependency of OCV...149
8.3.1.4 Charge-Discharge rate dependency of OCV ...151
8.3.2 Hysteresis assessment of cells...153
8.3.2.1 Erroneous hysteresis...153
8.3.2.2 OCV and hysteresis against SoC...154
8.3.2.3 Temperature dependency of hysteresis ...158
8.3.2.4 Discharge rate dependency of hysteresis...159
8.3.3 OCV hysteresis and model simulation: a case study ...160
8.4 CHAPTERCONCLUSIONS...164
9. DISCUSSION AND FUTURE DIRECTION...167
9.1 INTRODUCTION...167
9.2 DISCUSSION...167
9.3 FUTURE DIRECTION...180
10. CONCLUSIONS ...183
List of Figures
Figure 1: Basic operation of electric powertrain of BEV. ...4
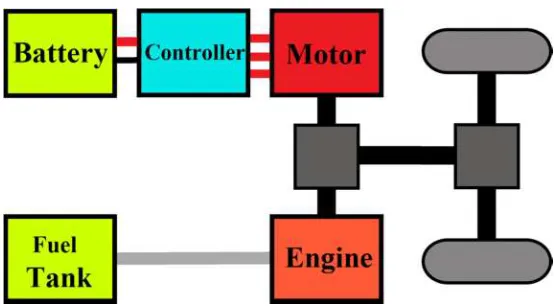
Figure 2: Basic operation of a parallel hybrid powertrain. ...5
Figure 3: Basic operation of a series hybrid powertrain. ...5
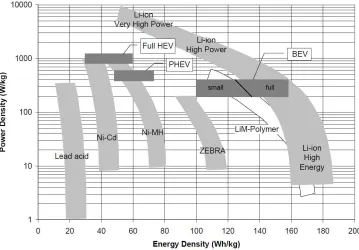
Figure 4: Comparison of battery technologies in terms of energy density and power density [10]. ...7
Figure 5: Datasheet of a Li-ion battery cell [19]...9
Figure 6: Basic structure of an EV battery pack ...17
Figure 7: current and voltage relationship for different output power...17
Figure 8: Different components of an automotive battery pack. Photo courtesy: WMG centre HVM Catapult...18
Figure 9: Material cost breakdown of a 25kWh EV battery pack [37]. ...19
Figure 10: Basic construction and operation of a Li-ion battery cell...20
Figure 11: Construction of cylindrical, prismatic and pouch Li-ion cell [37]. ...27
Figure 12: Electrical circuit diagram of a cell during (a) charge and (b) discharge. .28 Figure 13: Stable working voltage of different cell material vs Li/Li+...30
Figure 14: Simple water tank model of Li-ion cell with example data of graphite anode and LFP cathode. Yellow shaded area shows the percentage of lithiated electrode. Figure adopted from [52]...31
Figure 15: Open circuit voltage of a Li-ion cell with LFP cathode and graphite anode. ...32
Figure 16: The model of double layer region as proposed by [56]...34
Figure 17: Change of capacity and power with temperature. Data reported byZhang et al.[58]. ...36
Figure 19: Cause and effect of main ageing mechanisms and their accelerating
factors of li-ion cell. ...40
Figure 20: Simplest Li-ion battery model. ...41
Figure 21: An equivalent circuit model of Li-ion cell. ...42
Figure 22: CC-CV charging topology of Li-ion cell...46
Figure 23: Discharge topologies (a) voltage and current (b) power and load resistance at constant load mode of discharge, (c) voltage and current (d) ) power and load resistance at constant current mode of discharge, (e) voltage and current (f) ) power and load resistance at constant power mode of discharge, (g) output power comparison among three modes of discharge. ...48
Figure 24: capacity variation of the cell due to variation in (a) discharge current, (b) operating temperature...51
Figure 25: Discharge current pulse and relative voltage drop. ...53
Figure 26: Pulse profile for pulse power test used in IEC 62660-1 test standard [101]. ...54
Figure 27: HPPC test profile [102]. ...54
Figure 28: Pulse profile for pulse power test used in ISO 12405 test standard [25]..55
Figure 29: Nyquist plot of a RC circuit...58
Figure 30: Example EIS plot...59
Figure 31: Updated electrical equivalent circuit of Li-ion cell. ...60
Figure 32: Open circuit voltage at different SoC of a Li-ion battery cell. ...63
Figure 34: Illustration of path dependence shrinking core model as proposed by
Srinivasan and Newman [121]. SoC of LFP electrode was adjusted to 50 % SoC by
(a) charging from 0 % SoC and (b) discharging from 100 % SoC. The change of the
core or further growth of new shell is shown due to further charge from 50 % SoC in
both cases. ...66
Figure 35: Current demand to a cell, of a vehicle’s battery pack, for 400 second of
city driving. ...72
Figure 36: Research methodology ...81
Figure 37: Two duty cycles (a) Artemis urban and (b) Artemis motorway generated
for this particular cell using 1-d sizing tool. ...88
Figure 38: Discharge capacity of the cell at four different discharge rates. ...90
Figure 39: Capacity variation with constant current discharge rate...91
Figure 40: Discharge capacity of the cell at two different driving scenarios, Artemis
urban and Artemis motorway...92
Figure 41: Discharge capacity (Ah) yield for a two-phased discharge profile. The
solid lines indicate discharge rates employed (as in the caption) and dotted part
indicates the C/3 rate. ...93
Figure 42: Cell temperature rise associated with discharge rate...94
Figure 43: Discharge energy (Wh) yield corresponding to the two-phased discharge
profile described in Figure 40. ...95
Figure 44: OCV vs capacity of the cell. The shaded area represent maximum energy
can be stored within the cell...97
Figure 45: Cell voltage versus 10 second pulse currents is shown in (a); the
gradients of the curves indicate the total resistance. Total resistance is then plotted as
Figure 46: Total discharge energy vs average test current; red is the model
approximation (Equation (22)) and blue is the experimental results. Error bars show
cell to cell variations and experimental error. ...99
Figure 47: Validation results (green dots) for the two duty cycles. Black markers
show corresponding capacity (Ah), round dots for duty cycles and diamond for
continuous discharge (blue), red is for the model estimation. ...101
Figure 48: Illustrating how capacity fade and power fade of the traction battery can
lead to changes in theࡱࢉࢋvsࢉࢋcurve. The data points here are purely
illustrative...102
Figure 49: Nyquist plots of the cell from 0 – 10 min. Note that two different scales
have been used for figures (a), (b) and (d), and (c) and (e)...110
Figure 50:Rowith experimental error as error bar for all the Li-ion cells from 0 min to 10 min. Note that two different scales of y-axis are used. ...113
Figure 51: Typical Nyquist plot recorded within this study. Two measurement was
performed on same cell with two experimental setup...115
Figure 52: Typical Randles equivalent circuit model showing an inductor (L1), the
pure ohmic resistance (Ro), charge transfer resistance (RCT), double layer capacitance
(Cdl) and the short finite length Warburg impedance (WS1). ...115
Figure 53: EIS spectra of several Li-ion cells at different relaxation time ranging
from 10 min to 900 min after SoC adjustment. Note that different scales have been
used for figures (a), (b) and (d), and (c) and (e)...117
Figure 54:Rowith experimental error as error bar for all the Li-ion cells at selected time intervals. Note that different scales of y-axis are used. ...118
Figure 55: Typical plot of capacitance for Li-ion cell (Cell 1) as a function of
Figure 56: Typical plot of RTfor Li-ion cell (Cell 1) as a function of relaxation time
(Experimental error is shown as an error bar)...121
Figure 57: Change of capacitance of cell 5 from 0 min to 15 hr of relaxation period.
Blue part was recorded by the short duration relaxation test and red part was
recorded by long duration relaxation test...123
Figure 58: EIS spectra of cells 1 at (a) 0 % SoC, (b) 20 % SoC, (c) 50 % SoC, (d) 80
% SoC and (e) 100 % SoC. Relaxation time ranging from 10 min to 900 min after
SoC adjustment. ...125
Figure 59: EIS spectra of cell 1 at relaxation time ranging from 10 min to 900 min
after 50 % SoC adjustment with (a) C/10, (b) 1C, (c) 3C and (d) 5C discharge
current. ...127
Figure 60: EIS spectra of cells 1 at 50 % SoC at (a) -5 °C, (b) 10 °C, (c) 25 °C and
(d) 40 °C. Note that different scales are used in (a) and (b)...130
Figure 61: Flowchart for (a) discharge OCV and (b) charge OCV; value of x is 4%,
10%, 25%, 50% and 100%...141
Figure 62: Flowchart for OCV hysteresis characterisation. Compared to Figure 60,
OCVctest process starts just afterܱܥܸ݀test process...143
Figure 63:ܱܥܸ݀as a function of SoC and varying step size for 40 Ah NMC cell.
...146
Figure 64:ܱܥܸ݀as a function of discharge capacity and varying step sizes for (a)
40 Ah NMC cell, (b) 20 Ah LFP cell, (c) 2.2 Ah NMC cell and (d) 13.4 Ah LTO
cell. ...147
Figure 65:ࡻࢂࢉas a function of charge capacity and varying step sizes for (a) 40
Ah NMC cell, (b) 20 Ah LFP cell, (c) 2.2 Ah NMC cell and (d) 13.4 Ah LTO cell.
Figure 66: Change in (a) discharge OCV and (b) charge OCV with temperature...151
Figure 67: Rate dependency of (a) discharge (b) charge OCV. ...152
Figure 68: Plot of OCVcand OCVdwith a misleading assessment of hysteresis when
the initial remaining capacity is incorrectly assumed to be zero for cell 1. ...154
Figure 69: Open circuit voltage as a function of charge and discharge capacity with 4
% ΔQnstep sizes when initial condition was matched for 40Ah NMC cell ...154
Figure 70: OCVcand OCVdagainst SoC for (a) 40 Ah NMC cell, (b) 20 Ah LFP
cell, (c) 2.2 Ah NMC cell and (d) 13.4 Ah LTO cell...156
Figure 71: Hysteresis voltage vs SoC for (a) 40 Ah NMC cell, (b) 20 Ah LFP cell,
(c) 2.2 Ah NMC cell and (d) 13.4 Ah LTO cell. Error bars shows standard error
among cells tested. ...156
Figure 72: Change in hysteresis voltage with temperature. Error bars shows standard
error among cells tested. ...158
Figure 73: Change in hysteresis voltage with charge-discharge rate. Error bars shows
standard error among cells tested...159
Figure 74: Simulated scenario for hysteresis transition. The battery model, starting
from 30%, is fully charged, discharged to 10% and charged back to 30%...161
Figure 75: Hysteresis model transition with the hysteresis voltage assumed a
constantࡴࢠ=ࡴ ࢇ࢞. The transition model can deviate from the۽۱܄܋(red) and
ࡻࢂࢊ(green) characteristic curves...162
Figure 76: Hysteresis model transition with the hysteresis voltageࡴࢠassumed to be
a function of SoC. The transition model follows the۽۱܄܋(red) andࡻࢂࢊ(green)
Figure 77: Voltage difference between transitioning OCV andܱܥܸܿandܱܥܸ݀
curves. Blue line: Case 1, constant hysteresis simulations; Red line: Case 2, adaptive
hysteresis. ...163
Figure 78: Impedance spectra of a cell at (a) 0 °C and (b) -10 °C at 70 % SOC at
different ageing state as reported in [58], solid lines are as reported and dotted lines
are prediction if a longer relaxation period was used to reach equilibrium. ...172
Figure 79: Voltage response to the high pulse power characterisation profile reported
List of Tables
Table 1: Comparison between different Li-ion cell cathode chemistry and
performance of respective cell with carbon anode...21
Table 2: Presence of different characterisation and ageing tests in current automotive
test standards ...45
Table 3: Capacity test parameters used in different standards ...47
Table 4: Pulse power test conditions used in different standards ...55
Table 5: Cell details and associated RMS current used during EIS measurements. 106
Table 6: Capacitance with experimental error of Li-ion cells as a function of
relaxation time...120
Table 7: RTwith experimental error of Li-ion cells as a function of relaxation time.
...121
Table 8: Change of Roas a function of relaxation period at different C rate...128
Table 9: Cell details ...139
Acknowledgement
The research would not have been as fascinating without the remarkable people I was
introduced with along the journey. First and foremost I would like to thank my
supervisors, Professor Paul Jennings and Dr. Andrew McGordon for their guidance,
support, trust and ‘the freedom to create’. I am indeed fortunate to have Professor Paul
Jennings to supervise me about overall research, its progression and presentation. To
have Dr. Andrew McGordon to guide me is a privilege not only in this doctoral
experience but beyond that as well. With his technical knowledge and quick response he
has been invaluable. I feel incredible and it is an honour to work with them.
I would like to thank Dr. Yue Guo, Mr. Mark Amor-Segan, Dr. Gael Chouchelamane,
Dr. Chris Lyness, Dr. Kotub Uddin, Dr. James Marco and Dr. W. Dhammika Widanage
for brainstorming discussions, guidance and support they provided for writing journal
and conference papers.
I am thankful to other colleagues Mr. Gunwant Dhadyalla, Mr. Andrew Moore, Mr
Terry Timms, Mr. John Palmer, Mr. Limhi Somerville, Mr. Sina Shojaei, Dr.
Ravichandra Tangirala, Dr. James Taylor for their valuable discussion and support. I am
grateful to Dr. Hillol Roy, Dr. Brahmadevan Venniyod Padma Rajan, Dr. James
Mackrill, Mr. Abhishek Das, Mr. Arnab Palit for sharing their PhD experience. I will
certainly have fond memories of the leisurely chats we had.
Special thanks to Rakib Raihan, Intekhab Alam, Rabeya Akther, Tapos Barai and Ayan
Tarafder for their unconditional support and to give me their time when there was no lab
work to do or read any research article.
I am thankful to WMG, University of Warwick for financial support, without that the
journey was not possible.
My deepest appreciation goes to my parents, brother, uncles, aunties, cousins, sister
in-law, parents-in law and grandparents. A special thanks to my Ma to keep me on track in
all my ventures. Finally I would like to thank my wife for her patience with me during
Declaration
This thesis is presented in accordance with the regulations for the degree of
Doctorate of Philosophy. It has been written and complied by myself and has not
been submitted anywhere else. The work in this thesis has been undertaken by me
except where otherwise stated.
Signed: Date:
List of Publications
Journal Publications
A. Barai, K. Uddin, W.D. Widanalage, A. McGordon and P. Jennings, “The effect of immediate cycling history on total energy of lithium-ion batteries for electric vehicles” Journal of Power Sources, 2016. 303(0): p. 81-85.
A. Barai, W. Dhammika Widanage, J. Marco, A. McGordon and P. Jennings, “A study of the open circuit voltage characterisation technique and hysteresis assessment of lithium-ion cells”, Journal of Power Sources, 2015. 295(0): p. 99-107.
A. Barai, G. H. Chouchelamane, Y. Guo, A. McGordon and P. Jennings, “A study on the impact of lithium-ion cell relaxation on electrochemical impedance spectroscopy” Journal of Power Sources, 2015. 280(0): p. 74-80.
A. Barai, G. H. Chouchelamane, A. McGordon and P. Jennings, “Impact of lithium-ion cell relaxation on electrical impedance spectroscopy – effect of SoC, temperature and discharge C-rate” Draft version, will be submitted in relevant journal.
Conference Proceedings
A. Barai, A. McGordon and P. Jennings, “A study of the effect of short-term relaxation on the EIS test technique for EV battery cells” International Workshop on Impedance Spectroscopy, Chemnitz, Germany, 23-25 September 2015.
A. Barai, Y. Guo, A. McGordon and P. Jennings, “A study of the effects of external pressure on the electrical performance of a lithium-ion pouch cell” Connected Vehicles and Expo (ICCVE), 2013 International Conference on , pp.295-299, 2-6 Dec. 2013.
Abstract
Equivalent circuit models (ECM) are required to provide an on-board model of battery behaviour by battery management systems (BMS). The performance of ECMs is dependent on characterisation test results. The components of the ECM are commonly parameterised using electrochemical impedance spectroscopy (EIS) results, open circuit voltage (OCV) test results, and capacity test results. Therefore, these three tests are important for ECM parameterisation. Although the test procedures for these characterisation tests exist to test Li-ion cells for a range of applications e.g. portable electronic devices, they fail to provide essential information for automotive application due to the different requirements of vehicles (e.g. high power and energy, wide operating environment, long service life). This thesis reports research to improve consistency, accuracy and interpretation of characterisation test techniques for Li-ion battery cells for automotive application.
The capacity of the battery pack is a vital parameter required for an ECM to estimate driving range. Existing techniques for predicting the driving range of an electric vehicle use the capacity value in Amp-hours, measured by existing capacity test techniques. In this thesis, experimental evidence that establishes the advantages of using capacity in Watt-hours instead of the capacity in Amp-hours as per the standard test is presented for the first time. Moreover, it is reported that measured battery capacity can vary by up to 5.0 % depending on the length of intermediate rest period.
The OCV is another crucial parameter of ECM. The path dependence of OCV is a distinctive characteristic of Li-ion batteries which is known as OCV hysteresis. OCV test procedures used previously do not consider the initial conditions of the cells and capacity variations that show a change in OCV, leading to an apparent increase in, or erroneous, hysteresis. Using a new methodology which addresses issues mentioned above, OCV and OCV hysteresis has been quantified for different Li-ion cells for the first time. The test results show that a battery’s OCV is directly related to the discharge capacity, not the more commonly used SoC. The maximum hysteresis was found in a LiFePO4 (LFP) cell and lowest in a LTO cell, although still measurable. A dynamic
hysteresis model is used to show how better OCV prediction accuracy can be achieved by a BMS when hysteresis voltage is a function of SoC instead of assuming it to be a constant, as traditionally done.
EIS is commonly used to parameterise an ECM. For the first time this thesis reports that the time period between the removal of an electrical load and an EIS measurement affects the results. The study of five commercially available cells of varying capacities and electrode chemistries show that, regardless of the cell type, the maximum impedance change takes place within the first 4 hours of the relaxation period. Therefore a standardised relaxation period of minimum 4 hours should be allowed before performing EIS test. In addition to ECM parameterisation, EIS has been considered for online measurement, integrated with a BMS. This thesis concluded that the use of EIS as a fast measurement tool will be unreliable because of the relaxation effect.
Abbreviations
AC Alternating Current
BEV Battery Electric Vehicle
BMS Battery Management System
CAFE Corporate Average Fuel Economy
CC Constant current
CO2 Carbon-di-Oxide
CPE Constant Phase Element
CV Constant Voltage
DCR Direct Current Resistance
DEC Diethyl Carbonate
DMC Dimethyl Carbonate
DoD Depth of Discharge
DoE Department of Energy
EC Ethylene Carbonate
ECM Equivalent Circuit Model
EIS Electrical Impedance Spectroscopy
EMC Ethyl Methyl Carbonate
EoL End of Life
EV Electric Vehicle
FBE Full Battery Energy
HEV Hybrid Electric Vehicle
HPPC Hybrid Pulse Power Characterisation
IEC International Electrochemical Commission
ISO International Standardisation Organization
LCO Lithium Cobalt Oxide
LFP Lithium Iron Phosphate
LMO Lithium Manganese Oxide
LTO Lithium Titanate Oxide
MW Mega Watt
NMC Lithium - Nickel Manganese Cobalt
Ni-Cd Nickel-Cadmium
Ni-MH Nickel-Metal-Hydride
OCV Open Circuit Voltage
ODE Ordinary Differential Equation
OEM Original Equipment Manufacturer
PC Propylene Carbonate
PPC Pulse Power Characterisation
RBE Remaining Battery Energy
RDR Remaining Driving Range
PHEV Plug-in Hybrid Electric Vehicle
SAC Standardisation Organization of China
SEI Solid Electrolyte Interface
SoC State of Charge
SoE Sate of Energy
SoH State of Health
UPS Uninterruptable Power Supply
1.
Introduction
One of the main challenges to success of electric vehicles is having the correct
energy storage system. Since their introduction, lithium-ion (li-ion) secondary
batteries are of great interest as an energy storage solution for electric vehicles. The
primary challenge in design of a Li-ion battery pack for electric vehicles is
understanding Li-ion cell behaviour. Characterisation tests provide insight into the
behaviour of the cell. However, these characterisation tests have received little
attention from an automotive perspective. This thesis addresses the issues with
existing characterisation tests in a systematic manner. To begin, this chapter provides
an introduction to the applied research of characterisation test techniques for Li-ion
battery cells in an automotive context.
1.1 An introduction to the recent trends in the automotive industry
Technological advancement and increase in comfort of living in past two centuries
have been largely derived from exploitation of non-renewable fossil fuel. The fossil
fuel like coal, natural gas, oil is created over millions of years, and we are on the
course of consuming these within hundreds of years. Burning fossil fuel creates CO2
which largely contributes to the warm-up our planet Earth [1, 2]. Although, medium
to long term implication of burning these fossil fuels and CO2 emission on our
warming planet is not clear yet, however, it is decisively clear that the scientific
community, government bodies and general public are attempting to reduce CO2
A large portion of global CO2 emission is generated by transport system; which is
mainly dominated by road transport system [1]. Therefore, to reduce CO2 emission
level by road transport system, different legislative authorities set the global CO2
emission fleet average targets to OEMs [3, 4]. These targets are a key driver for the
recent trend in automotive industry (vehicles with reduced CO2emission level). The
European Union passed legislation in April 2009 targeting to reach average fleet CO2
emission of 95 grams per kilometre by 2020 [4]. In the United States, the Corporate
Average Fuel Economy (CAFE), standards sets a target to OEMs of passenger cars
and light trucks to achieve an average fuel economy of 6.75 litres per 100 kilometres
(42 mpg, approximately 150 grams per kilometre) by 2020 [5]. Other countries such
as China are also imposing environmental regulations to the automotive OEMs.
Heavy fines are imposed on OEMs who fails to show progress to comply with the
regulation.
To meet the target CO2emission level, introduction of vehicles with smaller internal
combustion engine (ICE) size can be an option to OEMs. Smaller engine size
typically has lower CO2 emission level. It can offset higher end premium vehicles
with higher CO2emission level. One good example of use of reduced engine size is
‘Volkswagen Golf Mk7’ which is gone through a significant reduction of engine size
compared to previous models (e.g. Mk 4 or earlier). However, only reduction of the
engine size is not an option for OEMs when minimum performance cannot be
compromised (e.g. premium vehicle manufacturers). In addition, future CO2
One solution to meet the CO2 emission target without compromising power
capability of the vehicle is to introduce an electric powertrain to the vehicle [6].
Hybridisation of conventional powertrain (ICE) with electric powertrain allows use
of smaller engine size whilst maintaining power capability of the vehicle. All-electric
vehicles with 0 gram per kilometre can dramatically improve fleet average CO2
emissions.
Even before these legislations were imposed, OEMs were trying to increase fuel
efficiency of their vehicles further, and hence, introduce electric powertrain. It was
mainly derived by the continuous increase in oil price since 1970s [7]. Several
classes of electric vehicles (EV) (hybrid electric vehicle (HEV), plug-in hybrid
electric vehicle (PHEV), battery electric vehicle (BEV) etc.) have since been
developed and co-exist as an integral part of OEM respective fleets. These vehicles
are now slowly increasing their market share thanks to the likes of the Nissan LEAF,
GM Volt, Toyota Prius and Tesla model S [8].
1.2 An introduction to EV operation
The basic operation of an electric powertrain is shown in Figure 1. A BEV is
powered by an electric motor instead of a gasoline engine. Electric energy is
delivered to motor from the controller and controller receives energy from battery
pack installed in the vehicle. One advantage of having a motor is, it can work as a
generator during slowing down or stopping a vehicle i.e. when brake pedal of a
vehicle is used, recovering kinetic energy of the vehicle. This energy recovery
Figure 1: Basic operation of electric powertrain of BEV.
In a pure EV (BEV) vehicle only electric powertrain is used and vehicle movement
is created solely by electric power supplied by battery as shown in Figure 1. In a
hybrid electric vehicle (HEV), the electric powertrain works alongside the ICE
powertrain. There are different complex mechanisms how two different powertrains
work in a hybrid vehicle; which mainly grouped as parallel hybrid and series hybrid.
In a parallel hybrid vehicle a downsized ICE works alongside an electric motor,
which is powered by battery pack. Figure 2 shows basic block diagram of the
parallel hybrid vehicle. The ICE and the motor are independently connected to the
transmission and can move the vehicle independently. This setup allows using either
system in an operating condition, whichever is most efficient, i.e. motor at lower
Figure 2: Basic operation of a parallel hybrid powertrain.
In a series hybrid vehicle both powertrains are connected in a single line like series
connection as shown in Figure 3. In this setup only electric motor drives the vehicle.
A downsized ICE is used exclusively for electricity generation when battery pack is
close to fully discharged. The electricity is used either to power the motor or charge
the battery. In this setup the ICE can operate at maximum efficiency region, since it
[image:27.595.112.389.68.222.2]is decoupled from the vehicle demand.
Figure 3: Basic operation of a series hybrid powertrain.
In these EV powertrain arrangements the vehicle moves or can move solely by
motor, which helps to reduce CO2 emission level. The motor gets its electricity
battery, which at the advent of hybrid and electric vehicle was relatively little
studied.
1.3 An introduction to EV battery
1.3.1 EV requirements from battery
EVs need a minimum power capability to accelerate to and maintain its maximum
speed. They also need minimum energy storage system for its maximum driving
range. These two characteristics are commonly known as power and range capability
of a vehicle. Respectively, for internal combustion engine (ICE) vehicles, power
capability depends on the engine size and range depends on the size of the gasoline
tank. On the other hand, for EV, not only range but also power capability is directly
related to the battery pack. Maximum power can be delivered from battery to motor,
and range depends on battery technology and capacity of the battery pack. Moreover,
EVs are expected to have similar lifetime and operate at similar climatic conditions
as ICE vehicles. Thus, batteries need to be rechargeable with higher cycle life
(number of times battery can be charged and discharged from 0% to 100%) and wide
operating temperature range. Also, recharge capability at higher rate is desirable to
capture regenerative braking energy [9].
1.3.2 Battery chemistries
From OEMs to user it is expected that new generation EVs would have similar
power and range capability of ICE vehicle. Therefore, new generation EV batteries
will need to meet the demand of high power and energy capability. Power and
mass. A comparison among battery technologies has been done byKalhammer et al
which is shown in Figure 4 [10]. Power density is plotted against energy density of
in-production rechargeable battery technologies i.e. lead-acid, nickel-cadmium
(Ni-Cd), nickel-metal-hydride (Ni-MH), molten salt (ZEBRA) and Li-ion battery
technology. It is noticeable that the batteries designed to provide high power have
[image:29.595.116.475.264.514.2]considerably lower energy density compared to similar battery technology.
Figure 4: Comparison of battery technologies in terms of energy density and power
density [10].
The rectangular domains in Figure 4 represent the approximate power and energy
requirement of average EV types. All variants of lead-acid batteries have lower
energy and power density as required by any kind of EV. Due to toxicity of
cadmium, Ni-Cd batteries are banned from general purpose use [11] and ZEBRA
batteries works at high temperature which previously identified as unsuitable for EV
requirement of HEV and PHEV, and, for BEV li-ion is the only option. Previously
HEVs and PHEVs with Ni-MH battery pack has been introduced e.g. Toyota Prius
V. However, currently Li-ion is considered for automotive application as it is the
only option for all types of EVs.
Li-ion batteries also have higher cycle life compared to the other battery chemistries
and wide operating temperature range [9]. Higher charging efficiency and lower
self-discharge rate make Li-ion batteries environment friendly and ensure they can retain
charge for longer duration. Although, they are prone to overcharge and
over-discharge, a battery management system (BMS) is commonly used to protect Li-ion
batteries. These advantages of Li-ion battery over other battery chemistries put them
into main focus for automotive use and thus are considered exclusively in this thesis.
1.3.3 Current concern with Li-ion battery
Sales of EVs have increased by 40% over last decade [12]. It is predicted the sales
figure of EV during 2013, will be doubled in 2016 and more than tripled in 2020 [8,
13]. Technological advancement of Li-ion battery and development of next
generation testing strategy will play a major role behind this market boom. Despite
increased market share of EV, several recent incidents reveal that current testing
can’t provide the accurate knowledge of their performance in real world.
Discrepancy of driving range shown on EV dashboard and actual distance travelled
is a common issue with EV [14]. Battery capacity loss of Nissan Leaf reported in
2012, in several states in USA can be another good example [15]. Battery capacity
available dropped well below the prediction (i.e. tested for). In another case GM
after a crash) [16]. The most disturbing example can be the battery fire issue of BYD
taxi in China, UPS Airlines Flight 6 crash due to Li-ion battery and Boeing 787
Dreamliner battery pack fire issue [17, 18]. All these incidents points to the
inadequate testing of the Li-ion batteries for the application. Therefore, battery
testing standards/legislations/ procedures need to be researched to propose any
improvements necessary.
1.4 An introduction to testing requirements of EV batteries
OEMs need to evaluate battery performance, lifetime and safety accurately, for
overall EV design, ensuring occupants safety and estimate battery warranty and
performance. Batteries need to pass through different steps of evaluation process
before they can be used for EV. The evaluation process starts with the battery
datasheet supplied by the manufacturers. Like any datasheet, a battery datasheet
provides key information of the battery. An example datasheet of Li-ion cell is
[image:31.595.114.374.508.737.2]shown in Figure 5.
A datasheet provides important basic information on the battery cell such as
capacity, voltage, maximum charge-discharge current, operating temperature,
dimensions, weight etc. This information is helpful for preliminary selection of the
battery. This information can be directly compared with EV requirements. However,
it does not give insight into the battery performance over the entire operating
conditions of EV. For example, nominal capacity does not promise that capacity will
be retained either over the operating temperature range or at all charge-discharge
rates. Generally, nominal capacity is measured at 25oC with low C rate discharge, or at a temperature and C rate selected by the manufacturer. Automotive OEMs need to
know the actual battery capacity over its operating temperature range and at different
C rates. Similarly, maximum charge-discharge rates are not guaranteed for all
temperature and at all SoC. There is no information about SoC vs open circuit
voltage (OCV), internal impedance and electrical equivalent circuit of the cell. These
are critical information for BMS to ensure reliable and safe operation of an EV
battery pack.
As the battery datasheet lacks information needed for EV battery and powertrain
design, automotive OEMs have need of testing batteries to gather the information
they need. Characterisation tests are used to evaluate battery performance like energy
density, power capability, open circuit voltage (OCV), internal resistance, AC
impedance, for different operating scenarios.
1.5 Research problem
Since their introduction by Sony in the early 1990 [20], Li-ion batteries have been
They have gone through extensive amount of testing. However, these numerous tests
were aimed mainly at the consumer electronics market. By nature, consumer
electronics operate in a narrow temperature band close to room temperature and need
only low power capability. Accurate estimation of remaining battery capacity
although welcomed, is not a strict requirement. In contrast, an EV needs to operate in
a wide temperature band and requires high power capability and needs to estimate
remaining capacity, and thus remaining driving range, accurately. Therefore,
characterisation tests designed aiming to characterise the batteries for consumer
electronics applications are not suitable for EV application. Also, consumer
electronics have relatively a short lifetime compared to a vehicle [21]. Long term
performance of a battery is not a major issue for this application area as the product
reaches end of life (EoL) well before the battery. However, it is a major concern for
EVs, where long lifespan is desirable and minimum of 5 years battery warranty is
required by legislation [22].
To assist the development process of Li-ion batteries for EV applications, different
standardization body/organization published different test procedures/standard
[23-27]. The common characterisation tests among these standards are capacity test,
pulse power test and OCV test. In addition to these standard characterisation tests,
researchers introduced other characterisation tests like electrical impedance
spectroscopy (EIS) to gain insight into the electrochemical processes within the cell.
These characterisation tests are mainly adapted from the test procedure used for
Li-ion batteries for consumer electronics and other battery chemistries for high
given towards understanding these tests from an automotive perspective. Battery
safety related test standards already have been identified as inappropriate for
automotive applications and an attempt has been made to update them [28].
Although the battery characteristics important from an automotive perspective and
thus the characterisation tests which measure these characteristics is known;
however, the methodologies of the tests have not been investigated. In particular,
accuracy and reproducibility of the characterisation tests from an automotive
perspective and any additional parameters that needs to be introduced to the test
procedure due to nature of automotive application have largely being ignored. Also,
the test data might require a different interpretation for automotive (and similar)
application compared to consumer electronics.
To ensure accuracy and reproducibility it is crucial to develop suitable test protocols
which minimize uncertainties and introduce any parameter significant for automotive
application. Also, test procedures need to be concise but record all cell behaviours
(e.g. hysteresis of cell voltage), which are not significant for consumer electronics,
but important for automotive application and not yet been considered.
1.6 Research question
The aims of this research are “how to improve accuracy, consistency and
interpretation of characterisation test techniques for Li-ion battery cells for
automotive applications”.
The following objectives will be pursued to reach the goal of the research mentioned
Define requirements of automotive application
Determine relevant characterisation tests for further investigation
Evaluate existing test procedures/standards against automotive requirement
Propose any improvements necessary to existing test procedures to ensure
accuracy and reproducibility of test results
Propose introduction of any new parameter to testing which are significant
for automotive application
Propose any requirement of different interpretation of test results
Validate effect of these improvements
1.7 Thesis Outline
The thesis mainly comprises of three main parts. Chapters 2 to 4 cover Li-ion battery
operation, testing requirements, limitations and identification of gap in knowledge.
Chapter 5 is about proposed methodologies of research and evaluation of the
methodologies. Chapters 6, 7 and 8 present experimental evidence along with
discussion with the results. In Chapter 9 and 10 overall discussion, future extension
and conclusions are presented.
Chapter 2 starts with an introduction about EV battery pack architecture.
Construction and operating procedure of the cell have been discussed; which is
followed by the explanation of how electrochemical procedures are represented with
electrical equivalent circuit model. This chapter will provide baseline knowledge of
Current characterisation test procedures used by researchers and outlined in
standards are reviewed in Chapter 3. The test procedures are discussed along with
the theoretical background. Along with Chapter 2, this chapter aids to understand the
gap between test procedures, Li-ion cell operation and automotive requirements.
An autopsy of current test procedures along with automotive requirements is
reported in Chapter 4. The gap in knowledge with the characterisation tests are pin
pointed in this chapter. This chapter end with a summary of gap in knowledge and
research requirements of current characterisation tests.
The research approach to bridge the identified gaps with the characterisation tests is
discussed in Chapter 5. The approach selected in this thesis provides a
comprehensive perspective to the research problem and contributions to the research
community.
In Chapter 6 presents experimental evidence that establishes the advantages of
measuring battery capacity as Watt-hours instead of Amp-hours as per standard
characterisation test. Also, proposal and evaluation of introduction of current
de-rating as used by EVs to the capacity testing is discussed.
The repeatability and reproducibility of EIS test results are researched in Chapter 7.
In this study relaxation which was not considered before for an EIS test has been
OCV, a fundamental characteristic of Li-ion cell, is not measured as part of existing
standard test procedures. In Chapter 8 an OCV test procedure is proposed and
evaluated. The OCV hysteresis of different chemistry cells also measured using
proposed methodology.
In last part of this thesis, an overall discussion and interconnectivity of contributions
toward different characterisation techniques are included in Chapter 9. Also the
significance of the contributions in contrast to the existing knowledge are discussed,
which followed by natural extension of this work in future.
Finally, Chapter 10 presents the overall conclusions of the overall contributions
2.
A Review of Li-ion Battery Technology for Automotive
Applications
Li-ion batteries have been widely used as main energy storage devices in portable
consumer electronics and renewable energy storage [9, 29, 30]; however, it is only
recently that Li-ion batteries have reached a degree of development that enabled their
use in stringent automotive applications e.g. Tesla roadster began production in 2008
[31] and Nissan LEAF in 2010 [32]. Li-ion battery chemistries have always been of
great interest due to their intrinsic properties such as (a) higher operating voltage, (b)
higher energy density (c) longer cycle life and (d) lower self-discharge rate,
compared to other commercially available battery chemistries [9, 10]. The
introduction of Li-ion batteries in the automotive market has been the result of
significant improvements in gravimetric & volumetric energy density [10, 33], cycle
life [34, 35], cost [30, 36], manufacturing capability and manufacturing quality since
their commercialisation in early 1990’s [9, 10].
2.1 Essential parts of automotive battery
An EV battery pack is formed by a number of modules, and modules are formed
from a number of cells as shown in Figure 6. The number of modules in a pack is not
limited; it can vary from a single digit number to double digit number. Depending on
the requirements, all the modules can be connected in series within the pack to have
higher pack voltage. High pack voltage (several hundred volts) is essential as EV has
high power demand. Relationship of power P, of battery pack with pack voltage V,
Figure 6: Basic structure of an EV battery pack
The same amount of power can be supplied with higher voltage and lower current.
Figure 7 shows an example of current and voltage combination for different output
power. Lower current enables use of thinner current carrying conductors which
reduces weight and cost of battery pack. Also, it reduces copper loss (I2R) within current carrying conductors. However, use of very high voltage require higher
degree of insulation and has its own set of problems. Commonly, pack voltage
within the region of 300-600V is preferable for EV applications [23]. Module
voltage can vary from less than 10V to higher than 100V depending on the design.
Figure 7: current and voltage relationship for different output power.
The number of cells in a module can vary depending on the voltage and capacity
requirement. Cells in a module are connected in series or parallel or combination of
series parallel combination. Series connection is used to achieve higher voltage and
parallel connection to achieve higher current capability.
In an automotive battery pack, in addition to modules and cells, there are several
components like bus-bars, battery management system (BMS), sensors, switches,
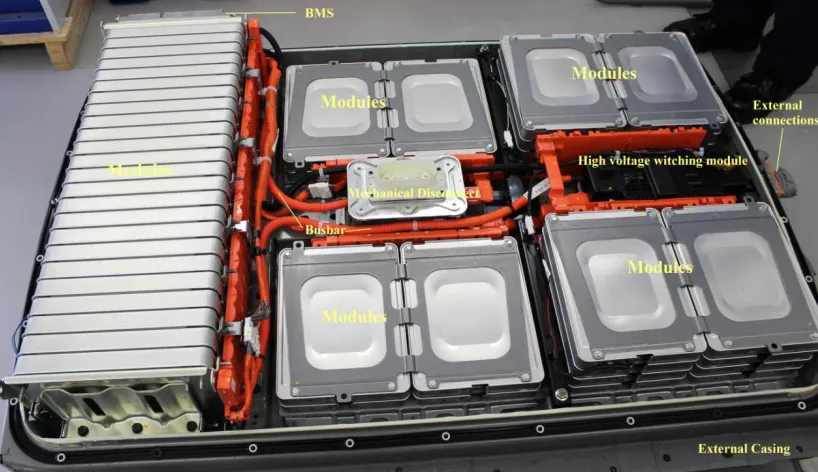
[image:40.595.115.524.321.557.2]cooling system, housing etc.; an example is shown in Figure 8.
Figure 8: Different components of an automotive battery pack. Photo courtesy:
WMG centre HVM Catapult
The BMS has four main objectives, maintain the battery in a working state, protect
the battery from damage, prolong lifetime of the battery, and communicate with the
vehicle/host application. To achieve its objectives the BMS monitors several
others. It also controls several parameters like charge-discharge process of the
battery to give protection against over/under voltage, over current, over/under
temperature etc.
The external power connector makes physical connection between battery pack and
traction system of the vehicle. It also has another interface to communicate between
vehicle and BMS. Bus-bars connect all the modules together and make connection
between modules and external power connectors. During operation of batteries heat
is produced due to I2R loses arising from the internal resistance of the battery. A cooling system is used to maintain battery temperature close to target operating
temperature. All the battery pack components are housed within a casing which also
provides mechanical stability of the pack and protects the component from damage
by external environment.
The price breakdown of a 25kWh EV pack is shown in Figure 9. A large portion of
battery pack cost is attributed to cells cost; which is around 60% of total cost of the
battery pack [37]. This makes cells most important component of a battery pack, as
well as being least understood! Cells will be further reviewed in next Section.
2.2 Li-ion battery cell construction and material
2.2.1 Components of Li-ion battery cell
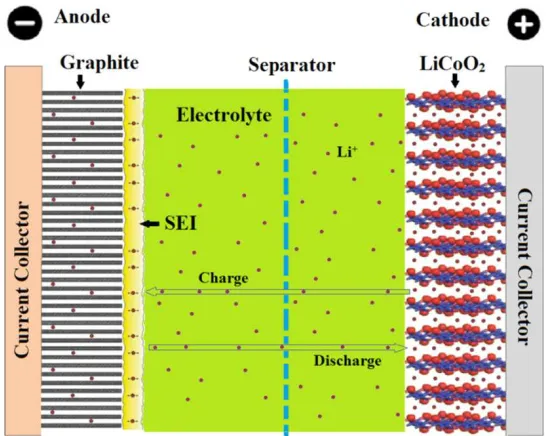
Like any other battery cells, Li-ion batteries also have four main components, anode,
cathode, electrolyte and separator. The basic construction of a Li-ion cell is shown in
Figure 10. The negative electrode is referred to as anode and the positive electrode as
the cathode (while being discharged). Electrical charges are carried by lithium ions
inside the cell from one electrode to another. From electrode, electrical charges are
collected by current collector, which then taken to the external circuit. Electrolyte
provides the medium for lithium ion transfer and separator mainly provides a
[image:42.595.116.390.400.618.2]physical barrier between electrodes, while allowing lithium ions to pass through.
Figure 10: Basic construction and operation of a Li-ion battery cell.
2.2.2 Cathode
The fundamental requirements of electrodes are they should react with lithium in a
achieve higher energy and power capability they should have high electronic and
ionic conductivities. Furthermore, the cathode should contain a readily reducible ion,
like a transition metal. Moreover, it is expected that the cathode material should have
a high free energy of reaction with lithium (energy released in an electrochemical
reaction) to maximize energy density of the cell. Another important requirement is
the electrode potential (electrode potential appears at the interface between an
electrode and electrolyte due to the transfer of charged species across the interface)
should be below the maximum stable potential of electrolyte.
Cell chemistries are generally named based on the cathode material. The cathode
chemistries of commercially available cell chemistries in last decade and present
days are listed in Table 1 with performance of the cells.
Table 1: Comparison between different Li-ion cell cathode chemistry and
performance of respective cell with carbon anode.
Cathode Chemistry Energy Density Wh/Kg Maximum power C-rate Cell Voltage Volt Discharge temperature oC
Cycle life at
25oC
(approximate)
Thermal
Runaway
oC
Lithium Cobalt Oxide
(LCO) 170-185 1-3 3.6 -20 to 60 1000 170
Lithium Manganese
Oxide (LMO) 90-110 3-5 3.8 -20 to 50 >1000 255
Lithium Nickel Cobalt
Manganese (NMC) 150-180 5-30 3.7 -30 to 60 1500 215
Lithium Iron Phosphate
(LFP) 80-125 10-30 3.2 -30 to 60 2000 270
The first commercialized Li-ion batteries used Lithium Cobalt Oxide - LiCoO2
(LCO) as the cathode material [38]. This type of battery has been widely used in
available in the market because of their high volume production [30]. LiCoO2is very
thermodynamically stable which makes fabrication process easier and have high
energy density (Table 1). Although, it has lower maximum current capability but it
has moderate cycle life (~1000 cycle) and high cell voltage. However, cobalt is toxic
when exposed to environment and can catch fire under aggressive conditions like
overcharge, piercing, puncture [30].
Spinel Lithium Manganese Oxide - LiMn2O4 (LMO) has different atomic structure
compared to LCO [39]. Use of manganese makes cathode materials very low cost
and use of this chemistry overcomes some of the problems of LCO cells. They offer
higher thermal runway temperature and manganese is less toxic compared to cobalt.
They also have higher cell voltage than LCO cell and slightly higher cycle life. But
all these advantages come at a cost of lower energy density.
Lithium Nickel Manganese Cobalt - LiNixMnzCoyO2 (NMC) cells blend the
advantages from LCO and LMO cells. They have almost similar energy density as
LCO cells, much higher power capability and cycle life compared to LCO and LMO
cells, and improved safety characteristics compared to LCO cells. Also, they are
cheaper than LMO cells.
Since 2000s Lithium Iron Phosphate - LiFePO4 (LFP) has been considered as a
promising cathode material for the cells for EV and other high power applications
due to their higher maximum current capability and better safety characteristics
compared to the LCO, LMO and NMC cells. They are less prone to catch fire under
higher cycle life compared to the three chemistries discussed above [35]. The
drawbacks of these cells are they have lower energy density and lower cell voltage.
2.2.3 Anode materials
In Li-ion batteries the simpler anode material is metallic lithium. However, risk of
internal short circuit due to lithium dendrite growth limits its use in commercial
cells. Numbers of anode materials have been proposed including variations of
carbon, silicon, tin, titanium and alloys of these materials. However, for commercial
cells graphite, hard and soft carbons are mainly used as anode material [38, 40-43].
Carbon based anodes comply with most of the electrochemical selection criteria and
are available in large quantities at a very low cost [43, 44]. Carbon is available in
various forms like graphite, soft carbon, and hard carbon; however, their lithium
insertion reaction is the same:
ݔܮ݅+ 6ܥ⇌ܮ݅௫ܥ (2)
In the Equation, the value of x depends on type of carbon and it is within 0 to 1 [20].
In the case of graphite, lithium can diffuse between the graphene planes quickly and
maximum number of lithium can diffuse (theoretically LiC6 [44]). Therefore,
graphite has the maximum specific capacity among carbon variants and has endured
as main anode material.
The use of Lithium Titanate Oxide – Li4Ti5O12(LTO) as an anode material provides
a unique advantage compared to carbon. Lithium intercalation into the LTO does not
make much change to the atomic dimensions of LTO [45]. Therefore, with cycling,
cycle capability of this material [46]. The main disadvantages of this material are it
has low capacity compared to carbon and LTO has high working voltage vs lithium
which significantly reduces cell voltage i.e. further reduction of energy density.
However, higher working voltage eliminates any passivation layer on anode surface
(explained later in Section 2.3) which enables higher power capability, superior
thermal and chemical stability, and also very high cycle capability.
2.2.4 Electrolyte
Electrolytes have little flexible requirements compared to electrodes. Electrolyte is
an ionic conductive material which has good insulating properties for electrons.
Ideally it is chemically inactive material; provide a medium for ion transfer between
two electrodes.
Although, ideally electrolyte is chemically inactive, however, the power density of
the cell depends on the electrolyte. The properties of electrolyte limit how fast ions
can move. There are two types of electrolytes namely non-aqueous organic liquids
and polymer electrolytes are commonly used in commercial Li-ion battery cells.
The organic liquids consist of lithium salt dissolved were the earliest electrolyte for
Li-ion cells which are still being used. Carbonates like propylene carbonate (PC),
ethylene carbonate (EC), diethyl carbonate (DEC), dimethyl carbonate (DMC),
ethylemethyl carbonate (EMC) or any mixture of two or more are previously
proposed and used [47]. These carbonates have high oxidization potential vs lithium
and low reduction potential vs lithium, which indicate that the electrolyte will be
other electrode reactions can take place. The main problem with carbonates is they
are highly flammable which pose significant safety hazard.
Polymer electrolytes are polymeric materials containing metal salt. This type of
electrolyte not only works as solvent for the salt but also maintain separation of the
electrodes. Polymer electrolytes are mainly two types, gel polymer electrolytes and
solid polymer electrolytes. Gel polymers contain a polymer which is gelled with
organic solvent. These types of electrolytes are currently being used for Li-ion cells.
Solid polymer electrolytes use ether based polymers like polyethylene oxide,
polypropylene oxide, containing dissolved lithium salt. Main issue of these types of
electrolytes are low ionic conductivity. However, they offer flexible cell design and
elimination of separator and most importantly improved safety by removing highly
flammable carbonates. Therefore, they have received a major research focus [47].
The cells used for this research mainly use EC and EMC as electrolyte.
2.2.5 Separator and current collector
The separator within the cell is a porous membrane which provides a physical barrier
to the anode and cathode, while allowing ion transfer between the electrodes. The
separator itself is inactive material but its properties and structure considerably
define power capability of the cell, energy density, cycle life and most importantly
safety. The most critical parameters for Li-ion battery separator are thickness, pore
size and porosity. Thinner the separator is lower the thickness of the battery and
lower the ion transfer resistance. However, thinner separators have less mechanical
stability and are prone to puncturing; hence, a balance is usually made.
polyethylene, polypropylene, microporous thin (<30 µm) separator [48]. They have
good mechanical and chemical stability, and are cheap to manufacture.
Current collector is used to collect electrical current generated within an electrode
material and deliver it to an external circuit; in other electrode this current from
external circuit is then distributed within electrode material. Current collectors need
to have high electrical conductivity and they should be chemically inactive in the
presence of electrode and electrolyte materials. The electrode materials are actually
coated on the current collector. Usually aluminium and copper foils are used as
current collector. Aluminium is less prone to corrosion vs lithium at higher operating
voltage of cathode and copper is less prone to corrosion at lower operating voltage of
anode [49]. Therefore, commercial cells mostly use aluminium foil as cathode
current collector and copper foil as anode current collector.
2.2.6 Production and types of commercial Li-ion cell
The fabrication process of Li-ion cell is highly automated and uses sophisticated
technology. The anode, cathode and separator of Li-ion cell is prepared like thin
sheet of tapes and rolled on reels like tape. Using automated winding machines these
tapes are cut into the proper size, made into a sandwich of anode-separator-cathode
and rolled to produce a tight ‘jellyroll’ construction. The jellyroll is then loaded into
a cell casing and electrolyte is added and finally sealed. Li-ion cells are packaged in
different casing, mainly categorized into three types, cylindrical, pouch and
Figure 11: Construction of cylindrical, prismatic and pouch Li-ion cell [37].
Cylindrical cells are packed in a cylindrical shaped metal can. Cylindrical cells are
one of the high volume production cells. The 18650 cell (18 mm diameter, 65 mm
long) standard cells are commonly used in laptops and other consumer electronics.
Box shaped aluminium or steel cans are sometimes used to house Li-ion cell. These
types of cells are called prismatic cell. Pouch cells are normally rectangular shaped
cells where instead of using metallic housing thin layer of plastic is used to seal the
cell from external environment. Because of the absence of metallic housing they
have higher energy density, higher power density and higher packaging efficiency
compared to other two formats. This type of cell can be made in any size and shape
and are not bound by standard sizes.
2.3 Operation of a Li-ion battery cell
A Li-ion battery cell operates following a simple process; it converts electrical
energy into chemical energy during the charge process and converts stored chemical
energy into electrical energy during discharge. Electrical equivalent circuit of a cell
respectively. Inside the cell energy conversion and storage is done by lithium ion,
shuttling between electrodes during charge and discharge. This process was
presented in Figure 10. During discharge, cathode is positive terminal and anode is
negative terminal, which is reversed during charge, and cathode works as negative
and anode as positive terminal.
Battery Cell Power Supply Switch Direction of Current Flow (a) Switch Direction of Current Flow Load Resistance (b)
Figure 12: Electrical circuit diagram of a cell during (a) charge and (b) discharge.
While charging, at the cathode, a lithium atom gives up an electron and becomes a
lithium ion. This lithium ion travels to the anode through electrolyte and electron
also travels to the anode through external circuit. At the anode the lithium ion
accepts an electron and becomes a lithium metal. This process is known as
intercalation. During discharge, the opposite reaction happens, lithium gives-up an
electron at anode and move to cathode, where it becomes lithium metal again by
accepting electron. This process is known as de-intercalation. For example, the
reactions for lithium cobalt oxide (LiCoO2) cathode and graphite anode are shown
below:
Cathode half reaction is:
ܮ݅ܥܱଶ↔ܮ݅ଵି௫ܥܱଶ+ݔܮ݅ା +ݔ݁ି (3)
Anode half reaction is:
ݔܮ݅ା+ݔ݁ି+ݔܥ
2.3.1 Origin of cell voltage and capacity
When a reaction occurs, there is a release or absorption of energy which is
commonly known as a decrease of free energy of the system and expressed as:
∆ܩ =−݊ܨܧ
(5)
Where, F is the Faraday constant (value:9.65 × 10ସܥ݉ ݈ିଵ), n is the number of moles of electrons transferred in the reaction and ܧ is the electrode potential for
reaction. The difference in the free energy in the two electrode reactions is the
energy supplied to/from the external circuit. In the absence of any current flow,
electrode potential vs ions in the solution i.e. Li+ can be measured experimentally
using a reference electrode and high impedance voltmeter, and also can be calculated
from Nernst equation (Equation (6) [50].
ܧ=ܧ+2.3݊ܨܴܶlogܥܥ ோ
(6)
Where, R is the universal gas constant (value, 8.31ܬܭିଵ݉ ݈ିଵ), T is the absolute temperature (K), and C is the chemical activity of ions, where Co is the oxidant and CRis the reductant.
Figure 13 shows the equilibrium potential of the electrode materials (used for Li-ion
cell) vs lithium ion and the operating region of carbonate electrolyte. Lithiated
graphite anode has an equilibrium potential of 0.05 V and LTO anode has
approximately 1.5 V vs lithium ion [30, 51]. Depending on the variant, delithiated
cathode has a voltage of around 4V except LFP which has a voltage around 3.3V
Figure 13: Stable working voltage of different cell material vs Li/Li+.
The cell voltage is simply the difference of the equilibrium potential of the
electrodes:
ܧ=ܧ−ܧ (7)
Where, ܧ and ܧ are the equilibrium potential of the cathode and anode
respectively. Therefore, when NMC cathode is used with graphite cathode the cell
voltage is approximately 4V at fully charged state. When graphite anode is replaced
with LTO the cell voltage will become around 2.5V at fully charged state.
Capacity of the cell depends on the total amount of lithium ion which can shuttle
between two electrodes. These lithium ions are commonly known as active lithium
or cycle-able lithium. The amount of cycle-able lithium at the anode defines the SoC
of the cell [20, 52]. When all the active lithium is at the anode it is called 100% SoC
i.e. fully charged. When there is no active lithium at anode it is called 0% SoC i.e.
electrodes changes. Because of this, cell voltage changes with SoC. As an analogy of
the operation of Li-ion cell and change of cell voltage, a simple water tank model
shown in Figure 14, can be used which was originally proposed byHan et al.[52].
Figure 14: Simple water tank model of Li-ion cell with example data of graphite
anode and LFP cathode. Yellow shaded area shows the percentage of lithiated
electrode. Figure adopted from [52].
Here two tanks are connected and lithium can be transferred from one tank to
another representing charge-discharge. The yellow shaded area shows the percentage
of the lithiated region of the electrode. When fully charged, all cycle-able lithium is
at anode. At this point considering a graphite anode and LFP cathode they will
approximately have equilibrium potential of 0.05 V and 3.6 V respectively and hence
the cell voltage will be 3.55 V. When the cell is discharged to mid SoC, about half of
the cycle-able lithium will move to cathode, causing decrease in cathode’s
equilibrium potential and increase in anode’s equilibrium potential, which will
reduce cell voltage. Finally, when cell is fully discharged, all the cycle-able lithium
illustration of the complex process. Therefore, actual capacity of the electrodes and
equilibrium potential may vary. The change of OCV of a Li-ion cell with LFP
cathode and graphite anode is shown in Figure 15. It is clear that rate of change of
cell voltage is not the same for the cell from fully discharged state to fully charged
state. This OCV is the cell voltage when cell is at electrochemical equilibrium,
which is different compared to cell under load (being charged or discharged), further
explained in Section 3.4.
Figure 15: Open circuit voltage of a Li-ion cell with LFP cathode and graphite
anode.
2.3.2 Origin of cell power capability and impedance
The rate of intercalation/de-intercalation process at an electrode defines the
maximum current (thus the maximum power) of the cell. To increase current
capability of the cell/electrode a simple way is to increase surface area to be in
contact with electrolyte i.e. active surface area. The rate of
intercalation/de-intercalation, thus the maximum current is linearly related to the surface area.
![Figure 5: Datasheet of a Li-ion battery cell [19].](https://thumb-us.123doks.com/thumbv2/123dok_us/9520109.457429/31.595.114.374.508.737/figure-datasheet-li-ion-battery-cell.webp)
![Figure 16: The model of double layer region as proposed by [56].](https://thumb-us.123doks.com/thumbv2/123dok_us/9520109.457429/56.595.128.403.74.342/figure-model-double-layer-region-proposed.webp)
![Figure 18: Main ageing mechanisms of li-ion battery. Figure adapted from [65].](https://thumb-us.123doks.com/thumbv2/123dok_us/9520109.457429/60.595.113.522.70.342/figure-main-ageing-mechanisms-ion-battery-figure-adapted.webp)