warwick.ac.uk/lib-publications
Original citation:
Bunt, Richard A., Wright, Steven A., Jarvis, Stephen A., Street, Matthew and Ho, Yoon K.
(2016) Predictive evaluation of partitioning algorithms through runtime modelling. In: High
Performance Computing, Data, and Analytics (HiPC'16), Hyderabad, India, 19-22 Dec 2016.
Published in: Proceedings of High Performance Computing, Data, and Analytics (HiPC'16) (In
Press)
Permanent WRAP URL:
http://wrap.warwick.ac.uk/82079
Copyright and reuse:
The Warwick Research Archive Portal (WRAP) makes this work by researchers of the
University of Warwick available open access under the following conditions. Copyright ©
and all moral rights to the version of the paper presented here belong to the individual
author(s) and/or other copyright owners. To the extent reasonable and practicable the
material made available in WRAP has been checked for eligibility before being made
available.
Copies of full items can be used for personal research or study, educational, or not-for profit
purposes without prior permission or charge. Provided that the authors, title and full
bibliographic details are credited, a hyperlink and/or URL is given for the original metadata
page and the content is not changed in any way.
Publisher’s statement:
“© 2016 IEEE. Personal use of this material is permitted. Permission from IEEE must be
obtained for all other uses, in any current or future media, including reprinting
/republishing this material for advertising or promotional purposes, creating new collective
works, for resale or redistribution to servers or lists, or reuse of any copyrighted component
of this work in other works.”
A note on versions:
The version presented here may differ from the published version or, version of record, if
you wish to cite this item you are advised to consult the publisher’s version. Please see the
‘permanent WRAP URL’ above for details on accessing the published version and note that
access may require a subscription.
Predictive Evaluation of Partitioning Algorithms Through Runtime Modelling
R. A. Bunt, S. A. Wright and S. A. Jarvis
Department of Computer Science, University of Warwick, Coventry, United Kingdom Email: [email protected]
Y. K. Ho and M. J. Street
Design Systems Engineering, Rolls-Royce plc, Derby, United Kingdom
Abstract—Performance modelling unstructured mesh codes is a challenging process, due to the difficulty of capturing their memory access patterns, and their communication patterns at varying scale. In this paper we first develop extensions to an existing runtime performance model, aimed at overcoming the former, which we validate on up to 1,024 cores of a Haswell-based cluster, using both a geometric partitioning algorithm and ParMETIS to partition the input deck, with a maximum absolute runtime error of 12.63% and 11.55% respectively. To overcome the latter, we develop an application representative of the mesh partitioning process internal to an unstructured mesh code. This application is able to generate partitioning data that is usable with the performance model to produce predicted application runtimes within 7.31% of those produced using empirically collected data. We then demonstrate the use of the performance model by undertaking a predictive comparison among several partitioning algorithms on up to 30,000 cores. Additionally, we correctly predict the ineffectiveness of the geometric partitioning algorithm at 512 and 1024 cores.
Keywords-scientific computing; performance analysis; high performance computing; modelling; fluid dynamics
I. INTRODUCTION
Supporting high-performance computing (HPC) resources and applications is an expensive and complicated process. The rise of petascale computing, and the push towards exascale computing, has seen an increase not only in the amount of intra-node parallelism, but also in the complexity of interactions between hardware components. As a result it is becoming increasingly difficult to relate the levels of performance achieved by benchmark suites on small scale evaluation hardware to that of production codes running on a complete machine. Many HPC centres are therefore turning to alternative tools and methodologies (e.g. predictive perfor-mance modelling [1], [2], hardware simulation [3], [4] and mini-applications [5], [6]) to facilitate system evaluation, to aid in the comparison of multiple candidate machines, to investigate optimisation strategies, and to act as a vehicle for porting codes to novel architectures.
One use of high performance machines is to perform computational fluid dynamics (CFD) simulations. These save time, money and permit the fast exploration of design spaces [7] without the cost of producing scale models and purchasing wind tunnel time [8]. This class of code is therefore vital to the aerospace industry. One such example
of this is HYDRA, a suite of applications in use by Rolls-Royce to optimise engine designs (e.g. by reducing the effects of high cycle fatigue [9]). The aim of our research is to produce a suite of general tools that will support Rolls-Royce with moving their applications onto new HPC systems.
This paper builds upon previous work [10] – the devel-opment of a performance model capable of predicting the runtime of HYDRA. We focus on detailing extensions to this model and the supporting suite of tools. While the existing performance model was successful at identifying detrimental communication behaviour, limitations prevented the model from delivering runtime predictions across the desired range of input parameters and scale: 1) the performance model was lacking complete analytical support, which restricted the set of tasks runtime predictions could be performed for (e.g. different multigrid cycle types); 2) the dataset coverage was limited due to the performance model only being primed from a subset of HYDRA’s loops; and, 3) the model was reliant on partitioning data, which could only be collected empirically from HYDRA when running at scale. Specifically, this paper makes the following contributions:
• We construct a general analytical runtime model for
multigrid applications. This model supports multiple cycle types (e.g. V- and W-Cycles) and a variable number of Runge-Kutta iterations;
• We identify and incorporate additional details in to the
performance model which are essential for modelling the runtime of large unstructured mesh codes: buffer pack/unpack costs, runtime costs from all 300+ loops in the code base, and performance information for different memory access patterns;
• We validate these additional details on up to 1,024
cores of a Haswell-based cluster, using both a geometric partitioning algorithm and ParMETIS to partition the NASA Rotor37 input deck, with a maximum absolute error of 12.63% and 11.55% respectively. Additionally we report the performance model’s accuracy on 1,008 cores of an Ivybridge-based cluster (ARCHER);
• We develop Moses, an application which is
This application is able to process the output from mul-tiple partitioning algorithms/libraries (e.g. ParMETIS, METIS and Scotch) at varying scale (up to 100,000 partitions) into data usable by our runtime performance model. Runtime predictions made using this data have an error in runtime of at most 7.31% over 512 pro-cesses, when compared against predictions made with empirically collected partitioning data;
• Finally, we demonstrate the use of Moses in
conjunc-tion with the runtime performance model to predictively compare the relative effect on HYDRA’s runtime of using Scotch, ParMETIS, METIS and a geometric partitioning algorithm on up to 30,000 cores. We predict and validate that the geometric partitioning algorithm causes reduced performance in HYDRA at 512 and 1024 processes when compared with ParMETIS. This paper is structured as follows: in Section II we briefly discuss related work; in Section III we summarise the func-tionality of HYDRA, OPlus (the proprietary library respon-sible for abstracting communications) and the partitioning libraries we use; in Section IV we show how the analytical model presented previously is generalised; in Section V we present the improvements to the performance model’s dataset and cost coverage, and validate these changes; in Section VI we describe our approach to collecting domain size information at scale and we provide a demonstration of how the data from Moses is used to compare partitioning algorithms on up to 30,000 cores; finally, in Section VII we summarise the work and discuss potential future work.
II. RELATEDWORK
The use of analytical and simulation-based performance models has previously been demonstrated in a wide range of scientific and engineering application domains. The con-struction of such models can augment many aspects of performance engineering [2], including: comparing the ex-pected performance of multiple candidate machines during procurement [11]; improving the scheduling of jobs on a shared machine, via walltime estimates [12]; identifying bottlenecks and potential optimisations, and evaluating their effect upon performance ahead-of-implementation [13]; and post-installation machine validation [14].
One body of modelling work similar to our own is described by Gahvari et al. [15]–[17], where an analytical performance model is developed for algebraic multigrid ap-plications executing on a range of architectures (including a Blue Gene/P and a Blue Gene/Q). The focus of these papers is on understanding the scalability of these applications and the utility of hybrid OpenMP/MPI programming – in this work we present a model of a geometric multigrid application.
Another body of research which is similar to this work, develops performance models of MPI-based wavefront [1] and Adaptive Mesh Refinement (AMR) codes [18]. Despite
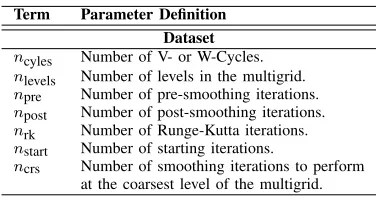
Term Parameter Definition Dataset
ncyles Number of V- or W-Cycles.
nlevels Number of levels in the multigrid.
npre Number of pre-smoothing iterations.
npost Number of post-smoothing iterations.
nrk Number of Runge-Kutta iterations.
nstart Number of starting iterations.
[image:3.612.342.530.69.169.2]ncrs Number of smoothing iterations to perform at the coarsest level of the multigrid.
Table I: Description of dataset terms.
the similarities between these models and our own, sig-nificant work would be required to prepare them for use with geometric multigrid applications. Furthermore, we use performance models to assess the suitability of different par-titioning algorithms/libraries at varying scale, rather than to examine different hardware and software configurations [1] or to optimising AMR patch distribution [18].
Giles et al. have published several papers on the design and performance of OPlus and its successor OP2 [19]– [21]. One of these papers details the construction of an analytical performance model of a simple airfoil benchmark
(≈2 K lines of code), executing on commodity clusters
containing CPU and GPU hardware [21]. The performance model achieves high levels of accuracy, but does not support multigrid execution. In this paper, we construct a perfor-mance model for a significantly more complex production
application (≈45 K lines of code), and present model
val-idations for datasets with multiple grid levels and augment the modelling process with data from a mini-application.
We additionally develop an application to be represen-tative of the partitioning behaviours internal to HYDRA using the experiences of mini-application developers. Our approach differs from typical mini-applications which tend to represent application behaviours when interacting with hardware (e.g. computation, communication and synchroni-sation) [22]–[24], rather than purely software behaviours. We borrow the idea of creating a small but representative appli-cation, but seek only to recreate the result of computation to facilitate the collection of data for use with the runtime performance model.
III. BACKGROUND
A. Multigrid
1 2 3 4 1 2 3 4 5 6 7 8 9 10 11 12 13 14 15 16 17 18 19 10 1 2 1 2 1 2 2 2 2 1 2 1 2 1 2 2 2 Multigrid Level Solv er It erati on Ev en t npre npost ncrs nstart additional (a) V-Cycle
[image:4.612.73.259.70.308.2]1 2 3 4 1 2 3 4 5 6 7 8 9 10 11 12 13 14 15 16 17 18 19 20 21 22 23 24 25 26 27 28 29 30 31 32 33 34 35 36 37 38 39 40 41 42 10 1 2 1 2 1 2 2 1 2 2 2 1 2 1 2 2 1 2 2 2 2 1 2 1 2 1 2 2 1 2 2 2 1 2 1 2 2 1 2 2 2 Multigrid Level Solv er It erati on Ev en t (b) W-Cycle
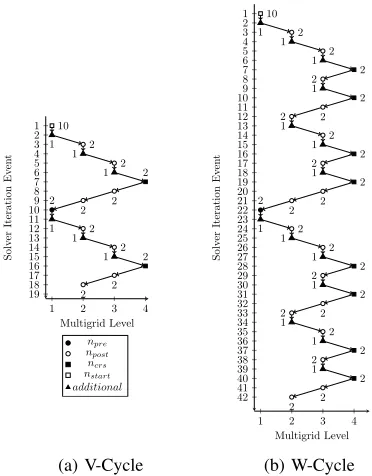
Figure 1: Trace of solver iteration events (ncycles= 3).
Starting at the finest level, multigrid applications use
an iterative smoothing subroutine to reduce high frequency
errors. Low frequency errors are then transferred to the
next coarsest level (restriction), where they appear as high
frequency errors and can thus be more rapidly smoothed by the same subroutine. Error corrections from the smoothing
of coarse levels are then transferred back to finer levels (
pro-longation). Before each invocation of a restrict or prolong a varying number of smooth operations are performed; the
exact number is defined by nstart, npre, npost, ncrs and
additional which are described in Table I. The order in which prolongations and restrictions are applied is known as a cycle, of which this paper considers two types: V- and W-Cycles as these are both available in HYDRA. Figure 1(a) and Figure 1(b) visualise two V-Cycles and two W-Cycles respectively, for a grid with four levels.
B. HYDRA
Rolls-Royce use CFD codes to simulate the flow of fluids in and around some of their commercial products. One of the main codes employed in such simulations is HYDRA [26], a suite of nonlinear, linear and adjoint solvers developed by Rolls-Royce in collaboration with many UK universities. We refer the reader to previous works for more informa-tion [27]–[31].
We focus on HYDRA’s nonlinear solver, which we refer to henceforth as “HYDRA” for brevity. Specifically we examine HYDRA’s smooth loop; a skeleton of this loop is provided in Listing 1 along with a description of each function call. This loop contains the six most expensive
functions in terms of runtime: vflux, iflux, srcsa,
Listing 1: Pseudo-code for HYDRA’s smooth loop.
1 f o r i t e r = 1 t o n i t e r do 2 i f i t e r == 1 t h e n
3 c a l l j a c o b // Jacobian preconditioning
4 end i f
5
6 f o r s t e p = 1 t o 5 do
7 i f d i s s i p a t i v e f l u x u p d a t e t h e n 8 c a l l g r a d // compute gradient 9 c a l l v f l u x // accumulate viscous fluxes 10 c a l l w f f l u x // modify viscous wall fluxes 11 c a l l w v f l u x
12 end i f
13
14 c a l l i f l u x // accumulate inviscid fluxes 15 c a l l s r c s a // Spalart-Allmaras source term 16 c a l l u p d a t e // update flow solution 17 end f o r
18 end f o r
Listing 2: A typical OPlus parallel loop.
1 do w h i l e ( p a r a l l e l l o o p ( e d g e s , i s t a r t , 2 i f i n i s h ) )
3 c a l l a c c e s s ( ‘ r e a d ’ , ewt , 3 , 4 e d g e s , 0 , 0 , . . . ) 5 c a l l a c c e s s ( ‘ r e a d ’ , x , 3 ,
6 n o d e s , ne , 2 , . . . ) 7 . . .
8
9 c a l l a c c e s s ( ‘ u p d a t e ’ , v r e s , 6 , 10 n o d e s , ne , 2 , . . . ) 11 do i e = i s t a r t , i f i n i s h
12 i 1 = ne ( 1 , i e ) 13 i 2 = ne ( 2 , i e )
14 c a l l c o m p u t e ( e wt ( 1 , i e ) ,
15 x ( 1 , i 1 ) , x ( 1 , i 2 ) , 16 v r e s ( 1 , i 1 ) , v r e s ( 1 , i 2 ) )
17 enddo
18 enddo
update, grad and jacob, along with wfflux and
wvflux; all of which are invoked approximately 1–5 times per iteration. The smooth loop does not include the main input/output (I/O) or setup routines.
C. OPlus
OPlus [19] was designed to allow a single source code to be recompiled for serial or parallel execution, acting as a middleware that completely hides other library calls and the low-level implementation of a code’s parallel behaviour from the programmer. Subroutines in the user source code (in this case, HYDRA) are defined as operations over user-defined
data sets (e.g. nodes, edges, faces) and the OPlus library
schedules the computation accordingly. When running seri-ally, OPlus uses a standard loop to execute the subroutine for each set element; when running in parallel, the set elements (and their computation) are partitioned over multiple nodes.
OPlus is also responsible for handling thehalo exchanges
it uses MPI. Due to these responsibilities, parts of OPlus (e.g. buffer pack/unpack routines) must be captured in the performance model. We note that as OPlus handles all inter-node communication, there are no calls to MPI or any other communication library within the HYDRA source code.
In order to schedule a loop for parallel execution, OPlus requires that the programmer declare how each data array
will be accessed, via calls to access as demonstrated
in Listing 2. Firstly, they must declare an access type for each array – read, write, or read/write (“update”). OPlus then attaches a “dirty bit” to each array, based upon these access modifiers; if an array is declared as being “write” or “update”, then execution of the loop will invalidate any copy of the data held on neighbouring processes. Secondly, the programmer must specify whether the array is to be accessed directly (i.e. the array index is the loop counter) or indirectly (i.e. the array index is the result of a look-up, based on the loop counter); such information allows OPlus to reason about whether a given loop requires data only from local set elements, or is likely to access data residing on another processor.
When combined with the set partitioning, these access descriptors permit OPlus to determine which iterations of the inner loop:
1) Can be executed prior to communication;
2) Require communication with neighbouring processors to ensure correctness; and
3) Should be executed redundantly on multiple proces-sors to avoid additional communication steps. The set elements corresponding to such iterations are
re-ferred to henceforth asindependent,dependent andexecute
set elements respectively.
The do while loop surrounding the computation en-ables OPlus to iterate over the three distinct regions of elements in a way that is transparent to the programmer. The parallel_loopcall returns true for a certain number of calls (thus continuing the while loop) and sets the values of istart and ifinish to different values each time (thereby controlling the set elements executed by a given iteration).
D. Experimental Setup
For the model validations in Sections V and VI we use the
Rotor37 dataset [32] (a mesh of≈8 million nodes and≈24.8
million edges representing an axial compressor rotor) as the input deck. We collect the modelling data from Tinis,
a Haswell-based cluster (400×E5-2630 v3) with a QDR
Infiniband interconnect.
OPlus has been developed such that any unstructured mesh partitioning algorithm can be integrated and used (e.g. ParMETIS [33] and PT-Scotch [34]). In this paper we use the geometric partitioning [35] algorithm built into OPlus and ParMETIS 3.1 for all model validations; ParMETIS 3.1
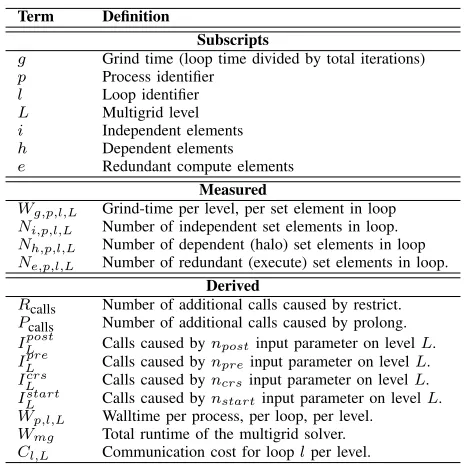
Term Definition
Subscripts
g Grind time (loop time divided by total iterations)
p Process identifier
l Loop identifier
L Multigrid level
i Independent elements
h Dependent elements
e Redundant compute elements
Measured
Wg,p,l,L Grind-time per level, per set element in loop
Ni,p,l,L Number of independent set elements in loop.
Nh,p,l,L Number of dependent (halo) set elements in loop
Ne,p,l,L Number of redundant (execute) set elements in loop.
Derived
Rcalls Number of additional calls caused by restrict.
Pcalls Number of additional calls caused by prolong.
ILpost Calls caused bynpostinput parameter on levelL.
ILpre Calls caused bynpreinput parameter on levelL.
Icrs
L Calls caused byncrsinput parameter on levelL.
Istart
L Calls caused bynstartinput parameter on levelL.
Wp,l,L Walltime per process, per loop, per level.
Wmg Total runtime of the multigrid solver.
[image:5.612.320.553.68.301.2]Cl,L Communication cost for looplper level.
Table II: Description of model terms.
for the simulated partitioning; and, METIS 5.1.0 and Scotch 6.0.4 for all serial partitioning.
IV. RUNTIMEMODEL FORMULTIGRIDAPPLICATIONS
We first present the construction of further analytical equations, which describe HYDRA’s function invocations. We then show how these new equations operate with the original model. Additionally, we show how the new analyti-cal equations can easily be adapted to allow for runtime pre-dictions when using other types of multgrid cycle, thereby increasing the applicability of the model. The modelling terms used throughout this section and others are defined in Table II.
A. Model of Solver Steps
HYDRA’s smooth routine invokes a number of solver iter-ations. These depend on HYDRA’s current position in the multigrid cycle (labelled in Figure 1) and directly affect the total number of solver steps. To parameterise the model, we work through HYDRA’s source code from both the solver and Runge-Kutta loop bounds to the input deck, and in doing
so we identify the following parameters ncrs, npre,npost,
ncycles (see Table I) as influencing the loop bounds.
To aid the development of equations for the number of solver iterations (per multigrid level) in terms of these parameters, we collect a trace of solver iteration events and the multigrid level they originate from. We plot this trace in Figure 1(a) and use it as a guide for further code inspection, by creating a mapping between events in the trace and HYDRA’s source code.
iteration events 1 and 2). Through experimentation with the input deck and code inspection, it was found that the first
10 of these events can be attributed to thenstart parameter.
The extra event is a separate feature, in which an additional iteration of the inner loop is performed only when restricting.
This leads directly to Equation 1, where nstart is simply
multiplied by the number of inner loop iterations (nrk), and
to this, a single addition iteration is added.
I1start=nstart×nrk+ 1 (1)
The second feature we discuss from Figure 1(a) is event 10. We single this feature out next as it does not appear at the beginning of the previous V-Cycle (solver iteration event 2). Code inspection reveals that these events are
dictated by npre. Given the information that these events
occur at the beginning of every V-Cycle, we can construct Equation 2. The second half of the equation deals with
the single additional iteration while restricting – both ×1
terms, while unneeded, are left in to ensure a 1-to-1 mapping between the two halves of Equation 2 for readability.
I1pre= ((ncycles−2)×npre×nrk)
+((ncycles−2)×1×1)
(2)
Next we examine the events which occur on levels 2 and 3 of the V-Cycle, for both prolongation and restriction. Code inspection reveals that the number of iterations are dictated
by npost and as is the case with Equations 1 and 2, the
additional iteration which occurs while prolonging must be accounted for.
I2post,3 = (((ncycles−1)×npost×2)×nrk)
+(((ncycles−1)×1)×1)
(3)
Finally, we examine those events which occur on the final level of the multigrid: events 7 and 16 in Figure 1(a). These occur once per V-Cycle, therefore the equation is:
I4crs= (ncycles−1)×ncrs×nrk (4)
It should be noted that Equations 1-4, given an input deck,
will predict the invocation count ofiflux. The call count of
the other functions (e.g.vflux) is dealt with by modelling
their percentage of invocations relative toiflux.
B. Model Integration
We integrate Equations 1-4 bottom up, into the existing model to provide a fully analytical description of HYDRA’s computation. We refer the reader to the existing performance modelling paper for the equations for communication time (Cl,L), restrict (Rcalls) and prolong (Pcalls) as these equations remain unchanged [10].
Equation 5 describes how the different types of compute (independent, halo and execute) and the communication are
combined into a single walltime. To model communication-computation overlap, the larger of the independent compute and communication time is taken, and added to this, the compute which cannot be overlapped at all. This equation can easily be adjusted to produce a prediction where overlap is not assumed to occur, by replacing the maximum function with a summation.
Wp,l,L= max(Ni,p,l,L×Wg,l,L, Cl,L)
+ (Nh,p,l,L+Ne,p,l,L)×Wg,p,l,L
(5)
Finally, the runtime of all the loops on each level of the multigrid are summed to give the predicted runtime for the solver (Equation 6).
Wmg =
X
l
X
L
max
p∈P(Wp,l,L)×IL (6)
C. Generalisation to W-Cycles
V-Cycles are not the only pattern by which multigrid solvers can transition between levels, and in this section we show how to apply the process used in Section IV-A for W-Cycles, lending weight to the processes applicability to arbitrary cycle types. As before we plot a trace of the code, but while performing W-Cycles (Figure 1(b)).
We first notice that the non-repeating features in Fig-ure 1(b) (solver iteration event 1), and the frequency of
steps caused by npreare the same as for the V-Cycle case,
therefore we can reuse Equations 1 and 2. We then identify where a single cycle terminates (solver iteration event 21 in Figure 1(b) and construct equations for the remaining levels of the multigrid.
We introduce Equations 7 and 8 which are similar to Equations 3 and 4 but parameterised to allow operation with multiple cycle types.
I2post,3 = (((ncycles−1)×O
post
2,3 ×npost)×nrk)
+(((ncycles−1)×Oadditional2,3 ×1)×1)
(7)
I4crs= (ncycles−1)×O4crs×ncrs×nrk (8)
WhereOcrs
4 ,O
post
2 ,O
post
3 ,Oadditional2 andO3additionalequal
4, 3, 6, 2 and 4 respectively for a W-Cycle and 1, 2, 2, 1 and 1 respectively for a V-Cycle. By making these improvements to the model it can support multiple cycle types (e.g. W-Cycle and V-W-Cycle) and a variable number of Runge-Kutta iterations. As a side effect of creating analytical equations representing the multigrid cycles rather than relying on a code skeleton, the model’s time to prediction has improved
by ≈22× when predicting for 504 cores, and will likely
16 64 128 192 256 320 384 448 512
1024
0 1 2 3 4
·103
Number of Processes
Runtime
(seconds)
Actual compute
Prediction with loops, separateWg
Prediction without loops,separateWg
Prediction with loops, with averageWg
[image:7.612.321.556.70.245.2]Prediction without loops, averageWg
Figure 2: Comparison of actual and predicted compute time (Rotor37, 8 million nodes; geometric partitioning).
16 64 128 192 256 320 384 448 512
1024
0 2 4
·103
Number of Processes
Runtime
(seconds)
Actual runtime
Predicted runtime
Predicted runtime without pack+unpack costs
Figure 3: Comparison of actual and predicted runtime (Ro-tor37, 8 million nodes; geometric partitioning).
V. ADDITIONALPERFORMANCEMODELDETAIL
We first identify and extend the performance model to include three additional runtime costs: the compute and communication time for all 300+ loops in the code base, the time taken to pack/unpack data from the MPI buffers in OPlus, and separate performance data for each region of compute. Second, we validate these changes to the performance model over 1,024 cores by presenting the effect each adjustment has on the model’s error. We further validate the performance model when using ParMETIS, rather than a geometric partitioning algorithm to partition the Rotor37 input deck. Finally, we report the performance model’s accuracy over 1,008 cores when using data collected from an Ivybridge-based cluster (ARCHER).
16 64 128 192 256 320 384 448 512
1024
0 2 4
·103
Number of Processes
Runtime
(seconds)
Actual Runtime
Predicted Rutime Actual Max Compute Predicted Max Compute
Actual Pack+Unpack Time Predicted Pack+Unpack Time
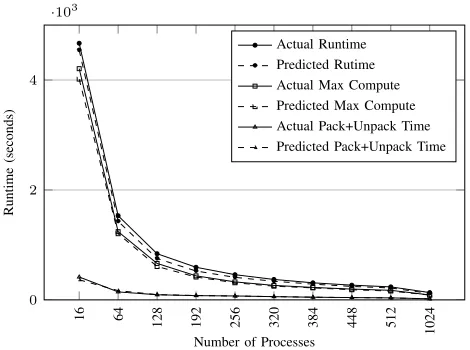
Figure 4: Comparison of HYDRA’s actual and predicted runtime (Rotor37, 8 million nodes; ParMETIS).
A. Region Grind-time Data
OPlus partitions HYDRA’s compute into three different regions, independent, halo and execute. For each of these element types the access pattern varies, which is reflected in the timing information. The compute time (per element) for dependent elements compared to independent elements
is 60.72% and 142.45% larger forvflux and iflux
re-spectively. Without using separate timing information for the different regions a consistent under-prediction in compute time is observed (average of 19.12%). However, when the performance model is primed with separate timing infor-mation for each region then the model error is reduced (see Figure 2) to a consistent average under-prediction of 12.69%. The analytical model is generalised to support these
re-gional grind times by introducing three new terms:Wg,i,l,L,
Wg,h,l,LandWg,e,l,Lfor the independent, halo and execute
regions respectively. After making this adjustment Equa-tion 5 becomes EquaEqua-tion 9.
Wp,l,L= max(Ni,p,l,L×Wg,i,l,L, Cl,L)
+ (Nh,p,l,L×Wg,h,l,L+Ne,p,l,L
×Wg,e,l,L)
(9)
B. Complete Loop Coverage
[image:7.612.61.296.71.243.2] [image:7.612.61.296.297.468.2]With the addition of performance data from all loops in HYDRA the runtime performance model’s under-prediction reduces from an average of 12.69% to 4.79% (see Figure 2). Both the complete loop coverage and the use of detailed compute data, reduces the compute error by approximately 10% at all measured scales in Figure 2. Even with complete loop coverage there is still an error in compute time; we suspect this is due to the modelling assumption that compute time per edges/node is the same across all processes which is not often the case.
Additionally we incorporate buffer pack/unpack cost into the performance model, after which the model’s total under-prediction is reduced from an average of 24.76% to 8.56% and at most 12.63% (see Figure 3).
We additionally validated the runtime performance model with the aforementioned details on up to 1,008 cores of ARCHER, an Ivybridge-based (E5-2697 v2) Cray XC30, with a Cray Aires interconnect. This demonstrates the model’s applicability across multiple generations of hard-ware. We observed a maximum error of 4.72% but for brevity we do not present a detailed validation here.
C. Performance Model Validation (ParMETIS)
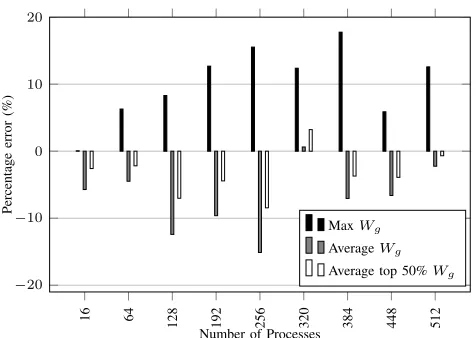
In Figure 4 we plot the total runtime, max compute time and pack/unpack time for both predicted and actual executions when using ParMETIS as the partitioning algorithm. The errors for total runtime, max compute time and pack/unpack costs are on average 8.65%, 4.09% and 5.23% respectively. The compute error consistently under-predicts and the error is neither increasing or decreasing with scale, but fluc-tuates between under-predictions of 8.37% and 1.43%. This under-prediction and fluctuation can be partially explained by a deviation from one of our modelling assumptions: the
Wgvalues are similar across all processes for a given OPlus
loop, multigrid level and compute region. This is not true as different processes have different access patterns, due to the nature of unstructured mesh codes.
This broken assumption manifests itself as a problem in the performance model when an average, maximum or
minimum Wg is used to approximate the compute cost,
as the model will always predict that the most expensive processes is the one with the most elements to process. From Figure 5 we can see that this assumption leads to an under-prediction (except for at 320 processes) when using
the average Wg and an over-prediction when using the
maximumWg. For the predictions in this paper we use an
average over the top 50% largestWg values as this is more
representative of the compute costs on the critical path. The pack and unpack error fluctuates between under-predicting and over-under-predicting. However, for the most part the absolute error is very low (less than 3 seconds for runs larger than 128 processes). Further investigation is required to identify the remaining sources of error, specifically at
16 64
128 192 256 320 384 448 512
−20
−10 0 10 20
Number of Processes
Percentage
error
(%)
MaxWg
AverageWg
[image:8.612.320.558.69.238.2]Average top 50%Wg
Figure 5: Percentage error ofWgcalculation techniques for
max edge compute.
lower core counts, where the runtime prediction is over-predicting 50.32 seconds and under-over-predicting 23.32 seconds for runs with 16 and 64 processes respectively.
The compute under-prediction leads to an
under-prediction of the total runtime as this is the dominant cost. We observe errors between 2.68% and 11.55%. This vali-dation demonstrates the performance model’s effectiveness at predicting runtime when using alternative partitioning algorithms.
VI. SET ANDHALOSIZEGENERATION
Typically in order for an analytical model to provide a runtime prediction, the size of the dataset (i.e. number of nodes, edges, cells) and message sizes must be known for a given process count. In the case of a structured mesh these sizes can be obtained using basic algebra, but for unstructured meshes these sizes depend on the partitioning algorithm (e.g. ParMETIS) and halo exchange strategies.
Previously this data was collected empirically from HYDRA, but this approach becomes impractical for large process counts as vast amounts of hardware are required. This limits the performance model’s capacity to predict HYDRA’s scaling behaviour. We develop and validate two applications to solve this limitation: one for driving the partitioning algorithm, and one for computing the set and halo sizes (the latter will henceforth be referred to as “Moses”). With these applications we can more readily explore different approaches (e.g. simulation, alternative partitioning algorithms, serialisation of code) to collecting partitioning information for use in runtime predictions.
16 64 128 192 256 320 384 448 512 0
2 4
·103
Number of Processes
Runtime
(seconds)
Actual
Prediction using Empirical Data
Prediction using Data from Moses
[image:9.612.61.295.70.243.2]Prediction using a Structured Mesh Approximation
Figure 6: Impact of partitioning data source on model.
A. Partitioning Mini-Driver and Mini-Application
We develop a mini-driver (a framework for running specific application routines with test data), which exists to perform four tasks: 1) read in the mesh files used by HYDRA for each level of the multigrid; 2) manipulate the mesh files into a form usable by the chosen partitioning algorithm; 3) invoke the partitioning algorithm; and, 4) store the resultant parti-tioning in a standard form, so Moses, which is responsible for computing the halo and set sizes, can operate with any chosen partitioning algorithm. This standard form is a set of tuples, which map nodes to the identifier of the partition they belong to.
To ensure the mini-driver’s correctness we compare the arguments to our chosen partitioning library (in this case ParMETIS) when called from HYDRA against the argu-ments used in the mini-driver and ensure they are identical. Collecting usable partition data is only the start of the halo and set generation process; OPlus uses this data to partition the remaining sets and form the halos.
We develop Moses which mimics the process by which OPlus uses the partitioning data to generate all other size data: the size of all sets in use by the CFD simulation (e.g. edges, nodes, faces); the number of elements which can be updated before and after communication; and, the size of the halos to communicate. To develop a fully rep-resentative version would be prohibitively time consuming, so we choose build a simplified version adding only the major detail; we select this detail based upon the largest contributors to runtime.
Using Moses and the mini-driver we are able to generate partitioning information for up to 100,000 cores, which is usable by the runtime performance model.
B. Validation
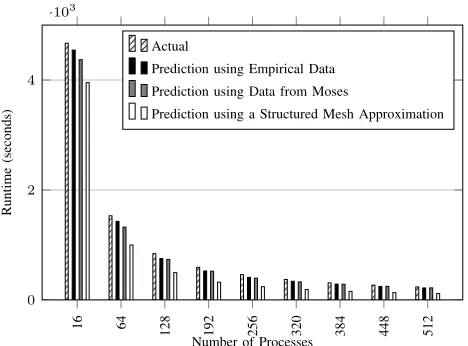
We first quantify the level of detail included in Moses by performing a comparison between actual runtime, runtime
predictions made using partitioning data generated by Moses and predictions made using partitioning data collected em-pirically from HYDRA (Figure 6). Additionally, we plot a runtime prediction using a variant of the partitioning model used by Mathis et al. [36], where the set and halo sizes are approximated to the structured mesh case. We use this plot as a baseline for runtime accuracy that can be achieved when using a simple partitioning model.
From Figure 6 we can immediately see the large er-ror (46.94%) in runtime that using the structured mesh approximation induces compared to using the empirically collected partitioning data. Whereas the runtime prediction made using the partitioning data generated by Moses differs by at most 7.31%. If we also examine the predicted parallel efficiencies when using both the structured mesh approxi-mation and the data generated from Moses we find that the former indicates a near perfect efficiency across all ranks, but the latter is in line with the empirically predicted effi-ciency: an average parallel efficiency of 0.70 when using the empirically collected partition data and a parallel efficiency 0.69 when using the partitioning data generated by Moses. These results would indicate that using the data generated by Moses affords more runtime performance model accuracy than using the structured mesh data.
From the breakdown of predicted runtime costs (compute, communication, synchronisation, pack and unpack time) we identify the two reasons why the structured mesh approxima-tion fails to give an accurate predicapproxima-tion: 1) it underpredicts the amount of data to be sent between ranks, resulting in a lower predicted communication time and lower pack and unpack times; and 2) the lack of load imbalance reduces the cost of synchronisation on each process.
While the data generated using Moses is more represen-tative than that from the structured mesh approximation, there are still sources of error. To identify these we compare the set and halo sizes generated by HYDRA directly with those generated by Moses. We find that while the set sizes generated for the first level of the multigrid are of low error
(0% for edges and≈6% for nodes) this error increases up
the multigrid to ≈24% and ≈35% for nodes and edges
respectively. However, the upper levels of the multigrid account for a diminishing amount of the total runtime and therefore these errors have a minimal effect on predicted runtime error. We reserve combating this remaining error for future work.
C. Predictive Analysis of Partitioning Algorithms
Scotch(16) METIS(16)
Geometric(16) ParMETIS(16) Scotch(64) METIS(64)
Geometric(64) ParMETIS(64) Scotch(128) METIS(128)
Geometric(128) ParMETIS(128) Scotch(256) METIS(256)
Geometric(256) ParMETIS(256) Scotch(512) METIS(512)
Geometric(512) ParMETIS(512) Scotch(1024) METIS(1024)
Geometric(1024) ParMETIS(1024) Scotch(2000) METIS(2000)
P
arMETIS(2000)
Scotch(4000) METIS(4000) Scotch(6000) METIS(6000) Scotch(8000) METIS(8000) Scotch(10000)
METIS(10000) Scotch(20000) METIS(20000) Scotch(30000) 101
102 103 104
Partitioning algorithm (Number of processes)
Runtime
(seconds)
Max compute
Max pack
Comms+sync
−40
−30
−20
−10 0
Speedup
(%)
Max Compute
Max Pack Comms+Sync Actual
[image:10.612.64.549.72.350.2]Predicted
Figure 7: Predicted effect of partitioning algorithm on HYDRA’s runtime and the speedup from using ParMETIS over a geometric partitioning.
communication/pack and unpack costs. We prime the per-formance model with compute data from a single scale (16 processes), as we are not considering memory behaviours.
Figure 7 contains a comparison of partitioning algorithms, however due to several current limitations we are not able to collect the complete range (16-30,000) of data for all partitioning algorithms used in this work. We are only able to collect data for up to 1,024 partitions for the geometric partitioning algorithm as we currently lack an implementa-tion outside of HYDRA with which to prime the mini-driver. Additionally we are only able to collect partitioning data from ParMETIS for up to 2,000 partitions as simulations take in the order of weeks to complete. Finally, METIS is unable to partition the dataset into 30,000 parts.
From Figure 7, we can see that the geometric parti-tioning algorithm is able to produce a partiparti-tioning with a comparable or lower predicted maximum compute when compared to the other partitioning algorithms, however it makes no consideration as to the communication time. This omission manifests itself primarily as increased time spent
packing and unpacking elements for communication – 1.35×
and 1.92× larger at 16 and 1,024 processes respectively
when compared to ParMETIS (the next worst performing partitioning algorithm in terms of these costs). However, both the Scotch and METIS partitioning libraries manage the trade-off between costs as they take into account the number
of edges cut, which is a proxy for communication time.
This leads to predicted runtimes which are at most 1.2×
better (predicted speedup of using METIS over a geometric partitioning at 1,024 cores).
Also from Figure 7, we can see that METIS consistently performs better than its parallel variant (ParMETIS) across all scales for both max compute time, and pack and unpack cost, this leads to a predicted performance improvement of
up to 1.1×(at 512 cores). This performance improvement
does not appear to diminish with scale.
This predictive analysis has delivered three observations, 1) Scotch and METIS are the better choice of partitioning algorithm when compared to ParMETIS and the geometric partitioning algorithm; 2) the serial variant of ParMETIS produces consistently better partitions than ParMETIS itself; and, 3) the geometric partitioning invokes reduced perfor-mance in HYDRA runs of greater than 512 processes due to increasing buffer pack and unpack costs. These predictive observations will direct the authors to invest the time to integrate the feature to read in pre-generated partitions into HYDRA. Especially those from Scotch and PT-Scotch, the former to see if the performance improvements at small scale hold and the latter to determine if PT-Scotch is out performed by its serial variant.
HYDRA when using the geometric partitioning algorithm over ParMETIS to partition the input deck. Figure 7 shows that the runtime performance model in conjunction with Moses accurately predicts the downfall of the geometric partitioning algorithm at 512 and 1024 processes. Indicating that this partitioning algorithm is not suitable for anything but small scale runs when using the Rotor37 dataset.
VII. CONCLUSIONS
In this paper we have developed a general analytical model for a multigrid code which supports multiple cycle types, a variable number of Runge-Kutta iterations and an arbitrary number of loops. These additions have increased the number of input decks the performance model is applicable to.
We have validated additional performance costs on up to 1,024 cores of a Haswell-based cluster, using both a geometric partitioning algorithm and ParMETIS to partition the input deck, with a maximum absolute error of 12.63% and 11.55% respectively.
We have developed Moses, which is able to convert partitioning data from multiple algorithms (Scotch, METIS, ParMETIS) at varying scale (up to 30,000 cores) into data usable by our runtime performance model. We show that runtime predictions made using this data have a runtime error of at most 7.31% over 512 processes, when compared against predictions made with empirically collected parti-tioning data.
Finally, we have demonstrated the use of Moses in con-junction with the runtime performance model by comparing the effect of several different partitioning algorithms on HYDRA’s runtime. We concluded from this analysis that priming HYDRA with partitioning data from Scotch is worth investigating due its consistent predicted performance
advan-tage (maximum of 1.21×) over ParMETIS. Additionally, we
predicted and validated the result that the geometric parti-tioning algorithm caused reduced performance in HYDRA at 512 and 1024 processes when compared with ParMETIS.
A. Further Work
We will seek to improve Moses and the performance model by 1) decreasing Moses’ error in runtime (7.31%) by im-proving the accuracy of the set and halo size predictions on the highest levels of the multigrid; 2) increasing the scale at which Moses is able to generate set and halo data (beyond 100,000 and towards 1,000,000 partitions); 3) extending Moses to support other unstructured mesh applications; and, 4) increasing the scale (past 1024 processes) at which the performance model has been validated.
Next, we intend to act upon the results from the predictive analysis of a partitioning algorithm’s effect on HYDRA’s runtime. First we shall extend HYDRA’s partitioning process such that it is able to read in the mesh partitioning data from serial algorithms, and second run a performance analysis
to determine if the effect of these partitions on HYDRA’s runtime matches the predicted effect.
Lastly, we intend to predictively and empirically analyse the effect of different partitioning algorithms on HYDRA’s runtime when using a variety of datasets, as we plan to use the runtime performance model to examine the continued effectiveness of these algorithms as new datasets are brought into use.
ACKNOWLEDGEMENTS
This research is supported by both Rolls-Royce through the Cleansky project and by Bull through their PhD sponsorship programme. The authors would like to thank Rolls-Royce plc for the provided support and for granting permission to
publish this work. Access toTinisis provided by the Centre
for Scientific Computing at the University of Warwick. Additionally this work used the ARCHER UK National Supercomputing Service (http://www.archer.ac.uk).
REFERENCES
[1] G. R. Mudalige, M. K. Vernon, and S. A. Jarvis, “A Plug-and-play Model for Evaluating Wavefront Computations on Parallel Architectures,” in Proceedings of the 22nd Interna-tional Parallel and Distributed Processing Symposium 2008
(IPDPS’08). Miami, Florida: IEEE Computer Society, Los
Alamitos, CA, April 2008, pp. 1–14.
[2] K. J. Barker, K. Davis, A. Hoisie, D. J. Kerbyson, M. Lang, S. Pakin, and J. Sancho, “Using Performance Modeling to Design Large-Scale Systems,”Computer, vol. 42, no. 10, pp. 0042–49, 2009.
[3] S. D. Hammond, G. R. Mudalige, J. A. Smith, S. A. Jarvis, A. J. Herdman, and A. Vadgama, “WARPP: A Toolkit for Simulating High-performance Parallel Scientific Codes,” in Proceedings of the 2nd International Conference on
Simula-tion Tools and Techniques 2009 (ICSTT’09). Rome, Italy:
ICST (Institute for Computer Sciences, Social-Informatics and Telecommunications Engineering, Brussels, Belgium), March 2009, pp. 1–10.
[4] C. L. Janssen, H. Adalsteinsson, S. Cranford, J. P. Kenny, A. Pinar, D. A. Evensky, and J. Mayo, “A Simulator for Large-Scale Parallel Computer Architectures,” International Journal of Distributed Systems and Technologies, vol. 1, no. 2, pp. 57–73, 2010.
[5] M. Heroux and R. Barrett, “Mantevo Project,” https:// mantevo.org/ (accessed March 3, 2016), March 2016. [6] M. A. Heroux, D. W. Doerfler, P. S. Crozier, J. M.
Willen-bring, H. C. Edwards, A. Williams, M. Rajan, E. R. Keiter, H. K. Thornquist, and R. W. Numrich, “Improving Perfor-mance via Mini-applications,” Sandia National Laboratories, Albuquerque, NM, Tech. Rep. SAND2009-5574, 2009. [7] D. M. Schuster, “NASA Perspective on Requirements for
Development of Advanced Methods Predicting Unsteady Aerodynamics and Aeroelasticity,” NASA, Langley Research Center, Tech. Rep. 20080018644, 2008.
[8] J. F. Wendt,Computational Fluid Dynamics: An Introduction. New York City, New York: Springer, March 2013.
[10] R. A. Bunt, S. J. Pennycook, S. A. Jarvis, L. Lapworth, and Y. K. Ho, “Model-led Optimisation of a Geometric Multigrid Application,” inProceedings of the 15th High Performance Computing and Communications & 2013 IEEE International Conference on Embedded and Ubiquitous Computing 2013
(HPCC&EUC’13). Zhang Jia Jie, China: IEEE Computer
Society, Los Alamitos, CA, November 2013, pp. 742–753. [11] S. D. Hammond, G. R. Mudalige, J. A. Smith, A. B.
Mills, S. A. Jarvis, J. Holt, I. Miller, J. A. Herdman, and A. Vadgama, “Performance Prediction and Procurement in Practice: Assessing the Suitability of Commodity Cluster Components for Wavefront Codes,” IET Software, vol. 3, no. 6, pp. 509–521, December 2009.
[12] D. P. Spooner, S. A. Jarvis, J. Cao, S. Saini, and G. R. Nudd, “Local Grid Scheduling Techniques using Performance Prediction,” IEEE Proceedings – Computers and Digital Techniques, vol. 2, no. 150, pp. 87–96, April 2003. [13] G. R. Mudalige, S. D. Hammond, J. A. Smith, and S. A.
Jarvis, “Predictive Analysis and Optimisation of Pipelined Wavefront Computations,” inProceedings of the Workshop on Advances in Parallel and Distributed Computational Models
2009 (APDCM’09). Rome, Italy: IEEE Computer Society,
Los Alamitos, CA, May 2009, pp. 1–8.
[14] D. J. Kerbyson, A. Hoisie, and H. J. Wasserman, “Use of Predictive Performance Modeling During Large-scale System Installation,”Parallel Processing Letters, vol. 15, no. 4, pp. 387–395, December 2005.
[15] H. Gahvari, A. H. Baker, M. Schulz, U. M. Yang, K. E. Jordan, and W. Gropp, “Modeling the Performance of an Algebraic Multigrid Cycle on HPC Platforms,” in Proceed-ings of the International Conference on Supercomputing 2011
(ISC’11). Tucson, AZ: ACM, New York, NY, June 2011,
pp. 172–181.
[16] H. Gahvari, W. Gropp, K. E. Jordan, M. Schulz, and U. M. Yang, “Modeling the Performance of an Algebraic Multigrid Cycle Using Hybrid MPI/OpenMP,” in Proceedings of the 41st International Conference on Parallel Processing 2012
(ICPP’12). Pittsburgh, PA: IEEE Computer Society, Los
Alamitos, CA, September 2012, pp. 128–137.
[17] ——, “Performance Modeling of Algebraic Multigrid on Blue Gene/Q: Lessons Learned,” in 2012 SC Companion: High Performance Computing, Networking, Storage and Analysis
(SCC’12). Salt Lake City, Utah: IEEE Computer Society,
Los Alamitos, CA, November 2012, pp. 377–385.
[18] D. A. Beckingsale, O. F. J. Perks, W. P. Gaudin, J. A. Herd-man, and S. A. Jarvis, “Optimisation of Patch Distribution Strategies for AMR Applications,” Computer Performance Engineering, vol. 7587, pp. 210–223, 2013.
[19] D. A. Burgess, P. I. Crumpton, and M. B. Giles, “A Parallel Framework for Unstructured Grid Solvers,” inProceedings of the 2nd European Computational Fluid Dynamics Conference
1994. Stuttgart, Germany: Wiley & Sons, Hoboken, New
Jersey, September 1994, pp. 391–396.
[20] M. B. Giles, G. R. Mudalige, B. Spencer, C. Bertolli, and I. Reguly, “Designing OP2 for GPU architectures,”Journal of Parallel and Distributed Computing, vol. 73, no. 11, pp. 1451–1460, November 2013.
[21] G. R. Mudalige, M. B. Giles, C. Bertolli, and P. H. Kelly, “Predictive Modeling and Analysis of OP2 on Distributed Memory GPU Clusters,”SIGMETRICS Performance Evalua-tion Review, vol. 40, no. 2, pp. 61–67, October 2012. [22] S. J. Pennycook, C. J. Hughes, M. Smelyanskiy, and S. A.
Jarvis, “Exploring SIMD for Molecular Dynamics, Using
IntelR XeonR Processors and IntelR Xeon Phi Coproces-sors,” in Proceedings of IEEE 27th International Parallel and Distributed Processing Symposium 2013 (IPDPS’13). Boston, MA: IEEE Computer Society, Los Alamitos, CA, May 2013, pp. 1085–1097.
[23] J. R. Tramm, A. R. Siegel, T. Islam, and M. Schulz, “XSBench-the Development and Verification of a Perfor-mance Abstraction for Monte Carlo Reactor Analysis,” in Proceedings of The Role of Reactor Physics toward a Sustain-able Future (PHYSOR’14), Kyoto, Japan, September 2014, pp. 1–12.
[24] A. C. Mallinson, S. A. Jarvis, W. P. Gaudin, and A. J. Herdman, “Experiences at Scale with PGAS Versions of a Hydrodynamics Application,” in Proceedings of the 8th In-ternational Conference on Partitioned Global Address Space
Programming Models 2014 (PGAS’14). Eugene, Oregon:
ACM, New York, NY, October 2014, pp. 9–20.
[25] U. Trottenberg, C. W. Oosterlee, and A. Schuller,Multigrid. Elsevier Academic Press, 2001.
[26] L. Lapworth, “HYDRA-CFD: A Framework for Collabora-tive CFD Development,” inProceedings of the International Conference on Scientific and Engineering Computation 2004 (IC-SEC’04), Singapore, June 2004.
[27] M. S. Campobasso and M. B. Giles, “Stabilization of a Lin-earized Navier-Stokes Solver for Turbomachinery Aeroelas-ticity,” inProceedings of the 2nd International Conference on
Computational Fluid Dynamics 2002 (ICCFD’02). Sydney,
Australia: Springer-Verlag, Berlin, July 2002, pp. 343–348. [28] ——, “Effects of Flow Instabilities on the Linear Analysis of
Turbomachinery Aeroelasticity,” Journal of Propulsion and Power, vol. 19, no. 2, pp. 250–259, March 2003.
[29] P. Moinier, J. M¨uller, and M. B. Giles, “Edge-based Multigrid and Preconditioning for Hybrid Grids,”AIAA Journal, vol. 40, no. 10, pp. 1945–1953, October 2002.
[30] M. C. Duta, M. B. Giles, and M. S. Campobasso, “The Harmonic Adjoint Approach to Unsteady Turbomachinery Design,” International Journal for Numerical Methods in Fluids, vol. 40, no. 3–4, pp. 323–332, September 2002. [31] M. B. Giles, M. C. Duta, J. M¨uller, and N. A. Pierce,
“Algorithm Developments for Discrete Adjoint Methods,” AIAA Journal, vol. 41, no. 2, pp. 198–205, February 2003. [32] L. Reid and R. D. Moore, “Design and Overall Performance
of Four Highly Loaded, High Speed Inlet Stages for an Ad-vanced High-Pressure-Ratio Core Compressor,” NASA Lewis Research Center, Cleveland, OH, Tech. Rep. NASA TP 1337, 1987.
[33] G. Karypis and V. Kumar, “A Parallel Algorithm for Multi-level Graph Partitioning and Sparse Matrix Ordering,”Journal of Parallel and Distributed Computing, vol. 48, no. 1, pp. 71– 95, January 1998.
[34] F. Pellegrini, “Scotch and PT-Scotch Graph Partitioning Soft-ware: An Overview,”Combinatorial Scientific Computing, pp. 373–406, 2012.
[35] J. R. Gilbert, G. L. Miller, and S.-H. Teng, “Geometric Mesh Partitioning: Implementation and Experiments,”SIAM Journal on Scientific Computing, vol. 19, no. 6, pp. 2091– 2110, 1998.