A Manual for Attack Trees
Master Thesis
July 2019
Author:
Tim Sonderen, BSc. Prof. Dr. M.I.A. StoelingaUtwente supervisor: Dr. A. Peter
Nedap N.V. supervisors: Ir. A. Dercksen Ir. P.A.H. van Dijk
A thesis submitted in fulfilment of the requirements for the degree of Master of Science
iii
UNIVERSITY OF TWENTE
Abstract
Faculty of Electrical Engineering, Mathematics and Computer Science Formal Methods and Tools
Master of Science
A Manual for Attack Trees
by Tim Sonderen, BSc.
Nowadays attack trees are often used by large organisations to analyse security threats against their systems. Designing such an attack tree requires detailed knowledge regarding attack trees and the systems to be analysed. In many cases this process relies heavily on personal experience and principles. This causes significant variance between attack trees.
In this thesis, guiding principles and building blocks that are used by experts in the field of attack trees have been analysed in an attempt to further standardise attack trees. This was done by analysing attack trees that have been created in the most prominent papers that regard attack trees. These principles and building blocks were then used to design a model for attack trees that specifies the structure of an attack tree in more detail, as well as an accompanying manual.
To evaluate it, system experts have been asked to create an attack tree for a semi-realistic case; First with only basic knowledge of attack trees, and thereafter with the help of the manual. The model has proven to improve attack discovery and understandability of the resulting attack trees. Additionally, the results were used to iteratively improve the manual. After this test, the model and manual were used in a real case study for Nedap N.V. and evaluated in a more qualitative manner.
Overall, the manual improved the experience of the user. However, the most significant improvements were made in attack discovery, improved detailing and in the understandability when evaluated by others. The model and manual stimulate attack discovery while simultaneously guiding the user towards creating a well structured attack tree.
v
Acknowledgements
vii
Contents
Abstract iii
Acknowledgements v
I Outline 1
1 Introduction 3
2 Objectives 5
2.1 Research Questions and Goal . . . 5
3 Related Work 7 3.1 Attack Trees . . . 7
3.2 Defence Trees . . . 9
3.3 Extensions . . . 9
3.4 Automation and Validation . . . 11
3.5 Case Studies . . . 11
4 Background 13 4.1 Scope . . . 13
4.2 Attack Trees . . . 13
4.2.1 Notation . . . 13
4.2.2 Top-Down Structure . . . 14
4.2.3 Bottom-Up Values . . . 15
5 Methodology 17 5.1 Approach . . . 17
5.2 Defining the Standard . . . 17
5.3 Designing the Model and Manual . . . 18
5.4 Evaluating the Manual . . . 19
5.5 Case Study . . . 19
II Design 21 6 Literature Analysis 23 6.1 GAP Layering . . . 23
6.1.1 Goals Layer . . . 24
6.1.2 Sub-goals Layer . . . 24
6.1.3 Attack Types Layer . . . 24
6.1.4 Attacks Layer . . . 25
6.1.5 Process Layer . . . 25
viii
6.1.7 Relation to Size . . . 25
6.1.8 Node Types . . . 26
6.2 SO Layering . . . 27
6.2.1 Relation to Size . . . 27
6.3 Splits . . . 28
6.3.1 FES Split . . . 28
6.3.2 Components Split . . . 28
6.3.3 Steps Split . . . 29
6.3.4 Physical/Digital Split . . . 29
6.3.5 Relation to Size . . . 29
6.4 Grouping . . . 29
6.5 Other practices . . . 30
6.5.1 Segmentation . . . 30
6.5.2 Subtrees . . . 31
6.5.3 List display . . . 31
6.5.4 One attack . . . 31
6.5.5 Only attacks . . . 31
6.5.6 Countermeasures . . . 31
6.5.7 Attribution . . . 32
6.5.8 Relation to Size . . . 32
6.6 Relations and Positioning . . . 32
7 Design 37 7.1 Visualisation . . . 37
7.2 Which Layering Type . . . 37
7.3 Layer Size . . . 38
7.4 Layer and Splits Relations . . . 38
7.5 Starting Point . . . 38
7.6 Intuitive Representation . . . 39
7.7 Process . . . 39
7.8 Use of Practices . . . 40
7.9 Model Strictness . . . 40
7.10 Result . . . 41
III Evaluation and Refinement 43 8 Evaluation - Quantitative 45 8.1 Setup . . . 45
8.2 Results - Part 1 . . . 47
8.3 Changes to the Manual . . . 49
8.4 Changes to the Setup . . . 49
8.5 Results - Part 2 . . . 50
9 Evaluation - Qualitative 53 9.1 The Company . . . 53
9.2 The Attack Tree . . . 53
9.2.1 Steal from The Cloud . . . 55
9.2.2 Steal from Local Device . . . 55
9.2.3 OWASP . . . 55
ix
IV Conclusions 57
10 Conclusion 59
10.1 Research Questions . . . 59 10.2 Research Goal and Success of the Manual . . . 60
11 Discussion 61
12 Future Work 63
V Appendices 65
A Data of the Literature Analysis 67
B Manual for Attack Trees - Version 1 71
C Basic Manual - Version 1 73
D Manual for Attack Trees - Version 2 75
E Basic Manual - Version 2 79
xi
List of Figures
1.1 Example attack tree for a bank vault . . . 4
4.1 Basic attack tree structure . . . 14
4.2 Simple attack tree for a door . . . 14
6.1 The GAP layering . . . 24
6.2 Percentage of attack trees that use a certain layer or layering.N=60. . . 24
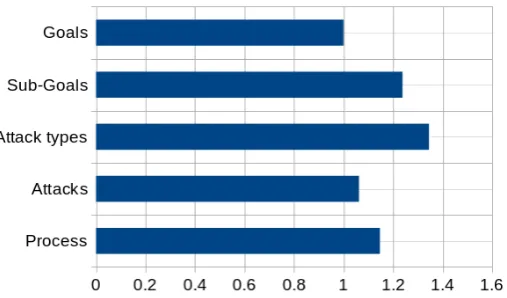
6.3 Average size of attack trees that use a certain layer.N=60, the total average size is 23.7 and is indicated by the horizontal line. . . 26
6.4 The average size per layer of the GAP layering.N=60. . . 26
6.5 Distribution between (S)AND and OR nodes per layer. The splitabovethe layer is documented.N=60. . . 27
6.6 Distribution between (S)AND and OR nodes per layer. The splitbelowthe layer is documented.N=60. . . 27
6.7 The SO layering . . . 27
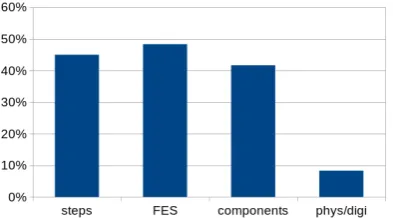
6.8 Percentage of attack trees that use a certain split.N=60. . . 28
6.9 Average size of attack trees that use a certain split.N=60, the total average size is 23.7 and is indicated by the horizontal line. . . 30
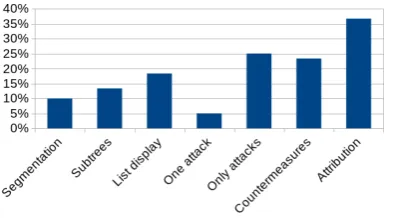
6.10 Percentage of attack trees that use a certain practice.N=60. . . 30
6.11 Average size of attack trees that use a certain layer.N=60, the total average size is 23.7 and is indicated by the horizontal line. . . 33
6.12 The location of a split is determined by its resulting nodes. . . 33
6.13 The location of a split is determined by its origin node. . . 33
6.14 Distribution of splits per layer to a total of 100% per layer.N=60. . . 33
6.15 The location of a split is determined by its resulting nodes. . . 35
6.16 The location of a split is determined by its origin node. . . 35
6.17 Distribution of layers per split to a total of 100% per split.N=60. . . 35
7.1 Model for attack trees . . . 42
8.1 Results of usability test 1. Statements are rated 1 (disagree) trough 5 (agree) by each participant after working with the basic manual or with the full version. The numbers in the table are averages of those ratings. . . 47
8.2 Results of usability test 1. The number of nodes per attack tree were counted. These are averaged in this figure. . . 48
8.3 Results of the peer reviews of usability test 1. These are the number of votes for the attack trees made with the full manual versus with the basic manual. 48 8.4 Results of usability test 2. Statements are rated 1 (disagree) trough 5 (agree) by each participant after working with the basic manual or with the full version. The numbers in the table are averages of those ratings. . . 50
xii
8.6 Results of the peer reviews of usability test 2. These are the number of votes for the attack trees made with the full manual versus with the basic manual. 51
xiii
List of Tables
3.1 Summary of the related work. . . 8
6.1 List of findings regarding the relations between splits and layers . . . 34
7.1 Table of which icon identifies which split or layer . . . 37
7.2 List of findings regarding the relations between splits and layers . . . 39
A.1 Results of the analysis of attack trees from previous literature regarding layer occurance, size and type. 60 attack trees were analysed. For each the size of each layer is listed as well as the type of split above and below it. If a layer has different types of splits, the one that occurs the most in that layer is listed. . . 67
A.2 Results of the analysis of attack trees from previous literature regarding split location. 60 attack trees were analysed for splits and in which layer they occur. In this table the location of a split depends on the location of its resulting nodes. . . 68
A.3 Results of the analysis of attack trees from previous literature regarding split location. 60 attack trees were analysed for splits and in which layer they occur. In this table the location of a split depends on the location of its origin node. . . 68 A.4 Results of the analysis of attack trees from previous literature regarding size
xv
List of Abbreviations
AFT AttackFaultTrees
BDMP Boolean logicDrivenMarkovProcesses
FES Digital and PhysicalForce,Exploits andSocial engineering
GAP Goal,Attack,Process
OWA OrderedWeightedAverage
SAND SerialAND
SO Specification andOrganisation
In this part, the motivation and a small introduction will be given. From there the goal will be set and a number of research questions will be defined to support the process towards that goal. Finally, the methodology will be described which describes the rest of this thesis.
Part I
Outline
3
Chapter 1
Introduction
Being the target of a malicious attack is a serious concern for many companies and organisations, especially when they are a vital part of modern infrastructure such as telecom / utility providers, power plants and banks. An important part of these companies is analysing and managing risk of these malicious attacks. Now the European Union is making the laws of data protection stricter, causing smaller companies to face the need of risk analysis to protect their data and to gain security certificates.
Naturally, many models have been developed to aid the analysis of such threats. One of those models is the model of attack trees. Attack trees are particularly suitable for analysing the security of a system against malicious attackers. It puts the security expert in the shoes of an attacker to gain new insights in vulnerabilities of the system. In most cases the analysis is focused on a single goal. Such a goal would often be a goal that hurts the system or company, but also benefits the attacker. Attack tree analysis can be used for virtually any system, be it physical or digital.
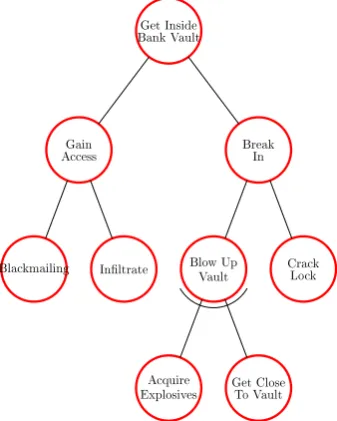
In Figure 1.1 an attack tree for breaking into a bank vault is shown. The main goal is at the root of the tree: getting inside bank vault. That could be accomplished by either gaining access to the vault or by breaking into it. Gaining access could be done by blackmailing an employee with access or by infiltrating the bank e.g. get a job there. Breaking in could be done by blowing up the vault or by cracking the lock. As opposed to the other attacks, blowing up the vault requires multiple (non-trivial) things to be accomplished: Acquiring explosives and getting those explosives close to the vault.
Such an attack tree analysis potentially provides insight into attacks that were never thought of before, where weak spots are, and where improvements to the system have most value. This information could be used for important business decisions such as getting a new security system or moving or splitting important assets to other locations.
The basics of creating an attack tree are rather simple. The challenging part lies in creating one that can provide useful insights into the vulnerabilities of the system. This includes not getting lost in what to include and what to leave out so that the attack tree does not become unwieldy. Additionally, some parts of the system might be impossible to properly model using standard attack trees. Therefore multiple extensions on attack trees have been developed to solve such problems. However these extensions are described across a large number of papers and therefore not easily accessible or combinable for security or system experts. To retain all this (tacit) knowledge, larger companies often hire a dedicated security officer. Smaller companies however, do generally not have the resources for this.
4 Chapter 1. Introduction
Get Inside Bank Vault
Gain Access
Blackmailing Inltrate
Break In
Blow Up Vault
Acquire
Explosives Get CloseTo Vault Crack
[image:20.595.239.408.82.293.2]Lock
Figure 1.1: Example attack tree for a bank vault
entry point into the field of attack trees and provides an explanation on how this extended structure should be used.
The model and manual were evaluated and improved by a quantitative analysis of 34 semi-realistic cases. Thereafter the final version of the manual was evaluated in a qualitative analysis. This was done with a case study for Nedap N.V.
5
Chapter 2
Objectives
2.1 Research Questions and Goal
As mentioned in the introduction, thegoalof this thesis is the following:
Allow (security) experts to be able to create a well-structured attack tree within an acceptable time frame
This would reduce the time and resources needed to spend on researching attack trees before being able to use this analysis technique to analyse the security of your system or company.
One way of achieving this goal could be to design a manual for the creation of attack trees and for the attack trees themself. First however, there has to be a definition of a ’well-structured attack tree’. Besides for the purpose of the manual, by defining what such a tree looks like, an opportunity is created for standardisation and better tooling for attack trees. Second, a first version of a manual such as mentioned before can be designed. Then, this manual will be tested for its usefulness and improvements will be made accordingly. This last step can be repeated either until the desired result is achieved or it can be concluded that a manual does not help.
This process results in the two following mainresearch questions:
R.1 What quantitative or qualitative metrics indicate that an attack tree is structurally well made for the use of security analysis?
R.2 Which guiding principles and building blocks are used by experienced security experts?
R.3 To what extend does a manual improve the ease and speed of the manual creation of an attack tree?
7
Chapter 3
Related Work
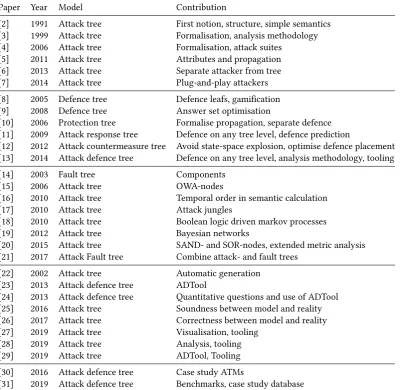
In this chapter related work is described. These papers are also listed in table 3.1 together with a short description of their contributions. In the table as well as in the following section the papers are split into five categories and described in chronological order to easily determine the direction in which the research field is going.
In 2014, Kordy, Piètre-Cambacédès, and Schweitzer [1] presented the state of the art at that moment. In their paper they summarise (to our knowledge) all forms of attack defence modelling that were introduced at that moment.
3.1 Attack Trees
The first mention of using a logic tree for security assessments was mentioned by Weiss [2], they introduced threat logic trees. These trees were based on the previously existing fault trees.
The root of a threat logic tree is the main goal of a hypothetical attacker. From there, each node contains an action that can or must (OR-node or AND-node respectively) be accomplished to reach the goal of its parent. These actions can be split into smaller actions until the action becomes trivial, at which point it becomes a leaf. The nodes are connected by edges, these contain no extra information though.
Each leaf is assigned a level (1 to 10) of negative impact to the system and a level (1 to 10) of effort required from the attacker. From this the risk of the action happening is calculated. Next, these values are calculated for the rest of the tree bottom-up. An OR-node simply takes the highest values of its child nodes and for an AND-node the values are manually reconsidered.
Schneier [3] formalises these threat logic trees into attack trees and describes a methodology for analysing the security of systems using these trees. Mauw and Oostdijk [4] continued this, further formalising attack trees and introducing the concept of attack suites. These attack suites correspond to one path trough an attack tree that consists of one full attack. They also suggested that the value of attack trees lies mostly in the creation of them, not necessarily in the calculation of the semantics. Later, Whitley, Phan, Wang,et al.[5] introduced another way of assigning values to attack trees and the propagation of these values. Their technique was inspired from the field of electrical circuit analysis.
8 Chapter 3. Related Work
Paper Year Model Contribution
[2] 1991 Attack tree First notion, structure, simple semantics [3] 1999 Attack tree Formalisation, analysis methodology [4] 2006 Attack tree Formalisation, attack suites
[5] 2011 Attack tree Attributes and propagation [6] 2013 Attack tree Separate attacker from tree [7] 2014 Attack tree Plug-and-play attackers [8] 2005 Defence tree Defence leafs, gamification [9] 2008 Defence tree Answer set optimisation
[10] 2006 Protection tree Formalise propagation, separate defence [11] 2009 Attack response tree Defence on any tree level, defence prediction
[12] 2012 Attack countermeasure tree Avoid state-space explosion, optimise defence placement [13] 2014 Attack defence tree Defence on any tree level, analysis methodology, tooling [14] 2003 Fault tree Components
[15] 2006 Attack tree OWA-nodes
[16] 2010 Attack tree Temporal order in semantic calculation [17] 2010 Attack tree Attack jungles
[18] 2010 Attack tree Boolean logic driven markov processes [19] 2012 Attack tree Bayesian networks
[20] 2015 Attack tree SAND- and SOR-nodes, extended metric analysis [21] 2017 Attack Fault tree Combine attack- and fault trees
[22] 2002 Attack tree Automatic generation [23] 2013 Attack defence tree ADTool
[24] 2013 Attack defence tree Quantitative questions and use of ADTool [25] 2016 Attack tree Soundness between model and reality [26] 2017 Attack tree Correctness between model and reality [27] 2019 Attack tree Visualisation, tooling
[28] 2019 Attack tree Analysis, tooling [29] 2019 Attack tree ADTool, Tooling [30] 2016 Attack defence tree Case study ATMs
[image:24.595.112.514.220.610.2][31] 2019 Attack defence tree Benchmarks, case study database
3.2. Defence Trees 9
from these values Ingoldsby describe how to calculate multiple quantifiers such as rate of occurrence, absolute risk and annual loss.
3.2 Defence Trees
After these formalisations the notion of adding defences to attack trees arose: Bistarelli, Dall’Aglio, and Peretti [8] introduced defence trees. These trees are like attack trees, but extended with possible defences at the leaves. In addition to adding defensive leaves, they also demonstrated the use of game theory, in combination with the concepts ’return on investment’ and ’return on attack’, to determine which of the defences was best to implement (first). Later, they extended this prioritisation with the use of answer set optimisation [9]
At that same time Edge, Dalton, Raines, et al. [10] also introduced an extension to
attack trees in order to include defences. Though he first revisited the assignment of metrics to leaves of attack trees and the propagation of those metrics up the tree structure. These metrics no longer have to be re-evaluated for every AND-node, but have a defined function for propagation. These metrics can then be used to better analyse the attack tree to find the easiest paths. Being able to pinpoint the weakest points, Edge, Dalton, Raines,
et al. added the use of protection trees to complement attack trees. Such a protection
tree is created by by inverting the attack tree so that for each attack (but with priority for the weakest points), there is a protection against it. By creating protection trees and comparing the cost of a node to the corresponding damages on the attack tree node, one can determine where it is most feasible to implement protections.
Later, Zonouz, Khurana, Sanders,et al.[11] advanced this concept to attack response
trees which are attack trees that can have a defence under any node in the tree. Furthermore, they added a response and recovery engine which systematically predicts where a defence could be added, and what attack could be added to that defence. Naturally, this process quickly expands the state-space. Then Roy, Kim, and Trivedi [12] continued this work, resulting in attack countermeasure trees. These attack countermeasure trees avoid creating and solving a state-space and implement the defensive nodes, or countermeasures, in the form of detection and mitigation events.
Kordy, Mauw, Radomirovic,et al.[13] introduced the formalism of attack-defence trees, which is also a tree that can have defensive nodes at any level. They also discussed the appropriate analysis algorithm to analyse these trees. Finally they also mentioned that they are developing tool support for the attack-defence trees formalism and their plans to extend this to a directed acyclic graph.
3.3 Extensions
10 Chapter 3. Related Work
On a lower level a component can represent a subtree that can be reused e.g. the subtree for a normal door. These components have predefined input and output ports and can replace any part of an attack tree. Furthermore the components allow a black-box type of usage. This means that a whole subtree can be compacted into one node so that it decreases the size of the tree and unnecessary or secret specifics are hidden.
Yager [15] introduced OWA (Ordered Weighted Average) Trees. These are built from OWA nodes instead of the classic AND- and OR-nodes. An OWA node makes it possible to model how many of its children should be satisfied in order to satisfy the node itself. They even allow probabilistic uncertainty of the number of children that needs to be satisfied.
Jürgenson and Willemson [16] introduced a temporal order in the attacks that can be carried out by the attacker. This brings the model closer to reality and is in some cases more intuitive. They found that with this temporal order, the attacker could achieve better outcomes. Jürgenson and Willemson also introduced a complementary algorithm for analysis of this new form of attack trees. Finally, they also shortly discussed a generalisation from attack trees to rooted directed acyclic graphs to avoid duplicating whole subtrees.
This generalisation is continued by Abdulla, Cederberg, and Kaati [17] as they introduce attack jungles, which are directed acyclic graphs. These can contain multiple roots, reusable nodes and allow cycles to exist. This makes for a more efficient and perhaps more intuitive model. This comes at the cost of more complexity, but this might be partially solved by good tool support. Naturally, they also introduce an algorithm to analyse this structure.
Piètre-Cambacédès and Bouissou [18] introduce the use of Boolean logic Driven Markov Processes (BDMP) in attack trees. BDMPs are dynamic, therefore they make it possible to model attack sequences. Besides attack sequences, they also allow the modelling of defensive aspects such as mitigation.
Poolsappasit, Dewri, and Ray [19] involve Bayesian networks into attack graphs. These Bayesian attack graphs support modelling and better understanding of nodes that are dependant on other nodes like in Bayesian networks. In turn, they show that this can help system administrators by optimising their resources.
Kumar, Ruijters, and Stoelinga [20] use priced timed automata to analyse attack trees. This analysis method can provide quantitive and qualitative information about optimal attack paths and values while allowing subtrees and retaining the intuitive representation of attack trees. Furthermore, they define the semantics of SAND- and SOR-nodes.
3.4. Automation and Validation 11
3.4 Automation and Validation
Soon after the formalization of attack trees the first notion of automatically generating
them came along. This was first mentioned by Sheyner, Haines, Jha, et al. [22]. They
propose an algorithm to automatically generate an attack tree based on a finite state diagram. Furthermore, they also introduce two algorithms for analysing the generated attack trees.
Audinot and Pinchinat [25] define three notions of soundness of attack trees. This soundness targets the correspondence between the attack tree and the original system. The concepts they introduce are admissibility, consistency and completeness. In [26] Audinot, Pinchinat, and Kordy use these concepts to determine the correctness of an attack tree. They design a framework to analyse and express consistency of the attack tree and the system. However, this framework and the concepts it includes are limited to labelled transition systems.
Also, multiple projects such as TREsPASS [27], SecurITree [28] and SaToSS [29] have focused on creating tool support for attack and defence trees. All three of these have a different aim: TResPASS focuses on visualisation of risks while SecurITree is used and sold by Amenaza to consult companies. SaToSS has produced the free open source tool ADTrees for modelling attack trees [23]. Finally, Kordy, Mauw, and Schweitzer [24] shows how create well formed quantitative questions and how to use them to make an attack tree.
3.5 Case Studies
Of course many case studies have been done. In this section we list some of them. These will, among others, be used to study properties of a good attack tree.
Fraile, Ford, Gadyatskaya,et al.[30] report on the application of attack defence trees for analysing the security of ATMs. In their study they found the ease of the ADTree tool helps when creating a tree together with specialists who might not be familiar with the concept even though this was already incorporated in normal attack trees. Furthermore, they found that the corporate wish to include defences and mitigations brings an advantage for ADTrees over normal attack trees.
13
Chapter 4
Background
4.1 Scope
In this chapter we introduce the type of attack tree that we will use for the rest of this thesis. This type of attack tree is based on the basic form of an attack tree, together with some of the extensions mentioned in the previous chapter. We use these extensions for two reasons. The first reason is that these they make using the attack trees more intuitive. They provide functionality that we believe is more in line with the real world e.g. temporal order and a specified number of children to be satisfied. The second reason is that this makes the attack trees more compact and gives the creator of such attack trees more freedom in general. There are more options to combine nodes, or just point to a different part of the tree in order to avoid duplicate sub-trees. The reason that we do not use all available extensions is to not add more complexity. Furthermore, the main focus in this thesis lies in the qualitative aspects of the attack tree, i.e. the structure.
Therefore in this thesis we use the formalized attack tree structure [3] [4] and the addition of defence nodes [13], together with the concepts temporal order in the form of SAND (Serial AND) nodes [16] and components [14] as well as a new way of assigning values to these trees [6].
4.2 Attack Trees
4.2.1 Notation
Before defining the possibilities regarding the building of attack trees it is useful to define the notation of those attack trees. Kordy, Kordy, Mauw,et al.[23] developed a latex style
file for creating attack-defence trees. We made some small additions so it fits better to our needs.
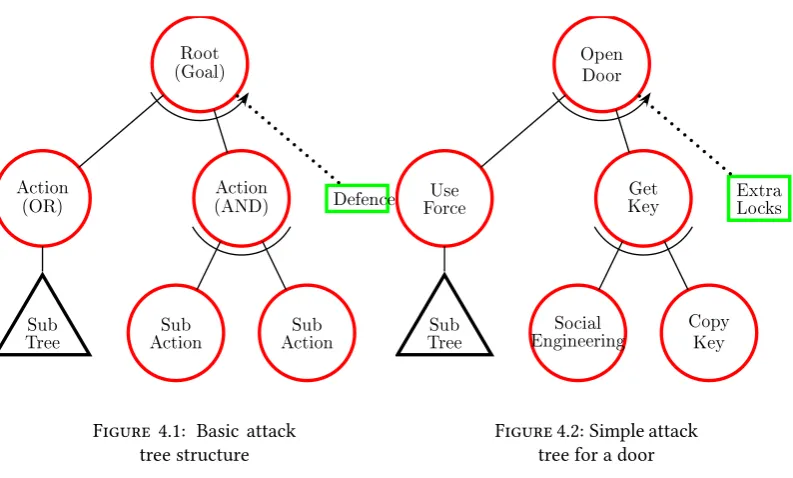
In figure 4.1 the structure of the attack tree is displayed. This will be discussed in the next section, however it also displays all parts of an attack tree:
• Attack node: Red circle
• Defence node: Green rectangle
• Tree component: Black triangle
• Normal relation: Solid line
• Counter relation: Dotted line
Splits In the previous list, as well as the rest of this thesis, the process of subdividing
14 Chapter 4. Background Root (Goal) Action (OR) Sub Tree Action (AND) Sub
Action ActionSub
[image:30.595.111.508.73.312.2]Defence
Figure 4.1: Basic attack tree structure Open Door Use Force Sub Tree Get Key Social
Engineering CopyKey
Extra Locks
Figure 4.2: Simple attack tree for a door
Layers and Rows In the rest of this thesis a row will be defined as a horizontal row of
nodes, so all nodes that are on the same level. This level is not necessarily the depth of the tree as nodes can be placed lower than they normally would. In that case the row is skipped.
Furthermore, layers are a collection of rows.
4.2.2 Top-Down Structure
An attack tree consists of nodes. Each node represents an action and is properly named after that action. Therefore, in this thesis the simulation of an action that is represented by a node will often be referred to as executing a node. When building an attack tree, the analyst starts with the root node, which is at the top of the tree. The root is the first node of the tree and represents an attack on the system. From there, if the node is not trivial, the attack is split up in actions required to successfully complete the attack. These sub-actions become child nodes and can include multiple ways of achieving the goal of the parent node. Each node is either an OR-, AND- or SAND- node. This determines which of its child nodes should be executed in order to complete it. In the case of an OR-nodeanyof its children have to be executed. In the case of an AND-nodeallof its children have to be executed. The
SAND-node is a special case of an AND-node where the children have to be executed in a specific order (in most cases from left to right).
This process of splitting the action, assigning children and determining whether the node should be an OR-, AND- or SAND-node can be repeated for each newly created node until the action can be seen as trivial. The basic structure of an attack tree and a potential (incomplete) realisation of it are displayed in figures 4.1 and 4.2 respectively.
It is also possible to add defence nodes. For example; there is an attack node, but there is already a counter in place a defence node can be added there. Then, from that defence node a new subtree can be created again to expand the defence or to model an attack on that defence.
4.2. Attack Trees 15
4.2.3 Bottom-Up Values
The attack tree structure in itself can be very useful for vulnerability insights in a system. Though it might be helpful to also analyse the system using quantifiable methods. In order to do this, more attributes must be added to the attack tree than just the name and an node type. An important note is though, that the structure has to be finished before any values can properly be assigned to these attributes.
All nodes in the tree must have the same attributes, however their value can vary. These attributes can be anything that might be of interest for the analyst. Attributes that are used often are risk appetite, time available, budget available and skill level/chance of success. Especially budget available is an easy measure to compare: If the attacker has to spend more money than he will gain, the chances of the attack happening are small. E.g. if an attacker has to spende2000 on tools to get into a vault, but there is onlye500 in the vault he will probably go look for another target. An important requirement for this statement is that the attacker knows the value of what is inside the vault.
Each leaf is assigned a value for each chosen attribute. This value is then propagated up the tree so that each node gets its own value for all its attributes. In the first versions of attack trees, the way to propagate these values up the tree was by re-evaluating each node. Now though, this has been standardised for easy automation and most extensions to attack trees bring their own algorithms to do this. In most cases the value assignment of the leaves still has to be done manually and is completely reliant on expert knowledge. Therefore it remains one of the most challenging tasks in appraising attack trees.
When propagating values up the tree we can make a distinction between three types of attributes. These types and their appropriate propagations are discussed next. In each of the formulas givenxis a node in the attack tree and the functionchild(x, i)returns theith
child ofx. The functiontype(x)returns the type of a specified node, which could be of the
type (S)AND, OR or LEAF.
Probabilities These can be propagated using probability theory. For OR-nodes the
probability that any one of the child nodes is successful is needed. This is calculated by negating the chance that all child nodes are not successful. For AND- and SAND-nodes all child nodes need to be successful. When the node is a leaf node, the probability should be given.
This results the functionP(x)as specified in Formula 4.1 which returns the probability
of success of a specified node.
P(x) =
Given iftype(x)= LEAF
1−Qn
i=1(1−P(child(x, i))) iftype(x)= OR
Qn
i=1P(child(x, i)) iftype(x)= (S)AND
(4.1)
Costs The second type of attribute that can be assigned to nodes are simple costs. This
can be monetary costs, cost of time, etc. These costs just add up for every action that is taken. An OR-node simply takes over the cost of its cheapest child node; it is assumed that the attacker will take the cheapest path. For AND- and SAND-nodes all child nodes have to be successful, therefore the cost of all child-nodes is summed.
This results the functionC(x) as specified in Formula 4.2 which returns the cost of a
16 Chapter 4. Background
C(x) =
Given iftype(x)= LEAF
minni=1C(child(x, i)) iftype(x)= OR
Pn
i=1C(child(x, i)) iftype(x)= (S)AND
(4.2)
Requirements This could, for example, be a minimum skill level or a minimum amount
of people. These requirements indicate a minimum value of a certain attribute. Therefore it is easily propagated: OR-nodes take over the requirement of their cheapest child node, following the easiest path. AND- and SAND-nodes take over the requirement of their most expensive child node, because all of the child nodes need to be satisfied.
This results the functionR(x)as specified in Formula 4.3 which returns the value which
is at least required for success of a specified node.
R(x) =
Given iftype(x)= LEAF
minni=1R(child(x, i)) iftype(x)= OR maxni=1R(child(x, i)) iftype(x)= (S)AND
(4.3)
These propagation formulas can only be used when subtrees are not reused. This is acceptable for the purpose of this thesis. If the need to add reusable subtrees arises, the methods in [20] by Kumar, Ruijters, and Stoelinga will be used.
17
Chapter 5
Methodology
5.1 Approach
The methodology of this thesis is based on the design science research methodology for information systems research introduced by Peffers, Tuunanen, Rothenberger,et al.[32]. The aim of their research is to offer a common accepted framework for research in the field of design science. They define the following six steps to be part of such a methodology:
1. Problem identification and motivation 2. Define the objectives for a solution 3. Design and development
4. Demonstration 5. Evaluation 6. Communication
These steps, and therefore this research, are devisable in three parts. The first part is finding out what can be used to define objectives and then defining the objectives. The second part is a repeatable process of designing the manual and demonstrating and evaluating it. Finally, the last part is writing the thesis and presenting it.
5.2 Defining the Standard
The first step is to define a model for attack trees. This model will be based on attack trees made by professional researchers in the field of attack trees. It has been assumed that generally, these researchers create the highest quality attack trees, because they often have studied the field of attack trees for a long time and have contributed in creating attack trees as they are now. Therefore the attack trees they have made in their papers will be analysed to determine which aspects and building blocks are important to create a well structured and clear attack tree.
To determine the which papers should be used for this analysis, several paper catalogues and attack tree databases will be searched for the most cited papers.
Naturally, it is difficult to define what will be searched for in these attack trees before actually analysing them. Though the search will start with the following list, more could be added after discoveries have been made:
18 Chapter 5. Methodology
• Node grouping: Are nodes grouped together in a way not caused by the normal splitting of nodes?
• Splits: Is there a specific way of splitting nodes at certain levels of the tree? • Rate of abstraction: How much are nodes abstracted each step?
• Tree traversal: Are nodes created depth-first, breadth-first or a combination of those? • Other practices: Which other practices are used to manage an attack tree in e.g. size
or modularity?
Some of these aspects might require a little more explanation than the questions described above;Node architecturerefers to making a distinction between certain layers of the tree where specific types of nodes are grouped together in one layer. For example there could be a layer containing only high level attacks which has a layer below it that only includes the means needed to execute those attacks.
Node groupingaims at nodes that are purposely put somewhere else, i.e. positioning
of nodes that is not caused by the natural flow of the tree.
Splitting refers to intentionally splitting the nodes in certain sub-nodes. A good
example would be if an attack is split between digital attacks and physical attacks. In the list above, as well as the rest of this thesis, the process of subdividing nodes that represent an action into children that represent the proper sub-actions will be referred to as splitting nodes.
Rate of abstractionis in how much detail the children of a node describe their actions.
For example the node ’Open door’ could be assigned a child node ’Use a hammer’, however it could also be assigned the node ’Use force’ which is much more abstract.
Tree traversalmainly affects the thought process when brainstorming for new nodes.
It could be advisable to think of attacks layer by layer because they need a different type of thinking, or it could be more efficient to first work out one full attack and then the next.
Other practices refer to handy practices which do not necessarily change anything
to the contents of an attack tree, but are more focused on ’managing’ it or adding extra information to it. This could include things like how to display a very large attack tree one a page.
This analysis will primarily be conducted during the first phase of the research, however also during the designing of the model and manual, this analysis will continue. This will ensure that all aspects that can be found will be found and included in the final design.
5.3 Designing the Model and Manual
The aspects that are found will be properly defined in a model, and where it is not possible to put them in a model, they will be properly defined separately. This model would ideally form a meta-model for attack trees, which gives as much structure to attack trees as possible, while staying simple enough to be able to explain relatively easily. The more practices, aspects and building blocks are gathered, the better this model can be used as a general standard. The extensiveness of the model also determines the level of enforcement that can be used.
5.4. Evaluating the Manual 19
the manual and its original goal of allowing experts to create proper attack trees within an acceptable time frame.
Of course, the model, as well as the manual are unlikely to be perfect on the first try. Therefore the designing process of both will continue throughout the research and it is expected that, especially after the evaluation, significant changes will be made. Big or important changes will be documented whereas smaller details will be just be added in the next iteration.
5.4 Evaluating the Manual
To improve upon the model, but mainly the manual, they will be evaluated. This will be done first by a series of usability tests. These usability tests will be continued until it can no longer be improved through the feedback of usability tests or until there is no time left available to do more usability tests.
During these usability tests, participants will be asked to create an attack tree of a system they know. Ideally, half of them would do it with a manual and the other half would do it without any help. However, it is expected that participants are not willing to spend the required time and effort to read up on attack trees completely by themselves. Moreover, this is likely to cause a very wide range of attack tree types which are barely comparable.
Instead, the participants that would otherwise have worked without a manual now get a very simple manual. This simple manual will guide them in the correct direction and tell them the purpose of an attack tree being made. This way they know what the goal is for them and what they should be working towards.
After the participants have created their attack tree, a series of questions will be asked to determine what they thought of the usability and the helpfulness of the manual. Thereafter, they will be asked to compare attack trees made by other participants to determine whether the full manual improves the quality of the resulting attack tree.
To deal with the time constraint of the goal of this research, all participants are given limited time to complete their attack tree. How much time they are given will be determined by a quick pre-evaluation test.
5.5 Case Study
To properly demonstrate that the manual helps with quickly creating well structured attack trees, a case study will be done. This case study will be conducted at a company; a connection will be provided by Nedap N.V. During this case study, the manual will be presented instead of just provided to read. Then, the manual will be followed to create an attack tree that is a correct representation of the risks of the company. As with the rest of this thesis, the focus during this case study will be on the structure of the attack tree and discovering new attacks. Adding values to the nodes is an optional addition.
After describing what the goal is and why, we proceed with analysing attack trees from previous literature. This gives insight as to what makes an attack tree a good one. This information could then be used to design a model as well as a manual to communicate that model and explain how to use it. This resulted in an initial version of the manual.
Part II
Design
23
Chapter 6
Literature Analysis
In this chapter, the initial research towards quality defining aspects is documented. This initial research is gathered from previous literature and will help answering research questions R.1 and R.2.
Other researchers have worked with attack trees, some of them since the first notions of attack trees. They have followed the developments made in this field and gained experience accordingly. Intentional or not, each of them will have developed their own way of creating attack trees.
To find out how attack trees are commonly build, we analysed 60 attack trees sourced from the papers they wrote. The aim is to find a general standard for this field of research. Therefore Google scholar, Scopus and Science Direct were searched for the terms ’attack tree’, ’attack trees’, ’attack tree case study’ and ’attack trees case study’. Where possible the results were prioritised by reference count. Furthermore papers were taken from the review paper from [1] and from the library of attack trees created by the SaToSS group [29] of the university of Luxembourg. In this search for attack trees, papers without actually describing an attack tree were skipped. Also small trivial examples were not taken into account. If more than one attack tree was described in a paper the most advanced one was picked. This resulted in a set of attack trees sourced from [2], [4], [12], [13], [15], [17], [20], [30], [33]–[84].
At first, mainly the aspects mentioned in Section 5 were investigated: tree architecture, node grouping, node splitting and rate of abstraction. The aspect pruning and tree traversal were left for the reflection and interviews as that information is very difficult to obtain from only a tree, if not impossible. Of course, more patterns might arise. When one does it is documented and all previously analysed attack trees are reiterated to check for that pattern. All of these patterns and how much they were used are described below and a full table of which attack tree contains which features is included in Appendix A
6.1 GAP Layering
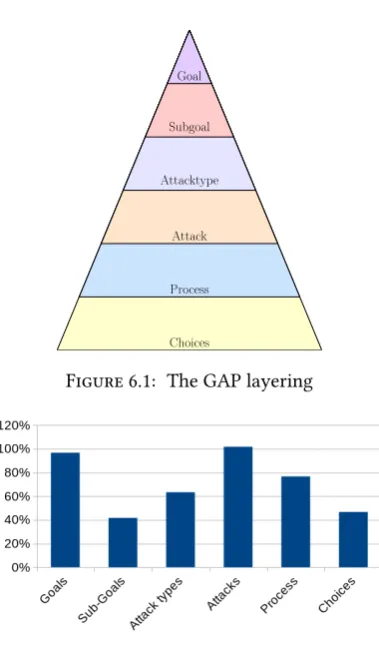
Immediately from the start of this analysis six layers could be identified. These layers were
goals,sub-goals,attack types,attacks,processandchoices.
24 Chapter 6. Literature Analysis
Choices Process Attack Attacktype
[image:40.595.214.404.66.390.2]Subgoal Goal
Figure 6.1: The GAP layering
Figure 6.2: Percentage of attack trees that use a certain layer or layering.
N=60.
6.1.1 Goals Layer
95 percent of attack trees have a goals layer. The goals layer consists of the main goal which always at the top of the tree. The most informative thing about this statistic is that it means that 5 percent of the attack trees analysed do not have a goal. This suggests that these attack trees are aimed at an attack, instead of a goal. It would be a possibility that they are aimed at attack types, explained hereafter, but in the case of these three attack trees they are not. So, in some cases, attack trees are also used to analyse a single attack, without any specific goal in mind.
6.1.2 Sub-goals Layer
40 percent of attack trees has a sub-goals layer. Introducing a sub-goals layer seems to be an obvious step when an attack tree gets larger, because it organizes the rest of the attack tree below it. For now this is important to keep in mind, because it indicates that things might be done differently (e.g. more layers) if attack trees grow large enough. The sub-goals layer generally consists of certain different parts of a system that could be targeted.
6.1.3 Attack Types Layer
6.1. GAP Layering 25
The line between the sub-goals layer and the attack types layer might seem vague, because they both organise the subtrees below them. However there is also a clear distinction. The most important difference between sub-goals and attack types is that sub-goals often specify what to attack and attack types obviously specify different types of attacks for each of those things to attack.
6.1.4 Attacks Layer
100 percent of attack trees have an attacks layer. It seems obvious that this is the most important layer of an attack tree. Whether it is used for a high level analysis of possible attacks or whether it is used to analyse a single attack, the attack layer is always included. Although they are always included in this test set, it is difficult to tell exactly when something is defined as an attack when it is in the lowest layer of the tree: Depending on the creator it could be meant as a category with further splits still to be made.
6.1.5 Process Layer
72 percent of attack trees have a process layer. This layer comes after the attack layer and describes what has to be done for the attack to be executed. It is often easily detected in an attack tree, mainly because there is a switch from largely OR nodes to largely AND and SAND (Serial AND) nodes. I.e. instead of considering options the analyst is now determining what has to be done to execute an attack. Because it describes what has to be done once more (previously in the goals layer) but now on a lower level, this layer is also the layer where subtrees might be started; That will be discussed further in Section 6.5.2. Finally, this layer can grow rather large in comparison to other layers when an attack tree is built without SAND nodes, because some times nested AND nodes are used to simulate a SAND node.
6.1.6 Choices Layer
45 percent of attack trees have a choices layer. This layer comes after the process layer. After being described what has to be done, this layer describes how that could be done one last time. Therefore it also clearly turns back from AND and SAND nodes to OR nodes. In all cases where this layer was included, it was also the last layer. Most often there is no reason to believe that there could be another layer, however there are attack trees where this layer gets rather large. The attack trees where this happened were focussed on software.
6.1.7 Relation to Size
Besides discovering what kind of layering is used, it is also of interestwhenwhich layers are used. With that information advise can be given on when to use certain layers. In Figure 6.3 the layers are listed with the average size of the attack trees that uses that layer.
As can be seen, most layers do not deviate much from the average. Mainly attack trees that have an attack types or choices layer are larger on average. This is in line with expectations as attack types are organisational and become obsolete when the number of attacks gets too small. The choices layer less so. However a reason that attack trees with a choices layer are larger on average could also be simply because they have that layer. The lower in a tree, the more nodes a layer has. Therefore just the addition of this layer could cause the size increase.
26 Chapter 6. Literature Analysis
Figure 6.3: Average size of attack trees that use a certain layer.N=60, the
total average size is 23.7 and is indicated by the horizontal line.
Figure 6.4: The average size per layer of the GAP layering.N=60.
Finally, this analysis also includes the size per layer of the GAP layering. These numbers are displayed in Figure 6.4. Only layers that are actually used are used in the count, so the minimum number of rows per layer is 1. The average number of rows per layer over all layers is 1.11.
6.1.8 Node Types
Finally, the attack trees were analysed to discover whether layers in the GAP layering mainly use (S)AND nodes or mainly OR nodes. For each occurrence of a layer, the type of split above and below it were noted. The type is checked bottom-up and top-down, even though the attack tree will be made top-down, to increase the chances of finding a pattern. In Figure 6.5 and Figure 6.6 the distribution of the two types is displayed per layer.
In both figures there is a rather clear preference for either type on every layer except for the type above the sub-goals. In first instance it, the split below a layer is most important, because the attack tree will be built top-down. The splits below the layers indicate an initial type; Attacks often split with (S)AND nodes while the other layers most often split with OR nodes. For the goals and sub-goals layers there is still a realistic possibility of a (S)AND node too.
[image:42.595.184.438.239.388.2]6.2. SO Layering 27
Figure 6.5: Distribution between (S)AND and OR nodes per layer. The split above the layer is documented.
[image:43.595.291.477.84.193.2]N=60.
Figure 6.6: Distribution between (S)AND and OR nodes per layer. The split below the layer is documented.
N=60.
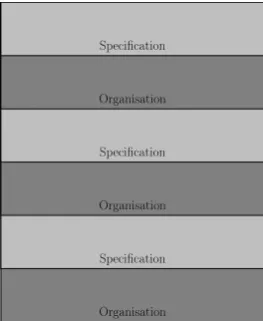
Organisation Specication Organisation Specication Organisation Specication
Figure 6.7: The SO layering
6.2 SO Layering
TheSO (Specification/Organisation) layering is one of alternating layers of specification
and organisation as displayed in Figure 6.7, or more specifically: alternating rows of (S)AND and OR nodes. At the root of a tree there is a specification of what is supposed to happen. Then there is a layer that organises the subtrees below into categories and then another specification of what is supposed to happen. Important to note here is that although it is called an organisational layer, it is not the case that they can be left out. In the remainder of this thesis this layering will be referred to as SO layering. 27 percent of attack trees fit in this type of layering.
6.2.1 Relation to Size
Also for this layering type, the size of attack trees that use it is analysed. Attack trees with the SO layering are slightly smaller on average. The total average size is 23.7 nodes while the average size of attack trees that comply with the SO layering is 22.13 nodes. The use of the SO layering was not expected to have a relation to size.
[image:43.595.220.352.263.424.2]28 Chapter 6. Literature Analysis
Figure 6.8: Percentage of attack trees that use a certain split.N=60.
6.3 Splits
Besides layering, the way certainnodes are split into sub-nodes is also investigated. These splits were mostly used as intuitive organisation so that the attention of the analyst is focussed in a particular direction. As described before, the list of expected splits is the following:
• A split between digital force, physical force, exploiting system flaws and social engineering
• A split between system components
• A split between physical and digital approaches
• A split that splits an attack or goal into a step by step plan No recurring splits were found besides the ones that were expected.
Each of these splits and what percentage of attack trees used them are discussed below. The results are also shown in Figure 6.8.
6.3.1 FES Split
48 percent of attack trees use a split between digital force, physical force, exploits and social engineering. This split will be referred to as the FES split (Force, Exploit, Social engineering). This split is mostly used in the attack types layer to split a goal into the previously mentioned four types of attacks. Another option is that this split is used in the choices layer to give a standard grouping of options. Naturally, this is always a split of an OR node.
Most attacks fit in to at least one of these types. However that does not mean that all types are necessarily filled for every attack tree.
Even though only 29 out of 60 attack trees use this split explicitly, more attack trees
couldbe split with FES split as they have its components. However, they are located in sub
trees that are further apart. In other words; some attack trees have the force, exploits and social engineering somewhere in the attack tree, but not under the same node. Others have even effectively made this split, but named it differently. Because of this, there is a high possibility that more trees can be made to use the FES split if the intention is there.
6.3.2 Components Split
6.4. Grouping 29
a system which has semi-separate components. However the components split is mostly used in the sub-goals and attack types layers. The likely cause of this is that systems that are large enough to be split into components are most often high up in the tree.
This split is simple and rather obvious when useable. Partially because of that most trees that do not split on components already will not be able to either. This is because as opposed to the FES split, it is not an abstract categorisation, but the system actually has to consist of those semi-separate components.
6.3.3 Steps Split
45 percent of attack trees use a split that splits a goal or attack into a step by step plan of action. In some cases this is done with the use of a SAND node, in other cases by nesting of AND nodes to simulate the same. This step-by-step split is very intuitive to use and to analyse. However, it does go against some earlier notions of how an attack tree was supposed to work. Some papers suggest that when an attack tree is constructed, attack scenarios should be acquired by starting at a leaf and working up to the root; so vertical attack scenarios. When this step-by-step split is used, the attack scenario essentially shifts from vertical to horizontal. Although it opposes earlier notions of attack scenarios in attack trees, it does synchronise with the layering seen in the previous subsection.
6.3.4 Physical/Digital Split
8 percent of attack trees use a split between physical and digital attacks. This split was expected to occur more often, however it has the same function as the FES split, which appearance is favourable. Even though there is not an explicit split between physical and digital attacks, it is more often than not easy to fit in. Though most analysts seem to choose to not add the extra node. This might be different when attack trees become larger, however that is just speculation.
6.3.5 Relation to Size
As with the layering, it is also important to know when to use certain splits. In Figure 6.9 the splits are listed with the average size of the attack trees that use that split.
From the figure, it is immediately clear that attack trees that contain a split between physical and digital attacks are generally much larger than the average attack tree size. This makes sense, because this is an organisational split and besides that, it is a very abstract split. This means that in order to be able to make such a split, the attack tree has to contain a rather large range of attacks and less abstract attack types already.
The attack trees that make use of the other three splits are generally smaller than the average. However their averages are close together and on further inspection they are almost exactly average when the attack trees with a split between physical and digital attacks are excluded. Therefore no solid conclusions can be made for a relation between these splits and the size of the attack trees in which they are used.
6.4 Grouping
30 Chapter 6. Literature Analysis
Figure 6.9: Average size of attack trees that use a certain split.N=60, the
total average size is 23.7 and is indicated by the horizontal line.
Figure 6.10: Percentage of attack trees that use a certain practice.N=60.
more clear when looking at just the nodes, but the lines become a tangled and less helpful. This might be useful when nodes are grouped for people that only need a certain group of nodes, but apparently the benefit does not outweigh the cost.
6.5 Other practices
Finally, some general practices have been investigated. These are relatively simple practices which often solve a practical problem. The practices that were checked for are the following: segmentation, focus on countermeasures, use of attributes, displaying the tree as a list, focusing on only one attack and the use of subtrees. What these practices entail and what percentage of attack trees use these practices is discussed below and the numbers are also displayed in Figure 6.10.
6.5.1 Segmentation
10 percent of attack trees use segmentation. Segmentation has multiple advantages, mainly for large attack trees. For one, huge attack trees can be divided into segments so that the main tree contains only the high level goals and perhaps attack types. Then each of those leafs can represent a segment that is placed elsewhere. This can be useful for displaying large attack trees in a paper. Furthermore, when done right, separate segments can be made by the appropriate system experts and combined later. This allows for unobstructed parallel work.
It is clear that the advantages of segmentation are not as great for smaller attack trees. However they can still be used there. Again for parallel work or just for making clear that that subtree is very much its own attack tree.
[image:46.595.213.411.239.348.2]6.5. Other practices 31
by a segmentation node and displayed elsewhere whereas subtrees are mainly defined by the GAP layering restarting.
6.5.2 Subtrees
13 percent of attack trees use subtrees. Of course, every attack tree has subtrees, however some attack trees have specific subtrees that start again at the beginning of the GAP layering. These subtrees often start in the process layer when one of the child nodes is not yet (close to) trivial. These subtrees then complete a full GAP layering similar to the original tree did. Additionally, such subtrees often seem to be used for only one or two of the process nodes, never for all of them.
6.5.3 List display
18 percent of attack trees were displayed as a list rather than as a graph. In such a list each node has a number sequence which indicates its position in the attack tree. This number sequence is of the formx.y.z, wherexis the number sequence of the parent and the node is child numbery.
The main advantage of displaying the attack tree as a list instead of a graph is information density. A table has a much higher information density compared to a graph, especially in the case of trees. Therefore, when page size is limited and the attack tree is large, displaying it as a list might be the only option. Particularly wide attack trees quickly reach the limits of a page. Additionally, when each node has attributes assigned to it, it is easier to display these in a table, therefore they often go hand in hand. Again, the information density makes it so that the attack tree can be much larger.
6.5.4 One attack
5 percent of attack trees are focussed on only one attack. These attack trees have no goal specified and only describe the execution of a single attack, or in other words; The goal is the execution of a specific attack. In the case of these attack trees, this also means that there is no attacker that is a limiting factor or wants a specific thing to steer the attack in a certain direction. Therefore these attack trees can get rather large, because they specify in great detail the accomplishment of the attack.
6.5.5 Only attacks
25 percent of attack trees are focussed on just attacks. These attack trees have a goal, maybe some sub-goals and attack types and then the attacks. However the attack tree stops at the attack; there is no description of how to execute those attacks. This is likely where the attacks becomes trivial for the analyst, which means in principle the attack tree has served its purpose for him. This might make it incomplete for others when they need to work with the attack tree. It is however a good practice when just a global view of the situation is required. It also prevents the tree from growing too large, because the number of nodes in a tree can grow exponentially relative to the depth of the tree as there is no limit to the number of children per node.
6.5.6 Countermeasures
32 Chapter 6. Literature Analysis
countermeasures still need to be taken. Moreover, these countermeasures themselves can also be attacked, therefore a countermeasure is not necessarily a leaf. Arguably this statistic could easily change in either the real world or when the research area is changed to e.g. defence trees.
6.5.7 Attribution
37 percent of attack trees have attributes assigned to the nodes. These attributes help calculate certain odds, costs, etc. as discussed Section 3 and Section 4. The motivation for including these attributes are rather obvious: there is an interest to quantify the risks involved.
No correlation was found between attribution and either layers or splits. However, there did seem to be a correlation between attribution and the list display practice. This makes sense, because adding multiple values to a node in a visual display quickly makes it crowded. It is more organised to make the tree into a table with nodes’ number, name and attributes on one row.
6.5.8 Relation to Size
Once more, it is important to know when to use certain practices. In Figure 6.11 the practices are listed with the average size of the attack trees that use that practice.
To start at the top: attribution seems mainly to be used in smaller attack trees. As long as the attack tree is created manually this makes sense, because for huge trees, the calculation of the attributes becomes exponentially more work.
Attack trees that focus on attacks and therefore stop at the attacks layer are about average in size. Moreover, they go over the average a little. One would expect that such an attack tree would be smaller because of the missing layers. Clearly this is not the case.
Another unexpected result is that attack trees that use list displays are slightly below average in size. The list display was expected to be a means to an end when the attack tree gets too large and needs to fit on a page.
In the same category, a more expected result; segmenting is mostly used in significantly larger attack trees, nearly reaching 50 percent larger attack trees than the average size. Segmenting might not only be a way to be able to display large attack trees, but it also causes large attack trees simply because it allows them to be large without the bottom layers being obviously trivial compared to the top layer.
The practice of designing an attack tree for only one attack and with no goals in mind generally produces smaller attack trees than the average. On average they are roughly 50 percent smaller than other attack trees. This is no surprise as not only is there no goal, there are also no other attacks to expand on.
Finally, adding countermeasures obviously increases the size of the attack tree. It does not change much to the attack tree itself except adding a number of defensive nodes, making the attack tree larger.
6.6 Relations and Positioning
6.6. Relations and Positioning 33
Figure 6.11: Average size of attack trees that use a certain layer.N=60, the
[image:49.595.93.476.241.387.2]total average size is 23.7 and is indicated by the horizontal line.
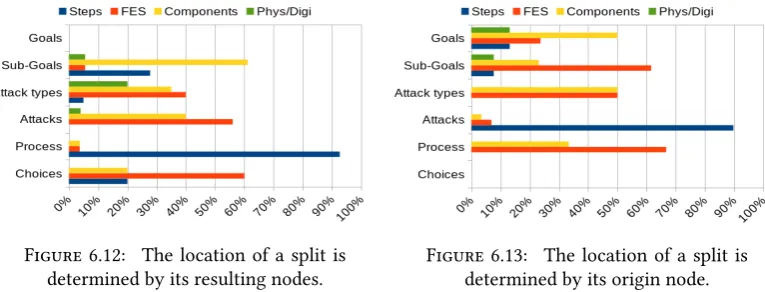
Figure 6.12: The location of a split is
determined by its resulting nodes. Figure 6.13: The location of a split isdetermined by its origin node.
Figure 6.14: Distribution of splits per layer to a total of 100% per layer.
N=60.
Therefore the attack trees were analysed more thoroughly. This time for each split it was noted in which layer it occurred. A difference was made in how the location of a split is defined. The first basically anchors the split by the node that starts it (origin node), the second one anchors the split by the resulting nodes. This was done to increase the possibility that a relation was found, be it in the origin nodes or in the resulting nodes.
This analysis produced four distributions; The distribution of layers per split based on the origin node (Figure 6.13) and based on the resulting nodes (Figure 6.12), and the distribution of splits per layer based on the origin node (Figure 6.16) and based on the resulting nodes (Figure 6.15). In these distributions it is important to remember that not every split that is done in an attack tree is one of the splits that were analysed. This means that if, for example, a layer is indicated to consist completely of one type of split in the figures, other splits than the ones analysed could still be used too.
These figures provide a solid basis for a model for attack trees. Especially in the lower layers of the tree there is a clear line in the relations. The upper layers provide more options for which split is done when. This is likely due to the fact that when an upper layer is skipped the tree still continues to other layers. This provides more room for relations to other layers besides just the next layer. If one of the lower layers is skipped the tree is likely to end there.
34 Chapter 6. Literature Analysis
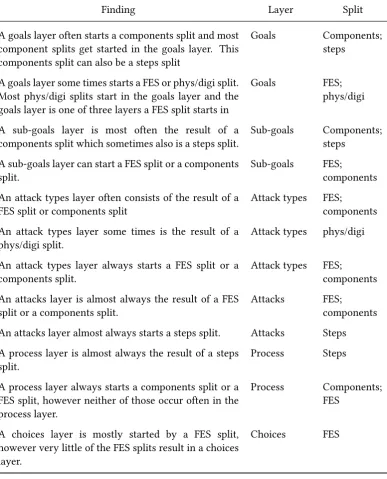
Finding Layer Split
A goals layer often starts a components split and most component splits get started in the goals layer. This components split can also be a steps split
Goals Components;
steps
A goals layer some times starts a FES or phys/digi split. Most phys/digi splits start in the goals layer and the goals layer is one of three layers a FES split starts in
Goals FES;
phys/digi
A sub-goals layer is most often the result of a
components split which sometimes also is a steps split. Sub-goals Components;steps A sub-goals layer can start a FES split or a components
split. Sub-goals FES;components
An attack types layer often consists of the result of a
FES split or components split Attack types FES;components
An attack types layer some times is the result of a
phys/digi split. Attack types phys/digi
An attack types layer always starts a FES split or a
components split. Attack types FES;components
An attacks layer is almost always the result of a FES
split or a components split. Attacks FES;components
An attacks layer almost always starts a steps split. Attacks Steps
A process layer is almost always the result of a steps
split. Process Steps
A process layer always starts a components split or a FES split, however neither of those occur often in the process layer.
Process Components;
FES
A choices layer is mostly started by a FES split, however very little of the FES splits result in a choices layer.
[image:50.595.118.506.175.655.2]Choices FES
6.6. Relations and Positioning 35
Figure 6.15: The location of a split is
determined by its resulting nodes. Figure 6.16: The location of a split isdetermined by its origin node.
Figure 6.17: Distribution of layers per split to a total of 100% per split.