The University of Chicago
Environmental Complexity Influences Association Network Structure and Network-Based
Diffusion of Foraging Information in Fish Shoals.
Author(s): Mike M. Webster, Nicola Atton, William J. E. Hoppitt, and Kevin N. Laland
Source: The American Naturalist, Vol. 181, No. 2 (February 2013), pp. 235-244
Published by:
The University of Chicago Pressfor
The American Society of NaturalistsStable URL:
http://www.jstor.org/stable/10.1086/668825
.
Accessed: 05/08/2014 05:05
Your use of the JSTOR archive indicates your acceptance of the Terms & Conditions of Use, available at
.
http://www.jstor.org/page/info/about/policies/terms.jsp
.
JSTOR is a not-for-profit service that helps scholars, researchers, and students discover, use, and build upon a wide range of content in a trusted digital archive. We use information technology and tools to increase productivity and facilitate new forms of scholarship. For more information about JSTOR, please contact [email protected].
.
vol. 181, no. 2 the american naturalist february 2013
Environmental Complexity Influences Association Network
Structure and Network-Based Diffusion of Foraging
Information in Fish Shoals
Mike M. Webster,* Nicola Atton, William J. E. Hoppitt, and Kevin N. Laland
School of Biology, University of St. Andrews, St. Andrews, Fife KY16 9TF, United Kingdom
Submitted March 29, 2012; Accepted September 7, 2012; Electronically published January 8, 2013 Online enhancement: appendix. Dryad data: http://dx.doi.org/10.5061/dryad.524gv.
abstract: Socially transmitted information can significantly affect the ways in which animals interact with their environments. We used network-based diffusion analysis, a novel and powerful tool for ex-ploring information transmission, to model the rate at which stick-lebacks (Gasterosteus aculeatus) discovered prey patches, comparing shoals foraging in open and structured environments. We found that for groups in the open environment, individuals tended to recruit to both the prey patch and empty comparison patches at similar times, suggesting that patch discovery was not greatly affected by direct social transmission. In contrast, in structured environments we found strong evidence that information about prey patch location was socially transmitted and moreover that the pathway of infor-mation transmission followed the shoals’ association network struc-tures. Our findings highlight the importance of considering habitat structure when investigating the diffusion of information through populations and imply that association networks take on greater ecological significance in structured than open environments.
Keywords: contagion, public information, social information, social
learning, social network, social transmission.
Introduction
Social transmission of information plays a major role in determining how animals obtain information about the environment and can influence movement, resource use, and patterns of interaction (Danchin et al. 2004). For a given population, social network structure, which de-scribes the distribution and frequency of interactions be-tween its constituent individuals, is likely to be important in determining the rate and pattern of diffusion of socially transmitted information (Croft et al. 2008). Social network analysis has been used to quantify the social structure of wild populations in a diverse variety animals, revealing nonrandom and temporally persistent orderings of
asso-* Corresponding author; e-mail: [email protected].
Am. Nat. 2013. Vol. 181, pp. 235–244.䉷2013 by The University of Chicago.
0003-0147/2013/18102-53752$15.00. All rights reserved. DOI: 10.1086/668825
ciations and interactions in groups including cetaceans (Lusseau 2003), pinnipeds (Wolf et al. 2007), primates (Sueur et al. 2011), and ungulates (Sundaresan et al. 2007) among mammals, and in passerine birds (Templeton et al. 2012), reptiles (Leu et al. 2010), and fishes (Croft et al. 2004; 2005). Patterns of association or interaction repre-sent potential pathways for the transmission of informa-tion, and statistical methods that take account of such network structure potentially allow for predictions about the likelihood and rate of transmission occurring both between individuals and throughout the group as a whole. Correspondingly, in recent years, a range of network-based methods have been developed with the aim of an-alyzing the dynamics of the diffusion of information within animal populations and how information flow is affected by social network structure (Franz and Nunn 2009; Hop-pitt et al. 2010a, 2010b; HopHop-pitt and Laland 2011). Ulti-mately, if the factors that influence diffusion rates and patterns can be identified, it should be possible to model future information flow through populations with known network characteristics. In order to achieve this, it is nec-essary to understand how environmental conditions in-fluence the association structure of animal groups and how they might directly or indirectly affect diffusion dynamics. One environmental parameter that can exert substantial influence on social interaction patterns, and conceivably therefore diffusion dynamics, is its physical structural complexity.
236 The American Naturalist
properties such as subgroup size, stability, and fidelity, and patterns of courtship interactions.
To our knowledge, however, no study to date has ad-dressed the effects of environmental structure, and asso-ciated variation in social network metrics, on the diffusion of information through groups. In order to bridge this gap in our understanding, in this study we sought to determine the effect of environmental structural complexity on the association network structure of fish shoals and to identify its effects, via social transmission of information, on the rate and order in which the individuals within these shoals discovered a hidden prey patch. We used the threespine stickleback (Gasterosteus aculeatus) as our study species. Threespine sticklebacks are capable of social learning (Coolen et al. 2003) and are known to exhibit complex, nonrandom patterns of social interaction in the wild (Ward et al. 2002; Croft et al. 2005), making them an appropriate study system.
In the first part of the study, we compared association network structure between multiple groups of fish tested in arenas that contained either open water or an arrange-ment of barriers, designed to simulate natural environ-mental structure. We predicted that groups tested in open water would form fewer, larger subunits. We reasoned that the structured environment would provide cover, resulting in reduced antipredatory behavior, manifest in smaller group sizes (Villafuerte and Moreno 1997; Rhim and Lee 2003; Orpwood et al. 2008). In the second part of our study, we used network-based diffusion analysis (NBDA; Franz and Nunn 2009) to investigate whether information about the location of a foraging patch diffused through the networks and whether the diffusion dynamics were affected by environmental structure. By comparing the entry times of fish into both prey patches and empty con-trol patches, we aimed to distinguish between social trans-mission, in which fish acquired and responded to social information produced by others that had discovered the prey patch, and what we call “an untransmitted social effect,” in which the discovery of a prey patch by a given individual is a side effect of it associating with and fol-lowing others at the same time that they enter the patch.
Methods
Fish Collection and Housing
Threespine sticklebacks were collected from a small tidal stream in St. Andrews, United Kinigdom (56⬚2006N, 2⬚4723W), in October 2007 (part 1) and October 2009 (part 2). In our laboratory they were held in groups of 40 in 90-L aquaria containing a layer of coarse sand, plastic vegetation, and an internal filter. The photoperiod was 12L : 12D, and the temperature was held at 8⬚C. The fish
were fed daily with frozen bloodworm. Part 1 was con-ducted between December 2007 and February 2008 and part 2 between December 2009 and February 2010. No individual was used more than once.
Part 1: Association Network Structure
We quantified the association network structure groups of eight fish in the open and structured environment treat-ments. We tested 16 groups in total, eight in each envi-ronment. Each group was formed by drawing a single fish from each of eight different holding tanks, in order to control for effects of familiarity on association preferences (Ward and Hart 2003). We used fish measuring between 35 and 40 mm standard length, and within each group all fish were size matched to within 2 mm. Individual fish were identified by a 5-mm-diameter disk tag placed over the first dorsal spine. A previous study determined that these tags do not affect fish shoaling preferences (Webster and Laland 2009). We avoided using red or orange tags, since these colors are associated with male nuptial col-oration (Smith et al. 2004) and may affect shoaling be-havior. We used black, white, blue, green, brown, yellow, black/yellow, and blue/white tags. The fish were tagged 3 h before the experiments commenced. Only fish showing no signs of entering reproductive state were used, since this is known to influence social behavior in related species (Webster and Laland 2011).
Experimental Arena
Each group was tested within an arena measuring 80 cm#60 cm (base) and 30 cm tall. The base of the arena
Network-Based Diffusion in Fish Shoals 237
Experimental Procedure
Fish were deprived of food for 24 h before testing. One trial was conducted per day. The fish were tagged at 10 a.m. on the day of testing and held in a 30-L aquarium with black-screened walls and a coarse sand substrate for three further hours. Following this they were netted out and placed in the center of the test arena, from where they were allowed to move around freely for 30 min until the start of the experiment. At the commencement of the ex-periment the camera was switched on by remote control and the arena and group of fish was filmed for 2 h. Fol-lowing this the fish were removed and placed in a separate aquarium. The test arena and substrate were then thor-oughly cleaned in preparation for the next trial.
From the 2-h recording of the trial we constructed an association network for the group. To do this we point sampled the shoaling behavior of the fish at 6-min inter-vals, giving a total of 20 point samples per trial, recording for every individual which other individuals it was shoaling with. This allowed us to construct a pairwise association matrix for each group. The 6-min interval was chosen because, during pilot observations, 3–4 min was seen to be sufficient time for any given individual to associate with (by the criteria described below) and then move away from all of its group mates at least once, in both experimental conditions. By selecting a sampling interval greater than this we were able to be confident that pairwise shoaling associations recorded at t 2 were not dependent on asso-ciations occurring at t 1. Fish were deemed to be shoaling if they were within 2 body lengths of each other. This corresponds to the interindividual distances seen in shoals of sticklebacks described in Webster et al. (2007a). We used a gambit of the group approach (Croft et al. 2008), such that if a cluster of individuals shoaling within 2 body lengths or less were recorded together, then all were as-sumed to be associating with each other, even if the dis-tance between the outermost individuals in the cluster exceeded 2 body lengths. In the structured environment treatment, fish that were within 2 body lengths but that were separated by a barrier were deemed to be associated with one another. While the barriers prevented the trans-mission of visual cues between fish that were either side of them, the groups of fish were typically mobile, and individuals from the same groups often passed either side of the barriers, while continuing on the same trajectory. The barriers were short enough for the fish to regain con-tact rapidly after passing the barrier. Furthermore, vision is not the only sensory modality involved in social rec-ognition and group maintenance in this species, with chemical cues being at least as important (Ward et al. 2004, 2005, 2007; Webster et al. 2007a). The design of the bar-riers did not prevent the transmission of chemical
infor-mation between individuals, and other inforinfor-mation, such as acoustic cues, may also have been transmitted. Finally, we did not wish to impose different shoaling criteria on fish in the two different treatments. One of the aims of this study was to quantify the effects of environmental structural complexity on shoal structure, and using dif-ferent shoal criteria between treatments confounds this aim.
Network Metrics and Statistical Analysis
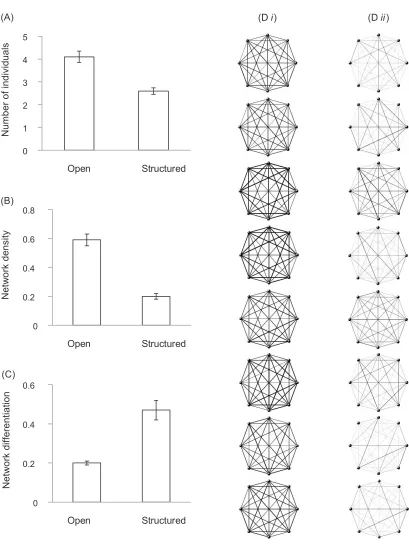
In all but one of the association networks obtained for our groups, all fish were seen to associate with all others in their group at least once (fig. 1D). For this reason, many of the standard network metrics, such as path length, be-tweenness, and clustering coefficient, which are commonly used to describe networks with incomplete connectedness, were unnecessary or inapplicable here (see Croft et al. 2008). Instead, we focused on just three metrics: mean subgroup size, network density, and network differen-tiation.
Subgroup size was determined by calculating the mean number of individuals within each subgroup (groups where individuals were connected by 2 body lengths or less) at each sampling instant and from this calculating a mean for each group. Network density describes the pro-portion of observed pairwise interactions, that is, the num-ber of pairwise interactions observed divided by the max-imum possible number of pairwise interactions. For a network containing eight individuals, where interactions are reciprocal, the maximum possible number of pairwise interactions is 28. As with subgroup size, we calculated the network density at each sampling point for each group and from that determined the group mean. Subgroup size and network density are related, since the size of the sub-groups determines the number of pairwise interactions observed. Finally, we calculated network differentiation, essentially a measure of the evenness of the distribution of the total pairwise interactions between individuals within an association matrix (Edenbrow 2011), derived from the coefficient of variation (standard deviation of observed interactions per pair for the group/mean number of interactions per pair for the group). A lower network differentiation score is indicative of lower variation in the extent to which individuals associate with one another. We compared these three metrics between the open and struc-tured environment treatments using independent samples
t-tests.
Part 2: Diffusion Task
struc-(D i) (D ii)
Number of individuals
Open Structured
Netw
ork density
Open Structured
Network differentiation
Open Structured 0
1 2 3 4 5
0 0.2 0.4 0.6 0.8
0 0.2 0.4 0.6 (A)
(B)
[image:5.594.97.506.107.659.2](C)
Network-Based Diffusion in Fish Shoals 239
tured environments predicted arrival times at a hidden prey patch within the arena. To do this we quantified the association network structure for each of several groups in each treatment before uncovering a previously hidden prey patch and recording the discovery times by each individual.
Experimental groups were established exactly as de-scribed above, and the tagging and settling procedures were identical. We tested five groups of eight fish in each of the treatments. We used a modified version of the ex-perimental arena, described in part 1. A prey patch was placed in the center of the arena, buried within the gravel substrate. This consisted of a Perspex container measuring 4 cm # 2 cm #1 cm containing water and 25
blood-worms. The container was sealed, preventing prey chem-ical cues from entering the water of the test arena. Because the container was set within the substrate, the fish could not see the prey inside it until they passed over it. For the first 90 min of the trial the prey patch was hidden beneath an opaque cylinder, preventing the fish from locating or interacting with it.
We recorded association patterns at 6-min sampling points as described above for the first 90 min of the trial, giving a total of 15 sampling points. Following this, the cylinder covering the prey patch was carefully removed, so as not to startle the fish, revealing the prey patch. The trial ran for a further 30 min.
Using the point samples from the first 90 minutes of the trial we constructed association matrices for each group. In the remaining 30 min we recorded the identity of each fish as it passed over the prey patch and the time at which its first visit took place. During the same 30-min period we also recorded entry times into a control patch, an unmarked patch of substrate of equivalent area to that of the prey patch, located 20 cm away from the prey patch. There were no barriers between these patches in the struc-tured environment treatment. The use of a control patch enabled us to infer whether the location of the prey patch was socially transmitted between individuals via social cues related to discovery of the prey patch, such as feeding strikes (which we observed, in the prey patch), increased activity, or changes in posture (Krause 1992) or whether individuals that had previously associated closely were sim-ply more likely to enter the same areas at similar times, regardless of what those areas contained (more details below).
Network Metrics and Statistical Analyses
We calculated, and compared between treatments, the same network metrics as described in part 1. We then went on to (i) test for social transmission of the prey patch location, (ii) estimate the strength of social transmission
in each environment, and (iii) infer whether the time at which individuals first fed at the food source followed the group’s social network, using network based diffusion analysis (Franz and Nunn 2009; Hoppitt et al. 2010a). NBDA fits a model in which the rate at which a behavioral trait is acquired is a linear function of a naive individual’s total network connection with informed individuals. We used the time of acquisition diffusion analysis (TADA) variant of NBDA, where the times of acquisition are used to fit the model. For multiple groups of individuals, the NBDA model can be expressed as
Nk
lik(t)pl0(t) s
(
冘
aijkz (t)jk ⫹1 (1)
⫺z (t)),ik (1) jp1wherelik(t)is individual i in group k’s rate of acquisition of the trait at time t, l0(t) is a baseline rate function, common to all individuals, which we assumed to be con-stant:l0(t)pl0(see appendix, available online),s≥0is a parameter determining the rate of social transmission between individuals per unit of network connection, where indicates that all acquisition is by asocial means,aijk
sp0
is the network connection leading from individual j to i,
zjkis the status of i at time t, where 1 indicates informed and 0 indicates naive, and Nkis the number of individuals in group k.
240 The American Naturalist
individual A (naive or informed) is causally irrelevant for B’s rate of discovery. Conversely, in the case of social trans-mission, discovery of the food patch causes the discoverer to act in a way that attracts others to the patch, through perhaps increased feeding strikes, increased activity, or changed posture, or merely through a tendency to remain at, or return to, the patch. For both processes, total net-work connection with informed individuals will predict rate of acquisition.
To separate the two processes, we reasoned that the former process would apply on occasions where individ-uals first entered any arbitrary area within the test arena. Conversely, there is no reason why social transmission would operate for an arbitrary patch, since there is no reason why “discovery” of such a patch would cause that individual to behave in a way that caused other individuals to visit that location. Therefore, we identified a control patch in each arena, 20 cm from the prey patch, and re-corded the time at which each individual first entered the control patch. We then treated these data as an additional set of diffusions and replaced the s parameter for the real patch with the termsT⫹sU(≥0) and the s parameter for the control patch with sU(≥0). Here sUquantifies the
“un-transmitted” effect, common to both patches, and sT the
transmitted effect, which operates (if at all) only the real patch. Evidence forsT10 constitutes evidence for social transmission. We estimated these parameters separately for each environment and estimated the difference in social transmission between the two environments. We obtained 95% confidence intervals (CIs) using the profile likelihood technique.
By applying NBDA to multiple groups, the analysis be-comes sensitive to differences in the time of acquisition between groups: that is, if individuals in the same group learn at a similar time, a large s parameter is estimated. Consequently, evidence for s 10 does not necessarily
T
constitute evidence that social transmission follows the network within each group; it could be that information spreads homogeneously within groups. To investigate this alternative explanation, we considered models in which the measured network was replaced with a homogenous network, in which connections between all individuals in each group were set to 1. We used Akaike weights (Burn-ham and Anderson 2002) to assess the relative strength of evidence for social transmission following the network, homogeneous social transmission, and no social effects (see appendix).
We also considered three other variables influencing the rate at which individuals acquire the trait: group, envi-ronment (open vs. structured), and patch (prey vs. con-trol). The latter two factors were included to control for differences in asocial rate of discovery, which might oth-erwise be mistaken for differences in the s parameters,
though there was little evidence any had an effect (see appendix).
NBDA analyses were performed in R 2.14.1 (R Devel-opment Core Team 2011) using code provided on our website (NBDA code V1.2; http://lalandlab.st-andrews.ac .uk/freeware.html).
Results
Part 1: Network Metrics
Mean group sizes were larger in the open water treatment compared to the structured environment (independent samples t-test:tp8.05 df, p14 P, !.001; fig. 1A). Net-work density is directly related to group size and was there-fore also higher in the open water treatment (tp9.06, , ; fig. 1B). Finally, network differentiation dfp14 P!.001
was lower in the open water than the structured environ-ment treatenviron-ment (independent samples t-test: tp⫺5.31,
, ; fig. 1C). dfp14 P!.001
Part 2: Diffusion Task
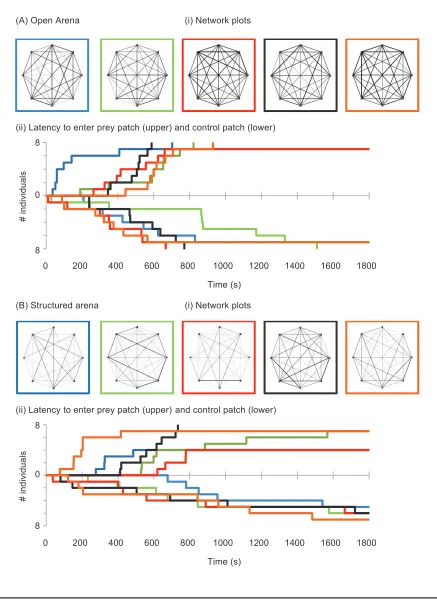
Network metrics observed for the first 90 min (15 sam-pling points) were comparable to those seen in part 1 (see fig. fig. 2Ai and 2Bi for network plots). Mean group sizes and network densities were larger in the open water com-pared to the structured environment treatment (indepen-dent samples t-test: tp7.80 df, p8 P, !.001 and tp , , , respectively). Network differ-4.60 dfp14 Pp.002
entiation was lower in the open water than structured environment treatment (tp⫺3.06 df, p14 P, p.007). The data provide much more support for NBDA mod-els in which social effects follow the network (support [total Akaike weight] p 97.9%) than either those in which social effects operate homogeneously within each group (supportp2.1%) or a model with no social effects (support p 0.0%). Further investigation suggested that the time of discovery follows the network predominantly in the structured environment. We refitted the best model, replacing only the networks for the structured environ-ment with homogeneous networks and found an increase in the corrected Akaike Information Criterion (AICc) of
10.1 (a 160-fold decrease in support). Conversely, when we replaced the networks for the open environment with homogeneous networks, we found an increase in AICcof
only 0.7 (a 1.4-fold decrease in support), indicating that the network is an important predictor of time of discovery only in structured environments.
(A) Open Arena (i) Network plots
(ii) Latency to enter prey patch (upper) and control patch (lower)
# individuals
Time (s)
(B) Structured arena (i) Network plots
(ii) Latency to enter prey patch (upper) and control patch (lower)
# individuals
Time (s)
0 200 400 600 800 1000 1200 1400 1600 1800
0 200 400 600 800 1000 1200 1400 1600 1800
8 8
0
8
[image:8.594.86.523.76.677.2]8 0
242 The American Naturalist
latency of individuals within each treatment group to enter the prey patch (upper half of the panel) and control patch (lower half of each panel in the open [Aii] and structured [Bii] treatments in experiment 2). Each line represents one group. Each group on the diffusion curve is represented by the network plot with the corresponding colored border. Note the steepness of the diffusion curves: in the open environment (Aii), the curves for first entry times into the prey and control patches are of similar steepness, while in the structured habitat (Bii), the diffusion curves showing first entry times into the prey patch are generally steeper compared to those for the control patch. This is consistent with the data providing more support for models in which the social effect differed between the real and control patches in the structured environment, but not in the open environment (see main text for further discussion).
be interpreted as the rate at which naive individuals dis-cover each patch by social transmission, per unit of net-work connection to informed individuals, relative to the baseline rate of asocial discovery. For example, a naive individual with 5 units of network connection to informed individuals in a structured environment is expected to discover the real food patch at a rate of 1⫹5#0.16p (95% ) greater than an individual not 2.2# CIp1.1–4.3
connected to informed individuals. In contrast, for the open environment, there is little evidence of social trans-mission: sTp0.01 (95% CIp⫺0.13–0.10), suggesting there is only an untransmitted social effect. Correspond-ingly, there is reasonable evidence that social transmission is greater in the structured than the open environment (difference estimated at 0.15, 95%CIp0.024, 0.324; fig. 2).
We estimated the untransmitted social effect to be (95% ) in the structured
envi-sUp0.046 CIp0–0.16
ronment and sUp0.25 (95% CIp0.15–0.49) in the open environment.
Discussion
In open environments, fish formed larger groups and in-teracted more equally with their group mates, compared to those in the structured environment treatments. These differences were seen to affect the dynamics of information transfer through the groups. In both open and structured environments, the time for an individual to first visit the hidden prey patch was strongly predicted by the times at which other individuals in their group first visited the patch. However, in the structured environment, there was also strong evidence that information flow followed the network structure, as models assuming a homogeneous within-group network structure had considerably less sup-port. This was not the case for the open environment, probably because of the different, more homogenous net-work structure, meaning that any small departures from a homogeneous network were not meaningful with regard to the flow of information between individuals. This im-plies that association networks may take on far greater ecological significance in structured than in open environments.
Furthermore, in the open water environment, there was
little evidence of a difference between the social effect on the time of first visit to the prey patch and that on the time of first visit to the empty control patch. Consequently, the data here provide no evidence social transmission of the prey patch location. Rather, individuals that associate more frequently may simply be more likely to enter areas of habitat at the same time compared to individuals that associate more weakly, regardless of what those areas con-tain (Lachlan et al. 1998). In contrast, in the structured environment, we saw a substantial difference in the effect between the prey and control patches, indicating strong evidence of social transmission about the location of the prey patch. As the fish in the open environment tended to swim in fewer, larger groups, they were likely to en-counter the prey patch at much the same time, leaving little role for social transmission of information about the food patch. In contrast, in the structured environment, it was more likely that only one or a few fish would en-counter the prey or control patch at once.
net-Network-Based Diffusion in Fish Shoals 243
work association strength and time of discovering the prey patch. The statistical methods employed in this study did not take into account behavior that might provide further cues about the location of the prey patch to observers, by individuals that had already found the prey patch. It is likely that such cues have some influence on the behavior of observers, since previous studies have shown that threespine sticklebacks are strongly attracted to areas where they can see others feeding (Krause 1992; Coolen et al. 2003; Webster and Hart 2006; Webster et al. 2007b). A natural extension to our study is therefore to incorporate discoverer behaviors into weighted NBDAs in order to determine their importance in social transmission of in-formation about patch location.
We have shown that environmental structural com-plexity exerts a strong effect on social network structure, which in turn influences patterns of prey patch discovery through social transmission and social facilitation. This work has also revealed that individual-level social trans-mission dynamics vary, depending on social network structure. These findings have implications for compara-tive work investigating variation in diffusion dynamics and social learning between different groups, or among mul-tiple populations of the same species. Our findings imply that the role of variation in social structure and its un-derlying causes, including variation in environmental structural complexity, may need to be accounted for if researchers are to understand interpopulation behavioral variation. Finally, if researchers are to use association net-work structure to make longer-term predictions about re-source encounter rates in wild populations, then they will need to incorporate information about network stability over time and in response to demographic, seasonal, and environmental perturbations. Information on network sta-bility exists for relatively few study systems. In wild meer-kats (Suricata suricatta), for example, social structure and interaction patterns were reported to be relatively stable over a 24-mo period, but with short-term variation in response to seasonal variation in ecological conditions (Drewe et al. 2009). Ultimately, by incorporating ecological parameters along with estimates of network structure change over time into network-based diffusion models, it may be possible to forecast, within reasonable margins of error, the rates and pattern of the spread of information through animal groups.
Acknowledgments
This project was funded by grants from the Natural En-vironment Research Council (NE/D010365/1) and the Eu-ropean Research Council (EVOCULTURE 232823) to
K.N.L. We thank M. Franz and an anonymous reviewer for their helpful comments.
Literature Cited
Burnham, K. P., and D. R. Anderson. 2002. Model selection and multimodel inference: a practical information-theoretic approach. 2nd ed. Springer, New York.
Coolen, I., L. A. Giraldeau, and M. Lavoie. 2001. Head position as an indicator of producer and scrounger tactics in a ground-feeding bird. Animal Behaviour 61:895–903.
Coolen, I., Y. van Bergen, R. L. Day, and K. N. Laland. 2003. Species difference in adaptive use of public information in sticklebacks. Proceedings of the Royal Society B: Biological Sciences 270:2413– 2419.
Croft, D. P., J. Krause, and R. James. 2004. Social networks in the guppy (Poecilia reticulata). Proceedings of the Royal Society B: Biological Sciences 271:516–519.
———. 2005. Social networks in the guppy (Poecilia reticulata). Pro-ceedings of the Royal Society B: Biological Sciences 271:S516–S519. Croft, D. P., R. James, and J. Krause. 2008. Exploring animal social
networks. Princeton University Press, Princeton, NJ.
Croft, D. P., R. James, A. J. W. Ward, M. S. Botham, D. Mawdsley, and J. Krause. 2005. Assortative interactions and social networks in fish. Oecologia (Berlin) 143:211–219.
Danchin, E., L. A. Giraldeau, T. J. Valone, and R. H. Wagner. 2004. Public information: from nosy neighbors to cultural evolution. Science 305:487–491.
Drewe, J. A., J. R. Madden, and G. P. Pearce. 2009. The social network structure of a wild meerkat population. 1. Inter-group interactions. Behavioral Ecology and Sociobiology 63:1295–1306.
Edenbrow, M., S. K. Darden, I. W. Ramnarine, J. P. Evans, R. James, and D. P. Croft. 2011. Environmental effects on social interaction networks and male reproductive behaviour in guppies, Poecilia
reticulata. Animal Behaviour 81:551–558.
Franz, M., and C. L. Nunn. 2009. Network-based diffusion analysis: a new method for detecting social learning. Proceedings of the Royal Society B: Biological Sciences 276:1829–1836.
Gill, A. B., and P. J. B. Hart. 1994. Feeding behaviour and prey choice of the threespine stickleback: the interacting effects of prey size, fish size and stomach fullness. Animal Behaviour 47:921–932. Hoppitt, W., N. J. Boogert, and K. N. Laland. 2010a. Detecting social
transmission in networks. Journal of Theoretical Biology 263:544– 555.
Hoppitt, W., A. Kandler, J. R. Kendal, and K. N. Laland. 2010b. The effect of task structure on diffusion dynamics: implications for diffusion curve and network-based analyses. Learning and Behav-ior 38:243–251.
Hoppitt, W., and K. N. Laland. 2011. Detecting social learning using networks: a user’s guide. American Journal of Primatology 73: 834–844.
Krause, J. 1992. Ideal free distribution and the mechanism of patch profitability assessment in 3-spined sticklebacks (Gasterosteus
acu-leatus). Behaviour 123:27–37.
Lachlan, R. F., L. Crooks, and K. N. Laland. 1998. Who follows whom? shoaling preferences and social learning of foraging information in guppies. Animal Behaviour 56:181–190.
As-244 The American Naturalist
sociation networks reveal social organization in the sleepy lizard. Animal Behaviour 79:217–225.
Lusseau, D. 2003. The emergent properties of a dolphin social net-work. Proceedings of the Royal Society B: Biological Sciences 270: S186–S188.
Morgan, B. J. T. 2009. Applied stochastic modelling. CRC, Boca Raton, FL.
Orpwood, J. E., A. E. Magurran, J. D. Armstrong, and S. W. Griffiths. 2008. Minnows and the selfish herd: effects of predation risk on shoaling behaviour are dependent on habitat complexity. Animal Behaviour 76:143–152.
R Development Core Team. 2011. R: a language and environment for statistical computing. R Foundation for Statistical Computing, Vienna. http://www.R-project.org/.
Rhim, S. J., and W. S. Lee. 2003. Winter sociality of hazel grouse
Bonasa bonasia in relation to habitat in a temperate forest of South
Korea. Wildlife Biology 9:365–370.
Rubenstein, D. I., S. Sundaresan, I. Fischhoff, and D. Saltz. 2007. Social networks in wild asses: comparing patterns and processes among populations. Exploration into the Biological Resources of Mongolia 10:159–176.
Sueur, C., O. Petit, A. De Marco, A. T. Jacobs, K. Watanabe, and B. Thierry. 2011. A comparative network analysis of social style in macaques. Animal Behaviour 82:845–852.
Smith, C., I. Barber, R. J. Wootton, and L. Chittka. 2004. A receiver bias in the origin of three-spined stickleback mate choice. Pro-ceedings of the Royal Society B: Biological Sciences 271:949–955. Smith, M., N. Milic-Frayling, B. Shneiderman, E. Mendes Rodrigues, J. Leskovec, and C. Dunne. 2010. NodeXL: a free and open network overview, discovery and exploration add-in for Excel 2007/2010. http://nodexl.codeplex.com/. Social Media Research Foundation: http://www.smrfoundation.org
Sundaresan, S. R., I. R. Fischhoff, J. Dushoff, and D. I. Rubenstein. 2007. Network metrics reveal differences in social organization between two fission-fusion species, Grevy’s zebra and onager. Oecologia (Berlin) 151:140–149.
Templeton, C. N., V. A. Reed, S. E. Campbell, and M. D. Beecher. 2012. Spatial movements and social networks in juvenile male song sparrows. Behavioural Ecology 23: 141–152.
Villafuerte, R., and S. Moreno. 1997. Predation risk, cover type, and group size in European rabbits in Donana (SW Spain). Acta Ther-iologica 42:225–230.
Ward, A. J. W., M. S. Botham, D. J. Hoare, R. James, M. Broom, J.-G. J. Godin, and J. Krause. 2002. Association patterns and shoal fidelity in the three-spined stickleback. Proceedings of the Royal Society B: Biological Sciences 269: 2451–2455.
Ward, A. J. W., and P. J. B. Hart. 2003. The effects of kin and familiarity on interactions between fish. Fish and Fisheries 4:348– 358.
Ward, A. J. W., P. J. B. Hart, and J. Krause. 2004. The effects of habitat- and diet-based cues on association preferences in three-spined sticklebacks. Behavioural Ecology 15:925–929.
Ward, A. J. W., R. Holbrook, J. Krause, and P. J. B. Hart. 2005. Social recognition in sticklebacks: the role of direct experience and habitat cues. Behavioural Ecology and Sociobiology 57:575–583. Ward, A. J. W., M. M. Webster, and P. J. B. Hart. 2007. Social
rec-ognition in wild fish populations. Proceedings of the Royal Society B: Biological Sciences 274:1071–1077.
Webster, M. M., J. Goldsmith, A. J. W. Ward, and P. J. B. Hart. 2007a. Habitat-specific chemical cues influence association preferences and shoal cohesion in fish. Behavioural Ecology and Sociobiology 62:273–280.
Webster, M. M., and P. J. B. Hart. 2006. Subhabitat selection by foraging threespine stickleback (Gasterosteus aculeatus): previous experience and social conformity. Behavioural Ecology and Socio-biology 60:77–86.
Webster, M. M., and K. N. Laland. 2009. Evaluation of a non-invasive tagging system for laboratory studies using three-spined stickle-backs Gasterosteus aculeatus. Journal of Fish Biology 75:1868–1873. Webster, M. M., and K. N. Laland. 2011. Reproductive state affects reliance on public information in sticklebacks. Proceedings of the Royal Society B: Biological Sciences 278:619–627.
Webster, M. M., A. J. W. Ward, and P. J. B. Hart. 2007b. Boldness is influenced by social context in threespine sticklebacks
(Gaster-osteus aculeatus). Behaviour 144:351–371.
Wolf, J. B. W., D. Mawdsley, F. Trillmich, and R. James. 2007. Social structure in a colonial mammal: unravelling hidden structural lay-ers and their foundations by network analysis. Animal Behaviour 74:1293–1302.
Associate Editor: Jay Stachowicz Editor: Troy Day