‘’Production process improvement to reduce Work In
Process and increase Delivery Performance’’
Clemens A. Veldhuis
25-06-2015
Production process improvement to reduce WIP and
increase Delivery Performance.
Author:
Clemens A. Veldhuis
University of Twente
Supervisors University of Twente:
1
st: Dr. N.J. Pulles
2
nd: Dr. Ir. P. Hoffmann
Supervisor Brinks Metaalbewerking:
Preface
This master thesis is written to earn my Master degree in Business Administration, track Innovation and Entrepreneurship. The research was commissioned by and executed at Brinks Metaalbewerking B.V.. This research describes a stepwise bottleneck indication and solving method, executed in a practical case study.
I was not able to write this thesis without the help and guidance of several people and therefore I would like to thank first of all my supervisors, N.J. Pulles and P. Hofmann from the University of Twente for the input, enthusiasm, feedback and helpful meetings and discussions. Second I would like to thank W. Breukelman for the support and guidance at Brinks and also the guidance towards a deeper understanding of the link between the theoretical and practical side of business management issues.
Furthermore, I want to thank my family and friends, especially my girlfriend, sister, brother and parents for their support, advice and the discussions on difficult issues which helped to enlighten the topics.
I greatly enjoyed executing this research at the work floor of Brinks and appreciated the conversations and discussions with operators, team leaders and other personnel. Therefore, I thank the operators in Group 10, all project coordinators, managing board, planning and logistic department and all other personnel of Brinks for the instructive time.
The result of this research is a practical and feasible product which is valuable for Brinks and its employees. Also, several theories on bottleneck indication and solving are tested in this single case study.
Clemens Veldhuis
Management Summary
This research is executed in order to increase the delivery performance and decrease the work in process at Brinks Metaalbewerking. Brinks Metaalbewerking produces mostly valve units, hydraulic parts and towing bars. These are produced on milling machines and afterwards cleansed, deburred, packaged and expedited towards the customer.
During the preliminary research it became clear that there is one specific department which is related to the excessive work in process levels and the low delivery performance. Products which go through the cleansing, deburring and packaging department (called Group 10) have an average delivery performance of *** instead of *** and these products count for *** of the sales. The preliminary research also showed that the throughput times of products which go through Group 10 are twice the times of the products which do not go through Group 10. It has been shown that this is not due to longer cycle times. Therefore, the focus of the research is on Group 10.
The goal of the research is to improve the production process at Group 10 to decrease work in process and increase the delivery performance. To improve the production process the Theory of Constraints from Goldratt (1986) is used. The bottleneck indication and solving method from Goldratt (1986) is the guideline for this research.
First, the bottleneck is identified using three different bottleneck methods based on; cycle times, queue lengths and workload. Based on these three methods the Cleanroom is considered to be the bottleneck. At the Cleanroom the cleansed and deburred products are visual inspected, restored when needed and packaged for the customer.
Second, the bottleneck is investigated to exploit it in the most efficient way, this is started by describing and measuring the current process at the Cleanroom. The activities are measured, categorized and labeled non-value adding or value adding. Non-value adding processes are considered waste. These types of waste are the basis for exploiting the bottleneck. The goal of this step was to eliminate the waste and thereby improve the capacity of the bottleneck with the current resources. To eliminate the waste within the bottleneck, recommendations are formed which are afterwards presented to and discussed with a board of experts. Implementing the improvement plan can lead to a grow in value added capacity of 49%. With an equal output there is approximately *** per year, based on the labor cost paid for non-value adding activities, available for other value adding activities.
To accomplish the increase in capacity the following recommendations are formulated. The implementations done at time of writing are mentioned as well.
Implementation: the visual signs are programmed in the current system and the capacity of the lanes is increased towards six baskets.
Information about the products and the inspection process needs to be delivered with the product. In the current situation the products are identified based on experience and the order ticket and work instructions are collected. In the new situation the order ticket is eliminated and replaced by a waterproof punch card and work instruction are showed on a screen. This makes sure that all information needed is available instantly and the start up time of the process is reduced.
Implementation: external IT consultants are invited to discuss the possibilities of integrating the plan in the Cleanroom and the entire factory. A request for quotation is done for the database link and installing mobile screens in the Cleanroom.
The (packaging) materials need to be delivered just in time, instead of being collected by a Cleanroom employee after receiving the products at the Cleanroom. A new function is added to the ERP system which signals were the upcoming orders are placed and therefore the needed packaging materials are visible and can be picked by an operator of a non bottleneck machine in the department. This makes sure that the packaging material is just in time at the right lane in the Cleanroom and therefore the employees of the bottleneck can start inspecting directly when the products arrive. This reduces, combined with the previous mentioned recommendation, the startup time of an order at the Cleanroom.
Implementation: a screen is mounted at the Piller which shows the lanes, a timer and the upcoming products including the required packaging materials. The Piller operator collects the materials from a new placed pallet rack, which is replenished by the expedition department using Kanban cards. The materials are brought to the correct lane at the Cleanroom just in time by the Piller operator.
After inspecting the products, random samples need to be carried out on orders inspected by new employees. This will only be done during their training program, afterwards the employees are certificated and there will not be any random samples. To create responsibility and traceability, each packaging needs to be provided with a card which identifies the inspector. This recommendation reduces the time spend on double inspections and improves the efficiency of the packaging process.
Implementation: the superfluous random samples are abolished and random samples are only executed during a training program of six weeks. Cards with personnel numbers are introduced and added in each packaging material.
Table of Contents
PREFACE ... 3
MANAGEMENT SUMMARY... 4
1. INTRODUCTION ... 9
1.1.PRODUCT AND MARKET ... 9
1.2.PRODUCTION PROCESSES ... 10
1.3.PROBLEM SITUATION ... 12
1.3.1. Defects per Unit ... 12
1.3.2. Delivery Performance ... 13
1.3.3. Throughput Time ... 14
1.3.4. Link between Throughput Time and Delivery Performance. ... 15
1.3.5. Problem Statement ... 15
1.4.METHODOLOGY ... 16
1.4.1. Data gathering... 16
1.4.2. Methodology ... 16
2. THEORETICAL BACKGROUND ... 18
2.1.LITTLE’S LAW ... 18
2.2.THEORY OF CONSTRAINTS ... 19
2.3.LINK WORK IN PROCESS AND DELIVERY PERFORMANCE ... 21
2.4.LEAN MANUFACTURING ... 22
2.5.VALUE STREAM MAPPING. ... 24
3. BOTTLENECK IDENTIFICATION ... 26
3.1.ANALYSIS USING THE THEORETICAL BACKGROUND... 26
3.2.PRODUCTION PROCESS IN GROUP 10... 26
3.3.LINK BETWEEN WIP AND DELIVERY PERFORMANCE AT BRINKS ... 29
3.4.CURRENT REASONS FOR THE WIP AT GROUP 10 ... 29
3.4.1. Cycle Times ... 32
3.4.2. Average queue length ... 33
3.4.3. Workload ... 35
3.5.REMARKS OBSERVATION ... 37
3.6.SUMMARY BOTTLENECK ANALYSIS ... 37
4. BOTTLENECK WASTE ANALYSIS ... 38
4.1.WASTE ANALYSIS CLEANROOM ... 38
4.1.1. General remarks analysis ... 41
4.2.BOTTLENECK PROBLEM AREAS ... 42
4.2.2. Gathering information ... 45
4.2.3. Handling materials ... 46
4.2.4. Random sampling ... 47
4.2.5. Relocating ... 47
4.2.6. Other activities... 48
4.3.SUMMARY IMPROVEMENTS ... 48
5. SOLUTIONS ... 50
5.1.FROM COLLECTING INFORMATION TO INFORMATION AVAILABLE IMMEDIATELY ... 52
5.2.FROM HANDLING MATERIALS TO BEING SUPPLIED JUST IN TIME ... 53
5.3.FROM DOUBLE INSPECTION TO RESPONSIBILITY AND CERTIFICATION ... 54
5.4.FROM DRAG-AND-DROP TO AUTOMATED CONVEYER SYSTEM... 55
5.5.FROM PUSH TO PULL ... 55
5.6.SUMMARY RECOMMENDATIONS ... 57
5.7.RESULTS ... 58
6. CONCLUSION ... 61
7. DISCUSSION ... 63
7.1.LIMITATIONS... 63
7.2.FUTURE RESEARCH ... 63
REFERENCES ... 65
APPENDIX... 67
APPENDIX 1:FLOWCHART DURR ... 67
APPENDIX 2:FLOWCHART PILLER ... 68
APPENDIX 3:FLOWCHART MTM ... 69
APPENDIX 4:FLOWCHART TEM... 70
APPENDIX 5:FLOWCHART CLEAN ROOM ... 71
APPENDIX 6:FLOWCHART DRENT PICKLE BATHS ... 72
APPENDIX 7:FLOW PATHS WITHIN THE FACTORY ... 73
Appendix 7.1: Flow paths within the factory 1/4 ... 73
Appendix 7.2: Flow paths within the factory 2/4 ... 74
Appendix 7.3: Flow paths within the factory 3/4 ... 75
Appendix 7.4: Flow paths within the factory 4/4 ... 76
APPENDIX 8:VALUE INFORMATION FORM ... 77
APPENDIX 9:GENERAL REMARKS OBSERVATION PERIOD CLEANROOM ... 79
APPENDIX 10:RANDOM SAMPLE RESEARCH FORM ... 81
APPENDIX 11:CONCEPT IMPROVEMENT PLAN PRESENTATION ... 82
1. Introduction
Brinks Metaalbewerking is a Dutch company, located in Vriezenveen, which employs around 125 employees with a yearly turnover of approximately €17.000.000,-. Brinks Metaalbewerking mainly produces valve units for divers applications in the automotive and agricultural industry. Brinks states that her core business is Computer Numerical Control (CNC) producing products in large scale (1000 – 100.000 pieces/year). These parts are produced very accurately and precisely (tolerances up to 0,003mm). Furthermore the parts need to be clean and absolutely burr free. Brinks uses waterjet- and thermal deburring to assure high quality. Section 1.1. describes the products and markets of Brinks. Section 1.2. elaborates on the way those products are produced. Section 1.3. describes the problem situation and the motive for this research. The way this problem is handled is described in the methodology, Section 1.4..
1.1. Product and Market
Brinks Metaalbewerking produces several products for the automotive, agricultural, machine building and renewable energy market. These products are complicated to produce and require high-tech CNC machining to be manufactured. Brinks states that handling with extreme complexity and small tolerances can be seen as one of their core competences. That is why companies choose Brinks instead of producing the products their selves or elsewhere. Brinks claims that technology and knowledge are two of their unique selling points. There are products which Brinks produced for many years which are nowadays produced by foreign countries with lower wages, like Poland or China. That is why it is key to keep investing in new technologies and knowledge. That way, Brinks can keep the competitive advantage and to deliver the quality, knowledge and counseling the customers expect
Figure removed for competitive considerations
Figure 1: Products of Brinks with percentage of sales in 2014.
Figure 1 shows the three categories of products which Brinks produces: valve units and hydraulic engine parts, hydraulic cylinders, and detachable towing bars. The biggest category is the valve unit and hydraulic engine parts category, this is one of the specialties of Brinks. A valve unit functions as a dividing point for hydraulic fluid, water or air. This fluid can be used for opening and closing convertible tops from cars or to compensate body roll by pumping hydraulic fluid in shock absorbers during high speed cornering. In the agricultural industry these valve units are used for the controlling of several hydraulic devices like lifters, pumps and cutters. The second category products are hydraulic cylinders, these products require different machining steps on different machines. Brinks sees the demand decreasing, probably because other factories are also capable of producing these products. The third category is the detachable tow bar category. Brinks produces these products for high-class cars like ***.
hydraulic cylinders for hydraulic convertible top systems. Both these markets are highly sensitive for economic fluctuations and they are demanding in terms of quality of the products. The customers of Brinks offer their products to the following smaller submarkets: construction, transport, agriculture, shipbuilding, windmill, solar energy and mobile home. In general, the quality demands for the different products are about the same. However, a small amount of customers ask for extra cleanness tests or are performing these tests themselves. This is more product specific rather than customer specific. The demand of different products fluctuates throughout the year. These fluctuations depend on the type of product rather than the customer. To moderate the fluctuations, Brinks has made arrangements with loyal customers about stock which can be produced with the guarantee that the stock will be purchased. Also, Vendor Management Inventory arrangements are made with three of the largest customers which cover about 25 percent of the total sales. In these cases Brinks produces stock and transports this stock to the customer, however the stock remains on the balance sheet of Brinks until the customer takes the product out of its own warehouses and uses it for production. These arrangements include both a minimum and maximum quantity of stock which needs to be available in the customers’ warehouse. Although Brinks has customers worldwide, most customers are located in the Netherlands, Germany, Switzerland and Spain. Around 75 percent of the total production is going abroad.
Figure removed for competitive considerations
Figure 2: Sales and EBIT, based on consolidated financial information.
********************************************************************************** ********************************************************************************** ********************************************************************************** ********************************************************************************** ********************************************************************************** ******************************************************************************
1.2. Production Processes
This section describes the several production process at Brinks with the help of figures. The machining departments operate in a 24/7 schedule, the deburring and packaging happens in two shifts. Brinks produces both Just In Time and Made to Stock, depending on the type of product and the annual demand. Arrangements are made with customers about the maximum quantity the customers guarantee to purchase. In the past the delivery performance of Brinks has been low, therefore they produce to stock. Brinks also chooses for this because of the demand fluctuations. In times of low demand, they produce to stock to keep a steady production output. If demand is going up, Brinks first sells the stock. All machining steps are kept in-house. Only highly specialized processes like electro galvanizing and anodizing are done by external parties. Figure 3 shows the lay-out of the factory.
Figure removed for competitive considerations
For manufacturing the high tech products Brinks uses extensive machinery. This machinery includes lathes, milling machines, honing machines, lapping machines, cleansing machines, a waterjet deburring machine and thermal deburring machines. The lathes and milling machines are located in different production halls in the factory, clustered in production groups. Brinks uses several different types of milling machines, ranging from single spindle machines to four spindle machines. The type of milling machine which is used depends mainly on the type of product and the batch size. The lapping and honing machines are located in a smaller climate controlled production hall. In this climate controlled area Brinks can produce pieces with a tolerance of 0,003 millimeter. This will only be done if the customer needs this kind of small tolerances.
The deburring machines are located in the production facility called group 10. In this group the machined products are being cleansed and deburred. Deburring can be done with water under high pressure or with the thermal deburring machine, which burns the burrs from the work piece with an instant explosion. This thermal deburring is also an important competence of Brinks. After deburring and cleaning the product, it will undergo a last visual inspection. Hereafter, the product will be packed customer specific in the cleanroom. This room is slightly pressurized, which keeps dust or other dirt from entering the room. Appendix 7 till 10 show the most common paths within the factory. Figure 4 shows the most utilized departments in terms of ´´sales gone through´´. The departments are ranged based on number of products expressed in terms of sales which has passed the department. These data is gathered based on 489 different types of products sold in 2014. For each product the processing steps, from raw material to expedition, are indentified. The amounts sold and the selling price combined formed the amount of sales. With these data a database is formed. Figure 4 is composed based on the database.
Figure removed for competitive considerations Figure 4: Heat vision map Brinks.
forecasts and specific customer orders. The planned production date is based on the machining time and a safety net is calculated for processes done by external suppliers. The required cleansing, deburring, honing and lapping is not taken into account by the planning department. These process steps are controlled by a priority list, which is present at Group 10 and Group 7. This list is automatically composed by the Enterprise Resource Planning (ERP) system and the priorities are based among other things on the due dates of expedition. In theory, the operator picks the next order based on the list. However, the operator also chooses based on WIP at other machines in the group. He wants to make sure that the following workstation has enough work and he keeps track of the previous steps to know which workload he can aspect. The machines in Group 7 are controlled the same way as in Group 10.
1.3. Problem situation
As can be observed at the factory floor of Brinks there is a lot of WIP. At many places in the factory there are pallets stored with products which need another or multiple processing steps before being finished. These stored pallets can hinder the overview in the factory. Figure 5 shows the WIP in the factory. The red, solid crosses are places where WIP is stored for longer time. The bold edged crosses are WIP which is being processed the same day. The size of the cross indicates the amount of value in the particular department. In front of Group 10, there is the highest concentration work in process. The large solid red cross next to Group 10 is also WIP which is waiting to be processed by Group 10. The WIP in the machines groups are the bold edged crosses, they are relatively low compared to the WIP waiting for Group 10. This is because the WIP which is processed by the machining departments is brought almost directly to the WIP storage in front of Group 10. Within the machining groups there is not a lot of WIP, because the raw material is sawed on demand of the machining groups and therefore there is no excessive WIP created by the sawing department.
Figure removed for competitive considerations Figure 5: WIP hotspots
1.3.1. Defects per Unit
The rejection rate of a product or product line is the number of products which are rejected divided by the number of products which are totally processed times 100, also called Defects Per Unit (DPU) (Slack et al, 2007, p. 567). At Brinks, the rejection rates depend on the type of product, because every product has its own specific machining steps. In Figure 6 the average rejection rate of the whole plant from the time period 2010-2014 is shown.
Figure removed for competitive considerations
Figure 6: DPU 2010-2014, based on data from Microsoft Navision ERP system.
1.3.2. Delivery Performance
The delivery performance of a product is the percentage of how many orders delivered on time compared to the total orders delivered (Slack, Chambers, Johnston; 2007). Measurements for the delivery performance are according to Stewart (1995): request date and delivery-to-commit date. Figure 7 shows the delivery performance, based on delivery-to-delivery-to-commit date, from 2010 till 2014, based on data from the ERP system of Brinks which registers all shipments and link them with the requested and confirmed delivery date. The delivery performance in Figure 7 is based on the confirmed delivery date. This date is communicated with the customer by the planning department.
Figure removed for competitive considerations
Figure 7: Delivery Performance 2010-2014, based on data from Microsoft Navision ERP system.
Figure 7 shows that the delivery performance also fluctuates with considerable margins. Average dependability in 2014 was ***, that means *** of all production orders were late. The increase of delivery performance around June 2012 is because Brinks began to produce Make to Stock at that moment. Hence, more orders are delivered directly from stock, instead of being produced to order. This way, the risk of having an error in the production system which could cause a delay became less. As a result, the delivery performance increased substantially.
Figure removed for competitive considerations
Figure 8: Delivery Performance Top 5 customers 2010 -2014
Figure 8 shows the delivery performance of the five largest customers of Brinks, based on annual sales. There is a large difference between the best delivered customer in 2014 *** and the worst *** This difference already exist in 2010, *** had a delivery performance of *** and *** only ***. It seems that the delivery performance of the top 5 customers has increased, except for ***This indicates that the delivery performance can depend on the type of customer and product.
Table removed for competitive considerations
Table 1: Delivery Performance and percentage of sales 2014 of specific department
1.3.3. Throughput Time
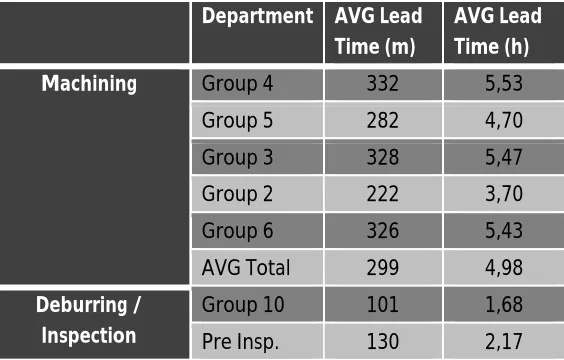
Throughput time is the duration which one product needs to move through the factory (Slack et al., 2007). In this case the throughput time is the time elapsed from cutting the raw material till the moment the order is shipped at expedition. The throughput time at Brinks is retrieved from the ERP system. At every process step, a barcode on the work ticket is scanned, the ERP system tracks all these recordings. Like this, the duration of each process is recorded and throughput time can be calculated by adding up the processing times. The average throughput time in 2014 was 95 hours, considering products which go through internal processes only, the go-through-rate of sales of products going through external processes is only 8%. Based on the delivery performance and the amount of work in process, the following groups may slow down the process: Group 10, Sawing and Pre Inspection. Therefore, the throughput times are expected to be higher if an order needs to go through these three departments. Table 2 shows the average throughput time of the whole process if the order goes through a specific department. Table 2 is based on data of 2014 which contains 8891 orders subjected to in-house production processes.
Table 2: Average Throughput Time 2014
[image:14.595.72.354.481.661.2]Table removed for competitive considerations
Table 2 shows that the throughput time is 50% less if an order does not go through Group 10. If an order goes through sawing department this is 35% and for Pre Inspection 28%. This difference is substantial but can explained based on the lead times of the processes. Hence, a relative long lead time results in a relative long throughput time. The lead time is the time elapsed from the start till the end of process. Hence, the lead time is an important indicator to judge the throughput times and therefore the lead times of different processing steps are gathered.
Table 3: Lead Times of process steps.
Department AVG Lead Time (m)
AVG Lead Time (h)
Machining Group 4 332 5,53
Group 5 282 4,70
Group 3 328 5,47
Group 2 222 3,70
Group 6 326 5,43
AVG Total 299 4,98
Deburring / Inspection
Group 10 101 1,68
Pre Insp. 130 2,17
gone through Group 10 (see Table 2) is not justified. Because the lead time within Group 10 has an average of 1,68 hours and the average lead time in the machining departments is almost 5 hours. Hence, the extensive throughput times for orders which go through Group 10 cannot be explained by the lead time.
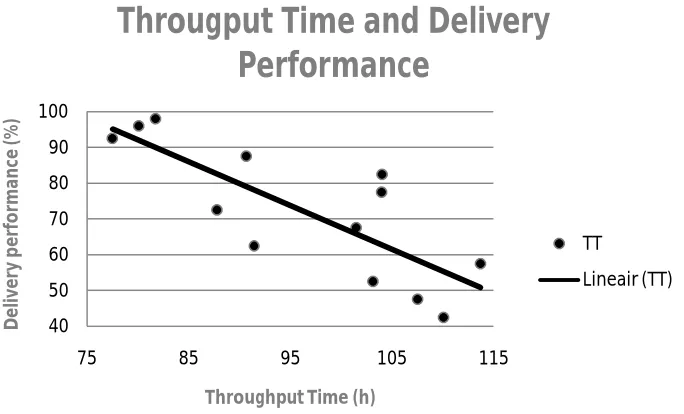
1.3.4. Link between Throughput Time and Delivery Performance.
[image:15.595.84.426.330.537.2]In the previous section the link between a high throughput time and Group 10 is shown and in Section 1.3.2. the indication is shown that delivery performance for products which go through Group 10 is lower than for products which do not go through Group 10. In this section the link between the throughput time and delivery performance is shown. The data on throughput time and delivery performance is based on the same 8891 orders produced as Table 2. The diagram indicates that orders with a low delivery performance have high throughput times. Orders with a high delivery performance tend to have an low average throughput time. Therefore, a high throughput time can be related to low delivery performance. Figure 9 indicates a relation between delivery performance and throughput time at Brinks. According to the figure the delivery performance decreases if the throughput times increases.
Figure 9: Throughput time and Delivery Performance.
1.3.5. Problem Statement
In the previous sections the following problems become clear: overall delivery performance is low, Brinks is not making a profit, there is excessive WIP on the work floor and rejection rates of products fluctuates. The previous sections indicate that the delivery performance and work in process are linked and that orders with low delivery performance also cope with long throughput times. Therefore the scope of the research will be on the delivery performance, WIP and throughput times. To maintain a clear overview of the research and because the fluctuations can be explained by the frequency of data input, the rejection rate is left out the research scope. The previous sections show that Group 10 is the most utilized department containing the most WIP. There is link found between Group 10 and the low delivery performance. Previous research also indicates a link between low delivery performance and long throughput times. The management of Brinks suspects Group 10 as the bottleneck in the factory, this suspicion seems to be the case based on the info in previous
40 50 60 70 80 90 100
75 85 95 105 115
D el iv e ry p e rf o rm an ce (% )
Throughput Time (h)
Througput Time and Delivery
Performance
TT
sections. Therefore, the focus of this research will be on Group 10 and the following problem statement is formulated:
‘’Brinks copes with excessive work in process, low delivery performance and high throughput times which can be related to one production group, Group 10.’’
In order to structure this research, the following research question is formulated:
‘’How can the current production process of Group 10 be improved to decrease WIP and Throughput Times and increase the Delivery Performance?‘’
In order to answer the research question and structure the research, four sub questions are formed: 1) ‘’How are Work In Process, Throughput Times and Delivery Performance related at Brinks?’’ 2) ‘’What are the current reasons for the high level of Work In Process and relatively long Lead
Times of Group 10?’’
3) ‘’What can be done to reduce the Work In Process and Throughput Times?’’
4) ‘’How can the suggested improvements be implemented in the organisation of Brinks?’´
1.4. Methodology
To answer the questions formulated in Section 1.3.3. scientific research is done. The way data is gathered is described in Section 1.4.1. The methods for answering the research questions formulated in Section 1.3.4. are described in Section 1.4.2..
1.4.1. Data gathering
The research uses several methods for gathering information and data; observations, data analysis, qualitative interviews and a literature study. The research will focus on Group 10, as described in Section 1.3. There are three types of sources for information: data from observations, the ERP system and knowledge from the employees. Observations are done on the work floor of Group 10, all handlings are recorded and cycle times are measured. To gather valid data, the observations and timing is done on multiple products in both shifts. For the data analysis, data from the ERP system is analysed. This system contains valuable data on delivery performance, cycle times, throughput times, work in process, process paths and the machining steps. The interviews are held with operators, inspectors, managers, planners and logistics. These informal interviews will take place on the work floor, to obtain valuable information on the production processes. This way, information is gained on the reasons and motivations of (managerial) choices on the work floor. To gather the necessary theoretical background to reflect the findings of the qualitative research, scientific literature is studied.
1.4.2. Methodology
In this section the methods used to analyse the problem are discussed.
chief expedition to gain more insight in the reasons for late deliveries and how this can be related to the excessive WIP and therefore high Throughput Times.
The second research question; ‘’What are the current reasons for the high level of WIP and relatively long Lead Times of Group 10?’’ is answered by finding the cause of the WIP at Brinks. The first step is to visualize and measure the production path in Group 10. Therefore, bottleneck indication methods are used, which are further describer in Section 2.2.. These bottleneck indication methods are applied on the production paths of products with a low delivery performance and relative high contribution to the turnover. The to be observed products are chosen based on a delivery performance below or equal to 75% combined with a contribution to turnover of more than €100,000.-, this selection came up with ten products. The following measurements are done on each machine/process for different types of products: up-time en physical amount of WIP in front of the machine. Furthermore the cycle times and lead times of the processing steps in the production path are measured using a stopwatch during the observations. With these measurements it is possible to point out the bottleneck in the organisation. Interviewing is the second method to find the cause for the WIP at Brinks. Interviews are held with the line production manager. With the help of that interview earlier insights can be checked and further information can be gained.
The third research question; ‘’What can be done to reduce the WIP and Throughput Times’’ can be answered by indicating how the capacity of the bottleneck can improved. The bottleneck is indicated in the previous sub research question and turns out to be the Cleanroom, where products are inspected and packaged. Increasing the capacity of the Cleanroom will lead towards a decrease in WIP and Throughput Times. To improve the capacity of the Cleanroom, without increasing costs considerably, a flow of activities, based on the Value Stream Map (Slack, 2007) principle, is constructed to identify the non-value adding movements. VSM is a tool to understand where waste is present in a process, specified for a single product or product family. In the areas where the non-value added movements take place there is the possibility to improve the capacity. The non-value stream map is based on observing the Cleanroom for three weeks. All activities done by employees in the Cleanroom are recorded and timed with help of a stopwatch during the observations, to reveal the non-value added activities performed by the Cleanroom staff.
2. Theoretical Background
In the following chapter the theoretical background is formed. Section 2.1. will focus on Little’s Law and its applications in production processes. Little’s Law describes the relation between WIP, cycle time and the throughput. Section 2.2. focuses on the theory of constraints, this theory describes techniques to find the bottleneck of an organisation. The third section, 2.3., focuses on the link between work in process and delivery performance. In Section 2.4. production techniques based on lean manufacturing philosophy are described. Section 2.5. describes methods to construct a value stream map.
2.1. Little’s Law
Little’s law is a mathematical relationship in queuing systems. It describes the relationship between the average number of items in the queuing system, average waiting time in the system for an item and the average number of items arriving per unit time (Little, 1961). The following relation is stated: L = λ * W
L: Average number of items in the queuing system λ: Average number of items arriving per unit time W: Average waiting time in the system for an item
Little’s law is often used in operations management. For its use in operations management the variables are named different. The underlying reasoning is the same, since a production process has great similarities to a queuing system. The derived version of Little’s Law used in operations management is the mathematical relationship between throughput time, work in process and cycle time (Slack et al., 2007). The formula is formulated as follows:
Throughput Time = Work in Process * Cycle Time
Throughput Time; the time elapsed for a unit to move through a process
Work In Process; the number of units within a process waiting to be processed further
[image:18.595.80.573.560.603.2]Cycle Time; the average time between units of output emerging from a process, also lead time First the creation of WIP is shown in Figure 11 and further explained.
Figure 11: WIP and Inventory represented schematically
Little’s Law indicates that when WIP is increasing, the throughput time increases. When the CT increases, the throughput time increases as well. To decrease the throughput time, it is necessary to decrease the amount of WIP and/or the cycle time of the processing step. This law can be used in production processes in which one of the variables is difficult or time consuming to measure. Often two out of three variables can be measured or obtained easily, using the equation the missing variable can be calculated.
Little’s law can be helpful for many departments of an organisation, for example for the planning department. According to Slack (2007), in operations management the output of a process is one of the key items. By using Little’s Law the throughput time, representing the output of a process, can be calculated easily, which gives insight in the total time needed to produce a product. Based on this calculation the delivery dates can be promised to customers and the production capacity can be evaluated. The equation can be used for an entire production process from raw material till expedition but also for single production steps.
2.2. Theory of Constraints
The theory of constraints (TOC) is a management philosophy introduced by Eliyahu Goldratt in 1984. The goal of TOC is to reach the ultimate goal of a production organisation. According to Goldratt and Cox (1986) the goal of every commercial organisation is to make profit in the present as well as in the future. This goal is interdependent to some variables like: motivated employees, innovativeness, cash flows, return on investment and competitive advantage. To judge the day-to-day impact of the production process Goldratt and Cox (1986) mention the following three measurements:
Operational Expense Throughput
Inventory
Operational expense is the investment needed to turn raw material (inventory) into throughput (finished products). The throughput consist of the finished products that generate the sales. Inventory is the investment made in products which have the intention to be sold. Hence, the goal of the organisation (making profit in the present as well as in the future) can be reached by the more hands on goal: Increasing throughput while simultaneously reducing both inventory and operating expense. This statement can be used to compare the decisions made on the work floor with the goal of the organisation.
Constraints are issues which keep the organisation from achieving the goal. According to Goldratt and Cox (1986) organisations are networks of process steps which are dependent of each other. Each process event succeeds the previous event. Events could be machining steps, but also administrative processes like releases. Goldratt and Cox (1986) suggest the events in a process can be seen as a chain. In every chain one link is the weakest, this is the constraint. After strengthening the weakest link, another link in the chain will be the weakest. In Figure 11 (Section 2.1.), the constraint is Stage 2, based on the cycle time of the stages. Stage 2 slows the whole process down. If the cycle time in Stage 2 is brought down to 1 minute. The weakest link is not Stage 2 anymore, the next weakest link is than Stage 3. Therefore, solving the constraint relocates the weakest link the process.
1. Identify the constraint
2. Determine the most effective means to exploit it 3. Subordinate everything else to the above decision 4. Elevate the constraint
5. If in the previous a constraint is broken, start over. But beware of “inertia”
The first step is to identify the constraint within the process. The constraint is the event in the process which determines the performance of the whole system, the weakest link (bottleneck). The constraint slows the whole process down, usually in a production process this is the machine with the longest cycle time. To find the bottleneck the production process has to be observed. The second step is to determine the most effective means to exploit the constraint. Exploitation of the constraint seeks to achieve the highest rate of throughput possible using the current resources of the organisation. TOC strives for utilizing the current resources more efficient instead of simply adding more capacity, because this would increase the operational expenses. The third step is to subordinate the other process steps, this is because the constraint determines the performance of the whole process. This way, waste due to improving other processes is avoided. The organisation only works on that which it can expect to turn into cash through sales in the near future. The fourth step is to elevate the capacity of the constraint to elevate the throughput of the whole line. This is only done if step 2 and 3 did not increase the capacity of constraint such that the constraint is broken. Elevating the capacity can be done by adding shifts, outsourcing work or investing in new machines. At the fifth step the constraint is broken and the process starts over, to improve the system continuously. While following the five steps, inertia as a constraint has to be avoided.
There are three types of constraints according to Watson, Blackstone & Gardiner (2006): Physical
Market Policy
Physical constraints are bottlenecks based on the capacity of the resource. The capacity of the resource is less than the demand. In this case the capacity of the bottleneck needs to be improved to deliver to customers demand. The second form of constraints are the market constraints, in this case the demand from the market is lower than the capacity of the resource. The third form of constraints are policy constraints. Policy constraints are policies which limit the production capacity due to policy, like regulation or the mindset of operators (‘’we have always done it this way’’).
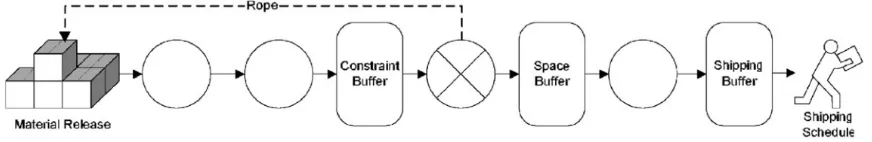
principle is shown in Figure 12, in which the circles show production processes. The crossed circle is the bottleneck and therefore the drum, which determines the pace of the production.
Figure 12: Drum Buffer Rope (Watson et al., 2006, pg 362).
Bottleneck knows multiple definitions, Lawrence and Buss (1995) mention the following different definitions for a bottleneck:
Congestion points occur in product flowing
The resource whose capacity is less than the demands placed upon it A process that limits throughput; Temporary blockades to increased output A facility or operator that impedes production
Any operation that limits output
These definitions are roughly the same, they all indicate that there is one event which slows down the process. In the overview written by Whang, Zhao & Zeng (2005) several bottleneck indication methods are described. The most common methods are:
Measuring average waiting time / queue length Measuring average workload
Measuring average cycle times
Bottleneck indication based on average waiting time or the length of queues are based on little’s law, which is discussed in Section 2.1.. The machine with the longest queue or the highest waiting time is considered the bottleneck. Applying bottleneck indication based on the average workload needs measurements of the average workload (up-time) of a machine. The machine with the highest average workload is considered the bottleneck. The third method is bottleneck indication based on the average cycle time. The machine with the highest cycle time is considered the bottleneck. TOC does not give a direction in which the bottlenecks can be solved, besides the indication that the production capacity of the constraining event needs to be increased. Increasing the performance of an event with the current resources can be done by reducing waste in the process or to radically change the way of working, called Kaikaku (Bhasin & Burcher, 2006).
2.3. Link Work in Process and Delivery Performance
that delivery performance can be improved by reducing the lead time of an order. Based on the research of Stewart (1995) the following variables influences the delivery performance of a delivery: Lead Time, reliability (machine/human errors causing delays), frequency of output and location of depots/machines (physical location of machines). Reducing lead time is a possibility to improve the delivery performance, doing so the planning can be done with a shorter forecasts and other problems can be prevented, such as lost orders or orders which need rework or repairs due to storage (Elfving, Tommelein & Ballard, 2002). Reliability of the production process also influences the delivery performance, break downs of machines can cause delays of orders. Frequency of output is also determining for delivery performance, large batches can mean a low output frequency, which can delay an order.
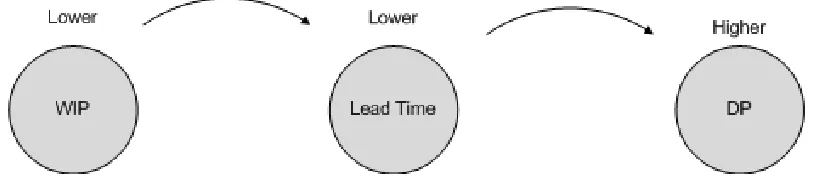
[image:22.595.79.490.370.466.2]Considering Little’s Law, throughput can be increased if WIP decreases. Larger lead times lead directly to proportionally larger WIP, as an elementary application of Little's law shows. Hence, the amount of WIP is directly linked with lead time. Long lead times increase the need for long term planning. Also, long lead times are accompanied by more uncertainties, which makes planning harder with are higher change of errors (Karmarkar, 1987). Acknowledging the fact that Stewart (1995) confirmed that delivery performance can be improved by reducing lead time, WIP and delivery performance are linked to each other through lead time. The connection is schematically shown in Figure 13.
Figure 13: Link between WIP and delivery performance
Based on Section 1.3.3. there is an indication that at Brinks the link between lead times and delivery performance is also present. Considering Little’s Law, there should be a relation between the WIP and the delivery performance at Brinks.
2.4. Lean manufacturing
Over-production. Producing more than is immediately needed by the next process in the operation is the greatest source of waste according to Toyota.
Waiting time. Equipment efficiency and labour efficiency are two popular measures which are widely used to measure equipment and labour waiting time, respectively. Less obvious is the amount of waiting time of items, disguised by operates who are kept busy producing WIP which is not needed at the time.
Transport. Moving items around the operation, together with the double and triple handling of WIP, does not add value. Layout changes which bring processes closer together, improvements in transport methods and workplace organisation can all reduce waste. Process. The process itself may be a source of waste. Some operations may exist only
because of poor component design or poor maintenance and so could be eliminated.
Inventory. All inventory should become a target for elimination. However, it is only by tackling the causes of inventory that it can be reduced.
Motion. An operator may look busy but sometimes no value is being added by the work. Simplification of work is a rich source of reduction in the waste of motion.
Defectives. Quality waste is often very significant in operations. Total costs of quality are much greater than has traditionally been considered and it is therefore more important to attack the causes of such costs.
To achieve reduction of waste, Lean developed several techniques which can be implemented in the production process. There are several lean techniques with their own field of application, but all techniques have the same goal; reducing waste. Bhasin and Burcher (2005) mention the following lean techniques:
Kaizen: Kaizen is Japanese for continue improvement. In a lean organisation it is important to continue pursue improvement of quality, costs, delivery and design to reduce waste. This improvement is done at every level in the factory, both managerial and on the work floor (Slack et al., 2007). ‘’Kaizen epitomizes the mobilization of the workforce, providing the main channel for employees to contribute to their company’s development.’’ (Brunet & New, 2003, pg 1427)
Cellular manufacturing: Manufacturing cellular instead of in lines helps reducing waste like transportation, waiting and process time. Cellular manufacturing usually works best in U-shapes. According to the research of Miltenburg (2000) lead time, WIP and defects are decreasing using u-shaped manufacturing cells.
Kanban: In a Kanban controlled system, ‘’a stage is authorized to start working on a new part only when a production authorization card, called Kanban in Japanese, is available. A Kanban becomes available only when a finished part of the stage is transferred to the next or downstream stage. When a Kanban becomes available, it both transmits a demand for and authorizes the production of a new part. The advantage of this mechanism is that the number of parts in every stage is limited by the number of Kanbans of that stage. Its disadvantage is that the system may not respond instantly to demand.’’ (Dallery & Liberopoulos, 2000, pg 370)
Single Minute Exchange of Dies (SMED): To reduce the lead-time and improve flow it is necessary to eliminate delays on change over times on machines (Slack et al., 2007, pg 477). SMED is a four-step method for reducing these set-up times.
5 S model: Sort, Straighten, Shine, Standardize and Sustain. Sort: eliminate what is not needed and keep what is needed. Straighten: position things in such a way that they can be easily reached whenever they are needed. Shine; keep things clean and tidy; no refuse or dirt in the work area. Standardize: maintain cleanliness and order- perpetual neatness. Sustain: develop a commitment and pride in keeping to standards (Slack et al, 2007, pg 470).
Jidoka: Jidoka is a quality control method, in which every employee has the authority to stop the production line if the employee thinks it is necessary. Situations where Jidoka is used can be: a quality problem occurs; a machine problem occurs or processing is completed. (Miltenburg, 2007)
2.5. Value Stream Mapping.
Value stream mapping is a method to understand and visualize the flow of information and products within a process (Slack, 2007). In a Value Stream Map (VSM) the distinction between value adding (VA) processes and non-value adding (NVA) processes is made. With help of the VSM waste can be recognized, NVA processes can be seen as waste. The value stream map shows the amount of time spend VA and NVA and the areas were this occurs. Identifying the areas were NVA work is conducted is helpful in improving the efficiency in these areas. Value stream mapping consist of four steps:
1) Identifying the value stream within the process 2) Physically map the process
3) Diagnosing problems and suggest changes 4) Implement the changes
First two steps form the ‘’Current State Map’’, the current state map described the current situation. In the current state map all process steps are visible, including the supporting documents or services. In the current state map the distinction between VA and NVA can be made visible. Step three is the ‘’Future State Map’’, the purpose of this map is eliminate the NVA process steps of the current state map.
Creating the current state map can be done with the help of seven different tools according to Hines and Rich (1997), they state that a combination of tools is the best way to construct a value stream map. The following tools are explained by Hines and Rich (1997):
Process activity mapping: has its origins in industrial engineering and focuses on removing waste on the workplace and provide high quality goods and services easily and inexpensive. The five stages of process activity mapping are
1) The study of the flow of processes 2) The identification of waste
3) A consideration of whether the process can be rearranged in a more efficient sequence 4) A consideration of a better flow pattern, involving different flow layout or transport routing 5) A consideration of whether everything that is being done at each stage is really necessary
Supply chain response matrix: has its origins in the time compression and logistics. This mapping approach seeks to portray in a simple diagram the critical lead-time constraints for a particular process. The supply chain response matrix is often used for logistic processes and lead time management.
Production variety funnel: This method is based on the degree of product variation of organisation. The method is similar to the IVAT model. The IVAT model classifies types of organisations based on the product variety. I-shaped organisations focuses on producing multiple identical items with a low variety in raw materials, such as a chemical plant. V-shaped organisations have low variety in raw material combined with a high variety of products produced. This is a typical shape for metal fabrication organisations. A-shaped organisations is the contrary of the V-shaped organisations, they have a high variety in raw material and only a couple different products. This is typical for major assembly plants, for instance an aircraft manufacturer. T-plants have a wide combination of products from a restricted number of components made into semi-processed parts held ready for a wide range of final versions. This is typical in electronics and household appliance industries. With the help of these classifications the way how the firm works and the way the supply chain operates is made visible. This approach can be helpful in deciding in which part of the process inventory should be reduced to be most effective.
Quality filter mapping: This method is focused on the quality issues within a multi-tier supply chain. Quality filter mapping operates with three variables; product defects, service defect and internal scrap. Product defects are quality issues which are not intercepted during the production process or at the end-of-line inspections and therefore are passed on to the customer. Service defects are defects which are not directly linked to the goods themselves, for instance late deliveries or deliveries with the wrong documentation. Internal scrap are faulty products produced and are noted during the production process or at the end-of-line inspection. Using the quality filter mapping method these defects are recorded and mapped along the supply chain. With the help of this map areas with defects can be identified, these areas can be used for improvement activities.
Demand amplification mapping: This method focuses on information and material flow within production processes and is based on the ‘’law of industrial dynamics’’; ‘’if demand is transmitted along a series of inventories using stock control ordering, then the amplification of demand variation will increase with each transfer’’(Burbidge, 1984). This results often in excess inventory, production, labour and capacity, which are all types of waste. Using the demand amplification mapping method, which sets out the actual demand and the orders placed, the ordering system can be improved. For instance by splitting up orders in necessary basic orders and exceptional orders.
Decision point analysis: This method is of particular use for T-shaped plants (see production variety funnel method). This method focuses on the decision point at which goods are produced. Gaining an understanding of where this decision point lies is useful to determine the strategy (push or pull), also several ‘’what if’’ scenarios can be designed to improve the design of the value stream itself.
3. Bottleneck Identification
This chapter describes the analysis of the deburring, cleansing and packaging department of Brinks, called Group 10. In Section 3.2. the production processes in Group 10 are described. The chapter starts in Section 3.1. by explaining the issues described in Chapter 1 using the theoretical background formed at Chapter 2.
3.1. Analysis using the theoretical background
To explain the issues of Group 10 found in Chapter 1, the excessive WIP, relative long throughput times and low delivery performance are described and explained using the theoretical concepts described in Chapter 2. WIP is generated by production process which is not balanced. In balanced production process the cycle times of the machines are equal. This creates a continuous flow of products through the production process. WIP is created in front of the machine with the lowest cycle time, called the bottleneck, this machine cannot process the amount of products supplied by the previous machine in the chain. The products waiting to be processed by the bottleneck are called WIP. Hence, WIP is created by a bottleneck in the production process. Long throughput times are related to the WIP in a production system. According to Little´s Law, the throughput time of production process is related to the amount of WIP. The throughput time is the time elapsed for a product to move through the process. If WIP is absent, the throughput time is equal to the cycle times added with time for transport between the workstations. With the presence of WIP, the throughput time is the cycle time added to the transport time and the time in which the product is waiting to be processed further. Hence, if WIP increases the throughput times increases. The delivery performance is also related to the throughput time. A decrease in the throughput time is likely to cause an increase in the delivery performance. Hence, the mentioned issues are all related to each other and can be solved by improving one variable. For instance, decreasing the WIP leads to a decrease in the throughput time which in its turn is likely to improve the delivery performance.
3.2. Production Process in Group 10
Group 10 is a production group which clusters several different machines and work stations for deburring, cleaning, inspecting and packaging of products. The group controller is the floor manager of the group. He determines in which order the production orders are handled. This order is based on an Enterprise Resource Planning System, which gives the production orders a certain priority. It is possible that multiple, usually around five or six, items have the same priority. In this case the operator chooses based on WIP in previous and following producing steps. He wants to make sure that the following workgroups have enough work and he keeps track of the previous steps to know which workload he can aspect. The following machines and work stations are present in group 10:
‘’Durr’’; this is a large degrease machine. This machine will degrease products which come from ‘’Group 7”, this is the honing and lapping group. In these processes they use a special kind of oil which is being removed by the Durr machine. If the product is being degreased it will be transported by conveyer belt to the cleanroom.
pallet. If the pallet is full, the operator takes the pallet out of the cage and now the pallet is being covered, packed and made ready for shipment.
‘’MTM’’; this is a cleansing machine. The products are loaded on the conveyer belt by hand or by crane, depending on the weight. The products are cleansed in the machine and then lead to a conveyer belt leading to the thermal deburring machines. At these conveyer belts the products are sorted based on the material type of the product, aluminum or steel. ‘’TEM’’; This is the thermal deburring machine. Brinks has two of these thermal deburring
machines. In this machine a product is being deburred by a short explosion under high pressure, all the burrs which are left after being cleansed are burned. To deburr the products they have to be packed on the TEM machine into molds or heavy duty round baskets. The type of mold depends on the type of product which needs to be deburred and needs to be changed if another type of product needs deburring. The TEM machine has five places were a mold with products can be placed, these five places are located on a rotating platform. The operator lets the platform turn and deburrs the products. If one product is ready, the product will be taken out of the TEM and put in a basket. Subsequently, a new product will be put back on the rotating platform to be deburred. If the basket with finished products is full, it will be send off into the Drent.
‘’Drent’’; the Drent contains two lineups of several pickle baths were the thermal deburred products will be dipped into anti-corrosion fluids and preservatives. The operator of the TEM machine will launch the baskets with products into the machine. A moving crane above the different baths picks up the basket and dips the basket in the bath. It depends on the type of product which baths the product will be dipped in, this selection is done by the operator of the TEM machine. The operator also chooses the exit conveyer belt for the basket. This depends on which type of inspection and packaging the product needs.
‘’Clean Room”; this is a work station which is under constant air pressure, to make sure no dirt or dust is coming in. In this room the products are undergoing a visual inspection and are packed. In the cleanroom there are eight conveyer belts, six of them have an inspection plateau. The products are being transported on the conveyer belts onto the inspection plateau, here the inspector visually inspects the products. After the inspection, the approved products are at random inspected by another inspector. The rejected products are tried to restore manually, if this succeeds, the products are brought back to the pickle baths. Because during the restoring the product can collect dust or pollution. If the repair work on the product fails, it will be stored at the final rejections and they are thrown away.
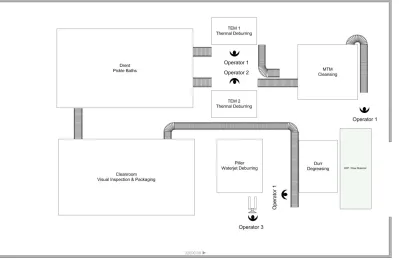
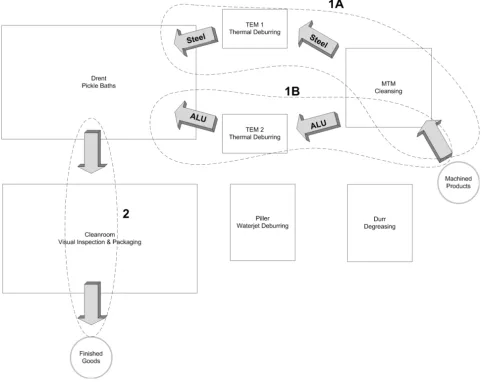
Figure 14: Different paths within Group 10.
[image:28.595.98.497.487.747.2]In Appendix 1 till 6 the specific flowcharts of the different activities within group 10 can be found. Figure 15, on the next page, shows the lay-out of group 10. The different processing steps are connected by conveyer belts. The conveyer belts take care of all the logistic handlings in group 10 once the product is through the first machine. Products that need deburring are delivered by forklift trucks from the other production groups in the factory. Figure 15 shows that there are three operators within the group, excluding the Cleanroom. The Cleanroom is staffed with three operators as well, who execute the visual inspection and packaging of products. Logistics deliver pallets with raw material, these products are taken out and placed into baskets. These baskets fit the MTM (cleansing machine) and the Drent (pickle baths). Each of these baskets need to be covered, otherwise the products fall out the baskets while being cleansed or pickled. The thermal deburring machines do not accept the baskets, here the products are taken out manually and placed in a product specific mold. After the thermal deburring step the products are packed in the baskets again to be pickled in the Drent. In the Cleanroom the products are taken out and the operators do a final visual inspection and package the products. The packed products are picked by the logistic department and moved to the central finished goods inventory.
3.3. Link between WIP and delivery performance at Brinks
The theoretical link between WIP and delivery performance is described in Section 1.4.2.. High level of WIP increases the throughput times which in its turn decreases the delivery performance. This link is visible at Brinks by the relation between high throughput times and the low delivery performance, as found in Section 1.3.4.. During the three-day observation in Group 10 several reasons for orders delivered late are revealed; a first reason is that not enough products pass the visual inspection, therefore another batch needs to be inspected to complete the order. Often this batch is already produced but needs to undergo the cleansing and deburring process of Group 10, sometimes the product needs to be produced completely from raw material at the milling machines. Another reason is that a start-up product was produced in the machining groups and afterwards stood still for a few weeks in front of Group 10. When being processed in Group 10, an issue with residues of burrs in the thermal deburring machine occurred. These residues had to be removed and the surface restored, for this process the project coordinator was counseled, because of the rework and the counseling the product was not shipped in time. These are two examples which came up during the observation, the expectation is that there are several other reasons. Because these reasons are not stored in the ERP system an interview is held with the chief of expedition to gain more insights in the reasons for late deliveries. The chief expedition is responsible for the on time delivery for every order and during the observation it showed that if a product is expected to be late he tracks down the product in the factory and asks for clarification. During the interview with the Chief Expedition it came up that he could not pinpoint a single cause for the low delivery performance, however he stated that the products are usual still being processed in production. Therefore the focus will be on reducing the WIP in the production process.
3.4. Current reasons for the WIP at Group 10
Table 4: Observation selection
Table removed for competitive considerations
Figure 16: Flow of the observed products in group 10.
To determine the bottleneck of the machines within group 10 three bottleneck indication methods are used, based on Whang, Zhao & Zeng (2005). These methods use their own measuring variables, which are shown in Table 5.
Table 5. Bottleneck indication methods
Bottleneck indication method: Variable:
1) Measuring cycle times Cycle Time
2) Measuring average queue length # Minutes WIP
3) Measuring average workload % Active Time
3.4.1. Cycle Times
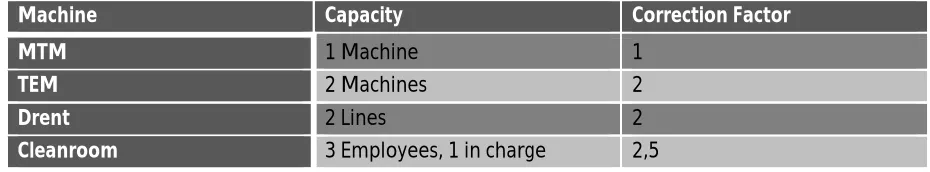
[image:32.595.62.527.456.542.2]The first bottleneck indication method is based on the individual cycle times of the workstations and machines in Group 10. The cycle times of ten products in the observation selection are measured being processed in Group 10. The cycle times are measured at the work floor with a stopwatch. The cycle time is the time elapsed to process one product. Products are often processed in baskets or molds, therefore the cycle time of the processed basket or mold is divided by the number of products in the basket or mold. The batch size varies from one per mold (TEM) till 80 per basket (MTM and Drent). The machine with the highest cycle time is considered to be the bottleneck. The cycle times of the machines and workstations which process the ten products from the observation selection are measured, these machines and workstations are; MTM, TEM (both), Drent (both lines) and the Cleanroom. A single order is processed by a single machine, even if there are multiple machines. For instance the TEM; Brinks has two TEM machines, but in practice there is no moment that both TEM machines process the same order or even the same type of product, see Figure 16. This also applies for the Drent. At the Cleanroom an order is handled by one employee, only a check based on a random sample is executed by a different Cleanroom employee. Although this indicates that the production is a linear process, group 10 handles multiple orders of different products with different flows (see Figure 16). Hence, the measured cycle times per product need to be corrected with the available to use the cycle times as comparison for the workstations. If these cycle times are not corrected this will imply that Group 10 is a linear production process, which is incorrect. Therefore, to get a clear overview of Group 10 the measured cycle times are corrected based on the capacity of each machine or workstation. The correction factors are shown in Table 6 and elaborated on in the subsection measurement methods below Table 6.
Table 6: Correction Factors for Cycle Times
Machine Capacity Correction Factor
MTM 1 Machine 1
TEM 2 Machines 2
Drent 2 Lines 2
Cleanroom 3 Employees, 1 in charge 2,5
Measurement methods:
0:00:00 0:00:04 0:00:09 0:00:13 0:00:17 0:00:22 0:00:26 0:00:30 0:00:35 0:00:39
MTM TEM Drent Cleanroom
C yc le T im e
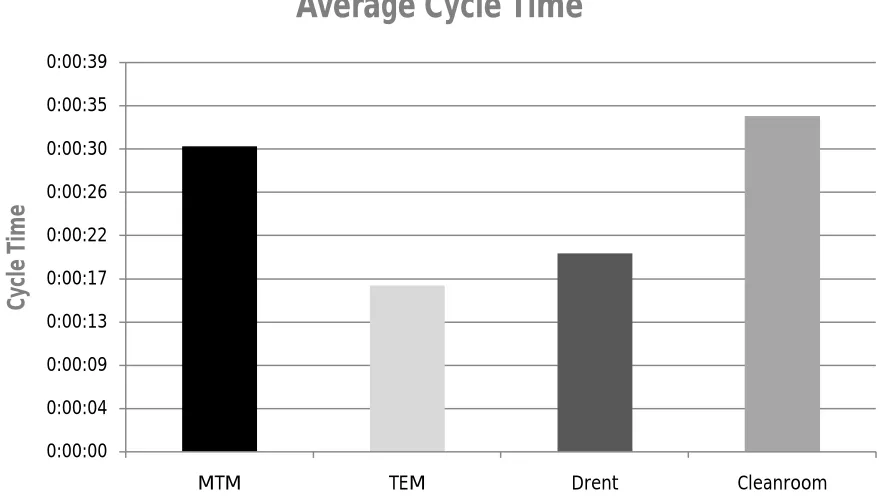
Average Cycle Time
[image:33.595.75.517.189.437.2]is no distinction in the tasks, every employee can work on the whole product range of Brinks. The only exception is the team leader, she executes visual inspections and rework but also takes random tests and divides work among the rest of the team. According to both team leaders they spent 50% of their time instructing, dividing work or taking random samples. Taking into account the team leader and the presence of three employees the correction factor for the Cleanroom is determined at 2,5. The results of the research on cycle times are shown in Figure 17.
Figure 17: Average Cycle Time per Product in Group 10.
Figure 17 indicates that the Cleanroom is the bottleneck based on the average cycle time of 34 seconds, the MTM machine is a close second with an average cycle time of 30 seconds per product. The TEM and Drent machines have lower cycle times of respectively 17 and 20 seconds. Therefore, based on the observation with use of the cycle time based bottleneck indication method, the Cleanroom is the bottleneck in the process.
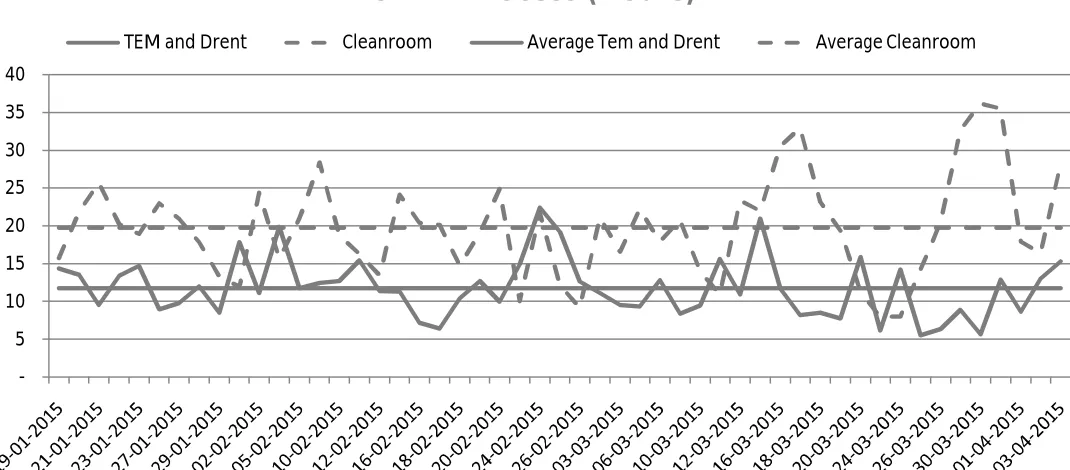
3.4.2. Average queue length