publisher policies. Please scroll down to view the document itself. Please refer to the repository record for this item and our policy information available from the repository home page for further information.
To see the final version of this paper please visit the publisher’s website. Access to the published version may require a subscription.
Author(s): Sabrina Simmons and Zachary Estes
Article Title: Individual differences in the perception of similarity and difference
Year of publication: 2008
Link to published version: http://dx.doi.org/ 10.1016/j.cognition.2008.07.003
In Press, Cognition
Individual differences in the perception of similarity and difference Sabrina Simmons & Zachary Estes
University of Warwick
Zachary Estes
Abstract
Thematically related concepts like coffee & milk are judged to be more similar than
thematically unrelated concepts like coffee & lemonade. We investigated whether thematic relations exert a small effect that occurs consistently across participants (i.e., a generalized model), or a large effect that occurs inconsistently across participants (i.e., an individualized model). We also examined whether difference judgments mirrored similarity or whether these judgments were, in fact, non-inverse. Five studies demonstrated the necessity of an
individualized model for both perceived similarity and difference, and additionally provided evidence that thematic relations affect similarity more than difference. Results suggest that models of similarity and difference must be attuned to large and consistent individual variability in the weighting of thematic relations.
Similarity and difference are fundamental to cognition. They determine, in large part, the recognition of familiar objects and the categorization of novel objects, and they drive inferences about an object’s features and its predicted behavior in a novel context. Essentially, similarity and difference have been implicated in nearly every cognitive process from
perceptual classification to economic decision-making. Given that similarity and difference influence so many other cognitive processes, then, it is crucial to determine what factors influence the perceptions of similarity and difference themselves.
Some potentially important factors remain underspecified in contemporary models of similarity and difference. For example, perceived similarity and difference may exhibit large individual differences (Simmons & Estes, 2008), but current models fail to account for this presumed variability. Moreover, the relationship between similarity and difference appears to be surprisingly complex (Medin, Goldstone, and Gentner, 1990), and current models do not adequately explain this relationship. Below we report five studies that investigate directly these currently unresolved issues. We first review the major models of semantic similarity, with particular emphasis on the dual process model (Bassok & Medin, 1997; Estes, 2003; Simmons & Estes, 2008; Wisniewski & Bassok, 1999), and then we summarize the literature on the relationship between similarity and difference.
Models of Similarity
In general, similarity can be described in terms of three types of information: features, structural relations, and thematic relations. Of these, features make the most intuitive
similar because their many common features (beaks, wings, etc) outweigh their few distinctive features (size, color). And if the bluebird were to grow black feathers, then its similarity to a crow would increase still further (Gati & Tversky, 1984).
However, features alone are not sufficient for determining similarity. To understand why, consider the following example from Medin, Goldstone, and Gentner (1993): “Person 1 has on a black and white striped shirt and red and green checkered pants, and Person 2 has on a black and white checkered shirt and red and green striped pants” (p. 260). How similar are Person 1 and Person 2? Both wear one striped item and one checkered item, and each wears one black and white item and one red and green item. So by a simple feature matching model such as the contrast model, these two people are wearing maximally similar costumes. Such a model fails to capture the relationship between the pattern and the coloring of each garment.
The structural alignment model (Gentner & A. B. Markman, 1994, 1997; A. B. Markman, 1996; A. B. Markman & Gentner, 1993a, 1993b) provides a solution to this problem. According to this model, one’s concepts are structured representations that encode features as well as the relationships among features (i.e., structural relations). Judging
similarity involves bringing two representations into alignment, so as to maximize conceptual overlap. Returning to the above example, the representations must be aligned so that one shirt is compared directly to the other shirt, and likewise for the pants. This process highlights the similarity between their conceptual structure (i.e., both are wearing shirts and pants), and it draws attention to differences related to this structure (i.e., the two shirts have different patterns, as do the pants). Thus, structural relations are a necessary and important component of any model of similarity.
relations occur between stimuli. To illustrate, a flower is connected to its stem in the same way that an eraser is attached to a pencil, thereby constituting a similarity of structural relations. But flowers and pencils are not thematically related. In contrast, flowers and bees are thematically related, but share few if any structural relations. An extensive body of
research indicates that structural relations guide the comparison process, which in turn largely determines the perception of similarity and difference (for review see Gentner & A. B.
Markman, 1997). Of greater interest for the present purposes, however, is a growing body of evidence suggesting that thematic relations also influence perceived similarity and difference.
Indeed, the importance of thematic relations to similarity judgments has been
demonstrated across a variety of stimuli and tasks. Bassok and Medin (1997) found that when judging the similarity of two sentences containing the same nouns (e.g., The carpenter fixed the chair & The carpenter sat on the chair), participants justified their ratings by integrating
the sentences into a common scenario (e.g., “[T]he carpenter sat on the chair to see whether he fixed it well”). Thus, participants justified similarity not by comparing structural relations (e.g., both sentences are about carpenters), but by inventing a novel thematic relation to link the actions in each sentence. The most direct evidence for a thematic influence on similarity is the finding that thematically related concepts are judged to be more similar than thematically unrelated concepts. For example, Wisniewski and Bassok (1999) demonstrated that
collie herds the sheep) before soliciting ratings of their similarity. Their results corroborated
the observation that a thematic relation between two concepts increases the perceived similarity of those concepts.
The structural alignment model fails to explain this influence of thematic relations on perceived similarity and difference. For example, from the perspective of alignment theory, assessing the similarity of apple pie and ice cream requires aligning the two representations to apprehend commonalties (both are desserts, both are sweet) and differences related to
conceptual overlap (ice cream is colder than apple pie). Structural alignment accounts for the relations between the features of a single stimulus, but it often underestimates perceived similarity because it fails to account for the relation between two stimuli. In fact, Gentner and Brem (1999; see also Gentner & Gunn, 2001) reject thematic relations as a legitimate source of similarity. In their view, similarity is synonymous with comparison (i.e., structural
alignment); therefore, any other process that influences a similarity task (e.g., thematic integration) is considered illegitimate.
The dual process model (Bassok & Medin, 1997; Estes, 2003; Wisniewski & Bassok, 1999) accommodates the influence of thematic relations simply by allowing both comparison (i.e., structural alignment) and integration to affect similarity. According to the model, the relative influences of the comparison and integration processes will depend on the
relationship between the items: Comparison is more heavily weighted for structurally alignable items (i.e., those with similar conceptual structure), whereas integration is more heavily weighted for thematically related items. Furthermore, the relative dominance of a given process can also be mediated by the task itself: Structural alignment should dominate similarity judgments, and thematic integration should dominate relational judgments. Thus, the dual process model predicts that stimulus and task factors interact to determine which processing mechanism (i.e., alignment or integration) will dominate judgment. A further question of interest—which will serve as the focus of the present investigation—is whether the relative dominance of these distinct processing mechanisms also varies systematically across participants.
Individual Differences in Similarity
The dual process model tacitly assumes a generalized effect of thematic relations on judgments of similarity. That is, most or all participants are predicted to rate items like milk & coffee to be slightly more similar than pairs like milk & lemonade, because the former pair is
with little or no thematic effect for other participants. The relatively small thematic effect observed in prior studies may result from averaging across these two groups of participants.
If the generalized model is correct, then certainly much remains to be specified in the dual process model (e.g., how thematic integration occurs), but the basic model delineated by Wisniewski and Bassok (1999) would provide a sound framework for further development. In contrast, if the individualized model were correct, then models of similarity would require more substantial revision. In particular, models of similarity may require the addition of an individual parameter, and in fact, this parameter may ultimately prove more important than either the stimulus parameter or the task parameter. The purpose of the present investigation, therefore, was to discriminate between the generalized and individualized versions of the dual process model.
Some prior research on similarity indicates that individual differences in similarity are associated with thematic integration. Gentner and Brem (1999) describe a screening task in which 702 participants were presented triads consisting of a base, a taxonomic alternative, and a thematic alternative (cf. Lin & Murphy, 2001). Participants were instructed to choose the alternative that was most similar to the base. Of Gentner and Brem’s sample, 41% of participants exhibited no systematic preference for either alternative (i.e., taxonomic or thematic). However, 48% consistently chose the taxonomic alternative, while 11% consistently chose the thematic alternative (see also Simmons & Estes, 2008, described below). This study indicates systematic individual differences in the perception of similarity.
Non-Inversion of Similarity and Difference
showed no preference in difference. Bassok and Medin (1997) demonstrated non-inversion in a sentence comparison task. Participants judged a base sentence (The carpenter fixed the chair) as more similar to a relational match (The electrician fixed the radio) than to an
attribute match (The carpenter sat in the chair). But once again, participants demonstrated no preference in difference judgments. In each of these studies, the non-inversion was
attributable to a greater relative weighting of structural relations in similarity than in difference.
Simmons and Estes (2008) tested whether thematic relations might also induce a non-inversion of similarity and difference. We solicited from participants both similarity ratings and difference ratings (between-participants) for the same pairs of thematically related and unrelated concepts. Results corroborated the influence of thematic relations on perceived similarity (Wisniewski & Bassok, 1999). But more importantly, this thematic effect was significantly attenuated in difference ratings, thereby producing a non-inversion. In Experiment 1, for instance, thematic relatedness accounted for 54% of the variance in similarity ratings, but only 34% of the variance in difference ratings. In another experiment we explicitly instructed participants to base their ratings on features alone, and participants generally were able to discount thematic relations from their ratings. This exclusion of thematic relations substantially reduced the non-inversion. In a final experiment we
administered a similarity triad task (cf. Gentner & Brem, 1999; Lin & Murphy, 2001) prior to the similarity or difference rating task. Consistent with previous studies, the triad task
revealed substantial individual variability in perceived similarity. More interesting, though, was the finding that participants’ preference for thematic alternatives in the triad task better predicted their subsequent similarity ratings than their difference ratings. So, again thematic relations were more closely associated with perceived similarity than with perceived
non-inversion of similarity and difference, whereas participants who preferred taxonomic choices did not exhibit the non-inversion. These experiments provide initial evidence that thematic relations are more heavily weighted in similarity judgments than in difference judgments, and that this effect is observed only in a subset of participants.
In summary, although the generalized dual process model (e.g., Wisniewski & Bassok, 1999) currently offers the only account of thematic relations, more recent evidence appears to support an individualized model instead. Below we report a series of studies that examine in greater detail the presumed individual variability of perceived similarity and difference.
Experiment 1a
The purpose of Experiment 1a was to provide an initial test of the generalized and individualized models. The experiment also tested whether a preference for thematic choices is related to the non-inversion of similarity and difference, as suggested by Simmons and Estes (2008). Using the triad choice task (Gentner & Brem, 1999; E. M. Markman & Hutchinson, 1984; see also Lin & Murphy, 2001), participants chose whether a taxonomic alternative or a thematic alternative was more similar to (or more different from) a base stimulus. For instance, the base stimulus bee was presented with alternative choices fly and honey, and participants chose the alternative that was either more similar to or more different
suggested by the results of Simmons and Estes (2008), then thematic choices should be more common in similarity than in difference judgments.
Method
Participants. Participants in all experiments were undergraduates at the University of
Georgia, all were native English speakers, and all received course credit for participation. In Experiment 1a, 68 participants were randomly assigned to a Similarity condition (n = 35) or a Difference condition (n = 33).
Materials & Procedure. Thirty triads were sampled from Lin and Murphy (2001,
Table 1, items 1-30). Each triad consisted of a base (pencil), a thematically related option (eraser), and a taxonomically related option (pen). On each trial the base appeared in the center of a computer display, above the response options, which appeared left and right of center on the same line. Participants in the Similarity condition were instructed to “Pick the response option that is most similar to [base]” by pressing the <1> or the <2> key. The Difference condition was identical except that participants were instructed to choose the option “most different from” the base. Assignment of taxonomic and thematic options to the left and right positions was counterbalanced across two lists. Each participant judged all 30 triads, which appeared in random order.
Results
Agreement was tested across participants (Lin & Murphy, 2001), whereas
non-inversion was tested across items (Medin et al., 1990). These analyses are reported separately below.
Agreement. For each participant we calculated the proportion of trials on which the
taxonomic or thematic options. These participants constituted a “Mixed” response group. Participants who exhibited a significant preference for taxonomic options (i.e., thematic proportion < .31, binomial p < .05) were dubbed the “Taxonomic” group, and those who significantly preferred the thematic option (i.e., thematic proportion > .69, binomial p < .05) constituted a “Thematic” group.
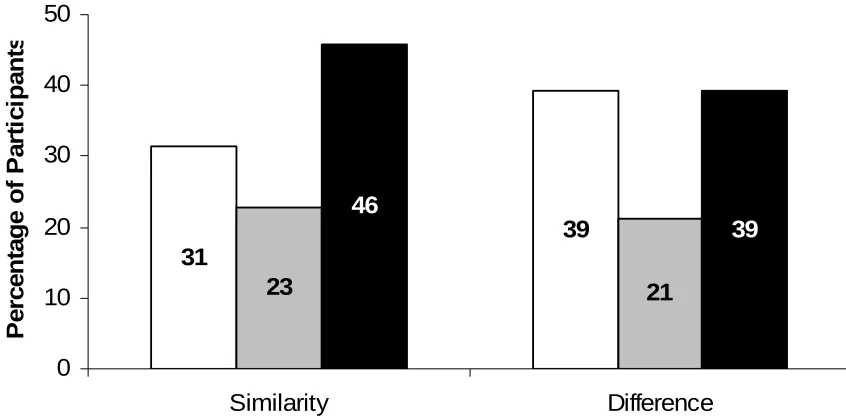
Table 1 and Figure 1 illustrate the distribution of participants among these groups. Participants tended to exhibit a clear preference for either taxonomic or thematic choices; only 23% and 21% of participants in the similarity and difference conditions (respectively) chose the taxonomic and thematic options in roughly equal measure. Whereas 31% of participants consistently chose the taxonomic option as more similar to the base, 46% reliably chose the thematic option as more similar. The same pattern of contrasting choices was observed in the difference condition. Whereas 39% systematically chose the taxonomic option as more different from the base, another 39% regularly selected the thematic option.
The prevalence of thematic choices among some participants could reflect a task demand to respond consistently across trials. For example, a participant who chose the
thematic match on the first trial might have selected thematic matches for the remainder of the experiment in order to appear consistent (see Lin & Murphy, 2001, p. 10-11). If so, then participants who judged a triad with a high thematic proportion on their first trial should be more likely to have a high overall thematic proportion. In other words, participants’ overall thematic proportions should correlate with the average thematic proportion of the item they judged on the first trial. However, this correlation did not approach significance in either similarity [r = .05, p = .76] or difference judgments [r = -.20, p = .26]. Thus, the prevalence of thematic choices was not attributable to a consistency bias.
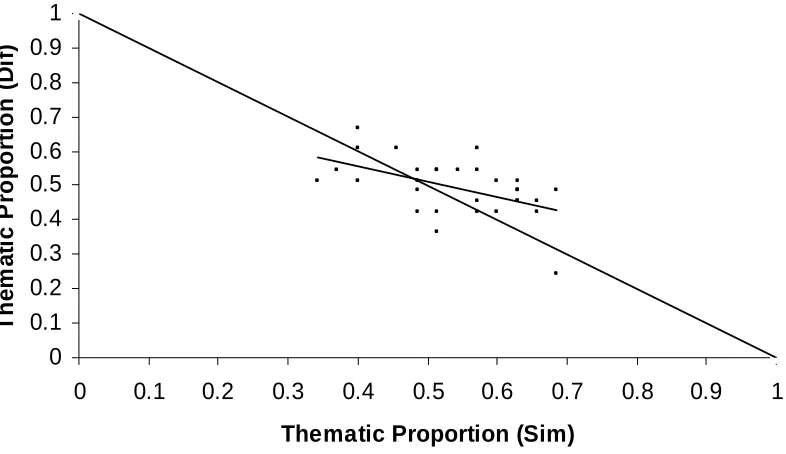
Non-inversion. For each triad we calculated the proportion of thematic choices in the
proportions. The negative diagonal represents the theoretical inverse relationship between similarity and difference. If similarity and difference were inverses, then the 30 triads should be distributed evenly around the negative diagonal, and the overall proportion of thematic choices (collapsed across the similarity and difference conditions) should be .50. To illustrate, if a given triad elicited 25% thematic choices in the similarity condition, then
complementarity would predict 75% thematic choices in the difference condition, so that averaging across the similarity and difference conditions would yield 50% thematic choices. Any deviation from this complementarity (i.e., thematic proportion = .50) would constitute a non-inversion of similarity and difference (Medin et al., 1990).
As evident in Figure 2, the similarity and difference choices were indeed negatively correlated, although the strength of this relationship was surprisingly moderate [r (30) = -.53, p < .01]. More importantly, the stimuli tended to occur above the diagonal, with fewer observations below it. This property is confirmed by the overall proportion of thematic choices (M = .52, SE < .01), which deviated significantly from complementarity, t (29) = 2.18, p < .05. Thus, similarity and difference were non-inverse. More specifically, the proportion of thematic choices was above chance for similarity [M = .54, SE = .02; t (29) = 2.34, p < .05], but was at chance for difference [M = .49, SE = .02; p = .69]. As suggested by Simmons and Estes (2008), thematic choices dominated in similarity, but thematic and taxonomic choices were equiprobable in difference.
Discussion
to explain the prevalence—indeed, the dominance—of thematic choices. The generalized model, which includes both comparison and thematic integration (Bassok & Medin, 1997; Estes, 2003; Wisniewski & Bassok, 1999), provides only a partial explanation. Although this model can account for a consistent amount of thematic responding across participants, it does not explain the systematic individual differences in similarity judgments. Only the
individualized model can explain these results. For some participants (i.e., the Taxonomic group in similarity and the Thematic group in difference), similarity and difference do appear to favor feature comparison. But for others (i.e., the Thematic group in similarity and the Taxonomic group in difference), thematic relatedness is clearly more central to similarity and difference. And yet a third group (i.e., Mixed) appear to weight the feature comparison and thematic integration processes more equally. Notably, however, this mixed responding was relatively rare. So evidently, similarity and difference both entail dual processes of
comparison and integration, but the relative weightings of these two factors vary dramatically across participants.
Furthermore, between-participant disagreement produced a non-inversion of similarity and difference. That is, thematic choices were more common than taxonomic choices in the similarity condition but thematic and taxonomic choices were equiprobable in the difference condition. So the thematic dominance in similarity was not complemented by a taxonomic dominance in difference, and hence a non-inversion of similarity and difference occurred (see Figure 2).
to be selected as both more similar to and more different from a base concept. If the effect were attributable to random sampling error, then some of these studies would be expected to exhibit the opposite effect – that is, a tendency to select attribute matches as both more similar and more different. Nonetheless, this sampling explanation of non-inversion is investigated more directly in Experiment 2.
Experiment 1b
The previous experiment demonstrated between-participant disagreement in similarity and difference judgments. However, similarity judgments are highly sensitive to a variety of task factors (Barsalou, 1982; Beck, 1966; Gentner & Brem, 1999), including the precise wording of the similarity question (e.g., Goldstone, 1994). In particular, Jones and Love (2007) found that participants are less likely to respond thematically when asked about how like items are, rather than how similar they are. Therefore, in order to test whether the
prevalence of thematic responding might have resulted from a misconstrual of the term “similarity”, in this study we asked participants to choose the alternative that was more “like” the base. If the occurrence of thematic responding were contingent on this minor wording manipulation, it would undermine the supposition that thematic responding reflects a deeper conceptual preference. In contrast, between-participant disagreement under this condition would demonstrate the robustness of individual differences in the perception of similarity.
Method
Thirty-five undergraduates participated. The procedure was identical to the similarity
condition in Experiment 1a, except that for each item the word “like” was substituted for “similar to.”
Results
while a full 57% of participants were classified as Thematic. Only 12% fell into the Mixed category. As in Experiment 1a, the preference for thematic matches was above chance [M = .60, SE = .01; t (29) = 8.71, p < .001]. In fact, this distribution of participants among the three response groups was statistically indistinguishable from the distribution in the similarity condition of Experiment 1a (left half of Figure 1) [χ2 (2) = 1.78, p = .41]. In other words, “similar to” and “like” elicited analogous patterns of responding.
Discussion
It is apparent from these results that the same between-participant disagreement obtained even though the task was designed to discourage thematic responses (Jones & Love, 2007). This suggests a deeper conceptual basis for disagreement that cannot be dismissed as a misinterpretation of “similarity.” Participants appear to have strikingly different beliefs about the nature of similarity. To some participants common features are more important, while to others the relations between concepts are the most critical. Results therefore necessitate an individualized model of perceived similarity.
Experiment 2a
The presence of individual differences in similarity and difference judgments provides an important theoretical constraint on models of similarity. Moreover, those models are constrained further by the non-inversion of similarity and difference. All prior demonstrations of non-inversion (including Experiment 1a) have elicited similarity and difference judgments between-participants, so it is unclear whether individual participants exhibit non-inversion or whether it occurs only at the group level. In other words, do participants simply always select the same type of option (thematic or taxonomic) regardless of the task (similarity or
eliminating non-inversion. Presumably, if a participant judges pencil as more similar to eraser than to pen, that same participant would judge pencil as more different from pen than from eraser. If this is the case, then individual differences are relatively stable across judgments; a
Thematic participant in similarity should become a Taxonomic participant in difference, and vice versa. To test this possibility, Experiment 2a was an exact replication of Experiment 1a, except that similarity and difference judgments were collected within-participants in two different phases of the experiment. If the same individuals were reliably to choose a given option as both more similar to and more different from its base, that would provide strong evidence of non-inversion. Furthermore, if the non-inversion is attributable to a greater reliance on thematic integration than on feature comparison, Thematic participants should be more likely than Taxonomic participants to exhibit non-inversion.
Method
Fifty-five undergraduates participated. The materials and procedure were identical to Experiment 1a, except that each participant judged both the similarity and the difference of all 30 triads. At the beginning of the session, participants were randomly assigned to complete either the similarity judgments or the difference judgments. Participants then completed several unrelated tasks (e.g., a mediated priming experiment), and after approximately 20-30 minutes they completed the other judgments. Thus the similarity and difference judgments were blocked, counterbalanced, and separated by approximately 20 minutes.
Results
Agreement. Participants were classified into response groups according to the criteria
nor the order by judgment interaction [F (1, 53) = 3.53, p = .07] was significant, we collapsed across presentation order for the remaining analyses.
As in Experiment 1a, the distribution of participants’ thematic proportions indicated between-participant disagreement in similarity and difference judgments (see Table 1 and Figure 3). In the similarity condition, over half of participants (55%) chose the taxonomic option most of the time, while over a third (38%) chose the thematic option for most trials. Only 7% of participants had thematic proportions in the middle interval, indicating that most people demonstrated a preference for one or the other type of option. In the difference condition, 27% of participants tended to choose the taxonomic option, while 62% preferred the thematic option. The percentage of participants having thematic proportions in the middle interval was again relatively low (11%), indicating that few people chose both option-types equally often. Thus, the present experiment replicated the between-participant disagreement in similarity and difference that was originally observed in the preceding experiment.
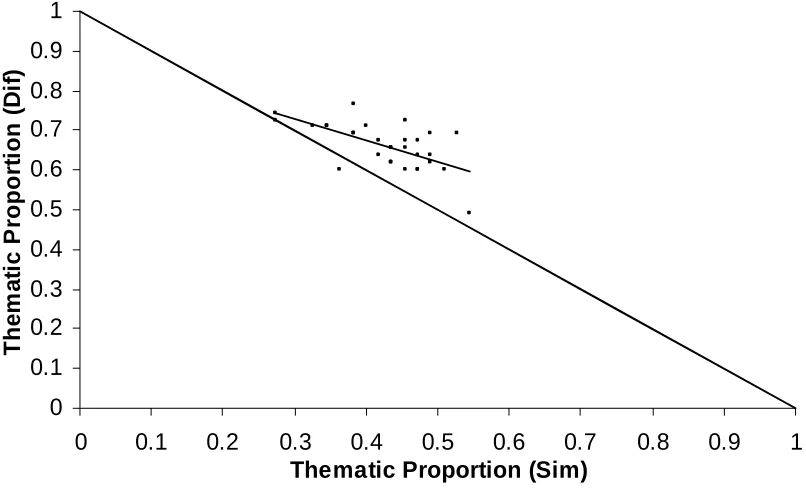
Non-inversion. The proportions of thematic choices in the similarity and difference
conditions are plotted in Figure 4. Recall that if similarity and difference judgments were complementary, then the items should be distributed about the negative diagonal, and the overall proportion of thematic choices should be .50. As in Experiment 1a, similarity and difference were indeed negatively correlated [r (30) = -.63, p < .001], but the majority of items were distributed above the negative diagonal. Thus, the overall proportion of thematic choices (M = .54, SE < .01) was significantly greater than .50, [t (29) = 8.70, p < .001]. This result indicates that similarity and difference judgments were non-inverse again. In
< .001], the thematic option dominated in difference [M = .66, SE = .01, t (29) = 15.34, p < .001].
Across participants, the same option was selected as both more similar and more different on 33% of trials. The vast majority of these individual cases of non-inversion
occurred with thematic options: The thematic alternative was chosen as both more similar and more different on 24% of trials, while the taxonomic alternative was chosen in both
judgments only 9% of the time. This finding explains why the overall thematic proportion was greater than .50 (see above).
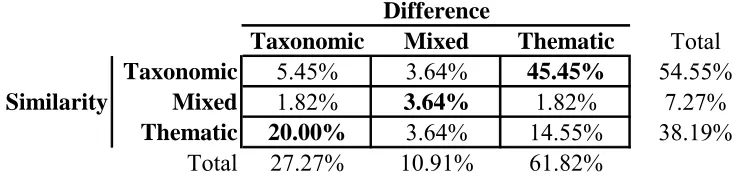
Table 2 presents the distribution of participants among the three response group in each of the judgment tasks. If similarity and difference were inverse, then a participant who exhibited a taxonomic preference in similarity should exhibit a thematic preference in difference. Likewise, one who is Thematic in similarity should be Taxonomic in difference, and a Mixed participant should remain so across judgments. These groups of participants, who exhibited an inverse relationship between their similarity choices and their difference choices, appear in Table 2 as the positive diagonal (in bold font). As evident in the table, the most frequent pattern was of taxonomic similarity choices and thematic difference choices (45%). But perhaps more interestingly, 20% of participants showed a thematic preference in similarity and a taxonomic preference in difference. A further 4% of participants exhibited no clear preference in either judgment.
This result is even more powerful than Experiment 1a, since here the non-inversion occurred with the same participants judging the similarity and difference of the same items.
Discussion
In Experiment 2a (as in Experiment 1a) some participants tended to choose the
taxonomic match as more similar and the thematic match as more different. Other participants demonstrated the opposite pattern (Figure 3), as predicted by the individualized model. Few participants behaved as though they had no preference for a particular type of match.
Importantly, the Thematic participants did not represent a small group of outliers, as one might expect if the generalized model were correct. Rather, there were comparable numbers of Taxonomic and Thematic participants. The results of the present experiment also provide strong evidence that the non-inversion (Figure 4) is due to a differential influence of thematic relations on similarity and difference. Participants who exhibited the non-inversion were approximately three times more likely to prefer thematic choices than taxonomic choices (see Table 2). Because there were no order effects, the attenuation of thematic responding in comparison to Experiments 1a and 1b was most likely the result of sampling differences. The individualized model predicts systematic between-participant disagreement, but does not specify the absolute dominance of thematic or taxonomic responding. Regardless of the overall number of Thematic participants in a sample, non-inversion is more likely to emerge from their judgments than from the judgments of Taxonomic participants.
Experiment 2b
providing their difference choices (or vice versa). To test these possibilities, in Experiment 2b each participant judged both the similarity and the difference of the same triads on
consecutive trials.
Method
Thirty-two undergraduates participated. The materials and procedure were the same
as Experiment 2a except that participants judged the similarity and difference of each triad on consecutive trials. Order of presentation (similarity first or difference first) was randomized within-participants, so that each participant judged similarity first on half the trials and judged difference first on the other half. The order of item presentation was counterbalanced across two lists.
Results
Agreement. To test for an effect of presentation order (similarity first or difference first) we conducted a 2 (list) by 2 (judgment) ANOVA on thematic proportions, with participants random. Because the effect of list [F (1, 30) = .05, p = .82] and the list by
judgment interaction [F (1, 30) = .80, p = .38] were not significant, we collapsed across order in the remaining analyses.
Non-inversion. The proportions of thematic choices in similarity and difference are
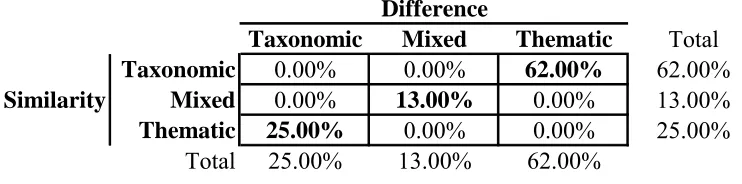
plotted in Figure 6. Whereas in the previous experiments similarity and difference were moderately correlated, in this experiment the correlation was extremely strong [r (30) = - .99, p < .001]. Unlike the results of the previous experiments, neither type of option dominated similarity [M = .48, SE = .03; t (29) = -.57, p = .57] or difference judgments [M = .51, SE = .03; t (29) = .29, p = .78]. Thus, the overall thematic proportion did not differ from .50 [M = .49, SE = .02; t (29) = -1.47, p = .15], thereby indicating an inverse relationship between similarity and difference judgments. In terms of response groups, every Thematic participant in similarity became a Taxonomic participant in difference, and vice versa; and every Mixed participant remained in that category across judgments (see Table 3). When judging similarity and difference on consecutive trials, every single participant (in terms of response groups) exhibited a complementary relationship between similarity and difference.
Discussion
The results of Experiment 2b demonstrate that individual differences in similarity and difference judgments are robust even when these choices are made on consecutive trials for the same item (Figure 5). Although there was somewhat less thematic responding in similarity than in the previous experiments, a substantial proportion of participants remained resolutely Thematic. Participants in Experiment 2b also tended to treat similarity and difference
judgments as inverse (Figure 6). While almost a third (31%) of participants in Experiment 2a departed from complementarity, none did so in Experiment 2b (Table 3). Evidently, when memory allows, participants prefer to treat similarity and difference as inverses. Thus, non-inversion is more than a group level phenomenon (Experiment 2a), but it appears to be sensitive to the proximity between similarity and difference judgments.
Several indirect lines of evidence suggest that thematic integration is less likely to influence similarity judgments when participants are induced to process the stimuli more deeply. Gentner and Brem (1999) demonstrated that time-pressure influences the extent of thematic responding. They contrasted responses to triads with taxonomic and thematic
matches to a base with responses to triads with taxonomic and unrelated matches. Participants were told to choose the taxonomically similar alternative and were given either 1000 ms or 2000 ms to respond. Participants incorrectly selected thematic matches more frequently than unrelated matches, suggesting that the thematic relatedness was confused with taxonomic similarity. Furthermore this effect was most prominent at the shorter deadline. Simmons and Estes (2008) found that instructing participants to base their judgments on features, and asking them to justify their responses, significantly attenuated the influence of thematic relations. And in the present experiments, we have found that thematic choices were less likely when similarity and difference judgments were directly contrasted on consecutive trials (Experiment 2b) than when the judgments occurred at different times (Experiment 2a). Given these findings, one could infer that thematic participants simply aren’t very thoughtful; when induced to invest more thought into their judgments, thematic responding decreases. This inference is consistent with Gentner and Brem’s (1999) suggestion that the thematic influence on similarity arises from inadvertently combining the outputs of comparison and integration.
The primary purpose of Experiment 3 was to test this hypothesis that thematic respondents are perhaps less thoughtful than their taxonomic peers. To investigate this possibility, we assessed participants’ need for cognition (henceforth “NFC”), which is “the tendency for an individual to engage in and enjoy thinking” (Caccioppo & Petty, 1982, p. 116). Given that individuals who are high in NFC tend to process information deeply
in contrast, should be more likely to make thematic judgments. Thus, NFC should correlate negatively with thematic responding.
Alternatively, the thematic responding in the previous experiments could reflect participants’ genuine belief that thematic relations are a legitimate component of similarity. That is, perhaps thematic participants and taxonomic participants simply possess different conceptions of similarity. To assess this explanation of thematic responding, we directly probed participants’ beliefs about similarity. In particular, we gauged the extent to which participants agreed (or disagreed) that two things are similar if (a) they have the same features, (b) they belong in the same category, and (c) they occur in the same scenario. The first two potential sources of similarity (i.e., feature overlap and category co-membership) correspond to the comparison process and were expected to be favored by taxonomic respondents. The latter potential source of similarity (i.e., scenario co-occurrence)
corresponds instead to thematic integration. The question of most interest here is whether thematic participants endorse scenario co-occurrence as a legitimate source of similarity. If so, that would indicate that their thematic responding is no mistake or confusion; thematic responding would be deliberate rather than thoughtless. If thematic participants were to reject scenario co-occurrence, however, this would support the supposition that thematic responding is inadvertent. So to summarize, if thoughtlessness explains thematic responding, then NFC should predict thematic preference. If, however, thematic responding reflects a belief about the nature of similarity, then participants’ tendency to identify thematic relations as relevant to similarity should predict thematic preference.
is, participants might have been inclined simply to choose the alternative that was more frequent, more strongly associated with the base, or more likely to co-occur with the base in ordinary language use. To address these possibilities, in Experiment 3 we developed a new set of stimuli for which the taxonomic and thematic alternatives were matched for word
frequency, strength of association with the base concept, and frequency of co-occurrence with the base concept. Regarding the task, it is possible that the presentation of two options on each trial of the experiment could artificially inflate the prevalence of thematic responding; participants may infer an implicit demand to choose the thematic option on at least some of the trials. To address this concern, in Experiment 3 we used a rating task in which participants rated the similarity of the base concept (e.g., “cake”) to a single other concept (e.g., “cookie”). To examine participants’ preferences for taxonomic or thematic responding, we can compare for each base concept its similarity to the taxonomic alternative and its similarity to the thematic alternative. If an individual consistently rates the base concepts more similar to their thematic match than to their taxonomic match, then she would be a thematic participant. This methodology presumably will provide a less biased measure of the prevalence of thematic responding.
Method
Participants. Thirty-five undergraduates participated.
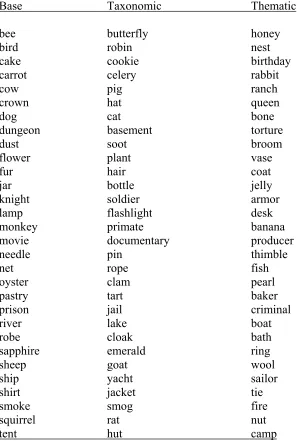
Materials & Procedure. Items consisted of thirty base concepts, each paired with one
= .53). Thus, any difference in ratings of the taxonomic and thematic alternatives cannot be attributed to the lexical factors of frequency, association, or co-occurrence. To disguise the nature of the task, each base was also paired with an unrelated filler item. Items were organized into three blocked lists to counterbalance the order in which participants encountered the three alternatives to each base concept.
Participants were randomly assigned to one experimental list that included all 90 concept pairs (60 experimental and 30 filler). Each trial consisted of a base concept paired with a taxonomic match, thematic match, or unrelated filler, centrally presented on a
computer display. Participants were instructed to rate the similarity, on a scale from 1 (not at all similar) to 7 (very similar) of the concept pairs. Responses were entered on the keyboard number pad. Items appeared in a pseudo-random order with the restriction that base concepts appeared only once in each third of a list, and with the order of taxonomic, thematic, and unrelated matches for each base counterbalanced across lists.
After the rating task participants completed the short form of the Need for Cognition scale (Cacciopo, Petty, & Kao, 1984). Participants rated the extent of their agreement, on a scale from 1 (very strongly disagree) to 9 (very strongly agree), with 18 statements such as “I would prefer complex to simple problems” and “I find satisfaction in deliberating hard and for long hours.” Nine items (e.g., “Thinking is not my idea of fun.”) were negatively worded.
Finally, participants indicated their degree of agreement, on a scale from 1 (very strongly disagree) to 9 (very strongly agree) with the following statements, which were presented in random order:
Two things are similar if they have the same features. Two things are similar if they belong in the same category. Two things are similar if they occur in the same scenario.
To test for an effect of list we conducted a 3 (list) by 3 (item type) ANOVA on
similarity ratings with participants random. Because neither the main effect of list [F (2, 32) = 1.79, p = .18] nor the list by item type interaction [F (4, 64) = .99, p = .42] was significant, we collapsed across lists for the remaining analyses.
Agreement. Next, we calculated thematic preference based on the proportion of trials
on which a participant assigned a higher rating to a thematic match with a base than to a taxonomic match with that same base. For example, a participant’s rating for dungeon / torture was compared to his rating for dungeon / basement. A thematic response was recorded
if the rating was higher for the thematic pair. A taxonomic response was recorded if the rating was higher for the taxonomic pair. Instances where a participant assigned the same rating to both pairs were excluded from analysis. Finally, we divided each participant’s total thematic responses by the sum of thematic and taxonomic responses. This measure of thematic proportion ranged across participants from .00 to .91 (M = .43, SE = .05), indicating that substantial thematic responding was observed in the similarity ratings task, just as it was in the triad choice task of the preceding experiments. Importantly, the prevalence of thematic responding generalizes across tasks.
Participants were subsequently assigned to response groups on the basis of binomial probability. Because the number of relevant trials varied across participants (depending on how many taxonomic and thematic pairs elicited the same rating), binomial probability was assessed separately for each participant. As in the previous experiments, between-participant disagreement in thematic preference was evident (see Table 1): 40% of participants were Taxonomic and 23% were Thematic. Thirty-seven percent of participants fell into the Mixed response group. Thus, individual differences in thematic responding were obtained even when word frequency, association strength, and co-occurrence frequency were controlled. To
ratings of taxonomic and thematic pairs by the Taxonomic, Mixed, and Thematic participants. As evident in the figure, Taxonomic participants rated the base concepts more similar to their taxonomic match than to their thematic match [t (11) = 5.65, p < .01], whereas Thematic participants rated the thematic matches more similar than the taxonomic matches [t (7) = -16.08, p < .01]. The Mixed participants rated the taxonomic and thematic pairs equally (p = .14). This pattern of mean similarity ratings validates the separation of participants into these three groups. It also highlights just how different the Taxonomic and the Thematic
participants are in their perceptions of similarity.
Need for Cognition. NFC scores were based on participants’ average rating on the
questionnaire, with negatively worded items reverse-scored. Therefore, scores could theoretically range from 1 to 9, with 1 representing low NFC and 9 representing high NFC. Participants exhibited a range of scores (2.72 – 7.28) with a mean slightly above the mid-point (M = 5.23, SE = .19).
Beliefs about Similarity. Scores on the follow-up questions could range from 1 to 9,
question ratings were then correlated with their NFC scores (see Table 6). NFC was not associated with participants’ beliefs about the importance of sharing features, belonging to the same category, or participating in the same scenario to similarity (all p > .40). The lack of association between NFC and scenario relevance was of interest. Evidently, participants who are low in NFC are no more likely than participants high in NFC to believe that scenario co-occurrence is relevant to similarity. Thus, if low NFC participants are indeed more likely to exhibit thematic responding, it would not be attributable to a belief that scenario
co-occurrence is relevant to similarity.
Predicting Ratings. We initially tested whether participants’ NFC, category relevance,
feature relevance, and scenario relevance were correlated with their thematic proportion. As shown in Table 6, NFC and scenario relevance were both marginally associated with thematic preference (p = .08 and p = .06, respectively). We therefore ran a regression analysis with these two factors as predictors of thematic proportion. The overall model fit was significant [F (2, 32) = 4.58, p < .05; R2 = .22], with both NFC [β = -.35, p < .05] and scenario relevance [β = .36, p < .05] significantly predicting thematic proportion. Participants who reported a low need for cognition were more likely to rate thematic matches more similar than taxonomic matches. This finding supports the hypothesis that thematic responding may not require as much “deep” processing as taxonomic responding. However, those participants who exhibited greater thematic responding were also more likely to endorse scenario co-occurrence as a legitimate source of similarity. This latter finding suggests that some participants do believe that similarity should include thematic relations, and their ratings were consistent with this belief.
Discussion
relations using a novel, well-controlled item set. Therefore, the previous results cannot be attributed to lexical factors (i.e., word frequency, association strength, or co-occurrence) or to the use of a biasing task. Notably, there was considerable agreement among participants concerning the similarity of taxonomic items (Figure 7). All three participant types gave roughly equal ratings to taxonomic items. Thus, thematic preference in the triad task does not appear to indicate a rejection of taxonomic similarity. Rather, it indicates the importance of thematic relations relative to a taxonomic standard. For instance, among Taxonomic
participants, thematic relations are relatively less important than taxonomic relations, while among Thematic participants, thematic relations are relatively more important than taxonomic relations.
The weighting of thematic relations in similarity judgments reflected differences in NFC. Participants who exhibited a strong thematic preference tended to enjoy thinking and problem solving less than participants who exhibited a weak thematic preference. The
weighting of thematic relations was also associated with an overt belief that participation in a common scenario is a legitimate source of similarity. Participants with a strong thematic preference tended to rate thematic relations as more relevant to similarity than participants with a weak thematic preference. Interestingly, the observation that NFC and scenario co-occurrence themselves were uncorrelated suggests that there may be two types of the thematic participants—those who believe that thematic integration should be a component of
similarity, and those who simply do not process the stimuli very deeply. General Discussion
The preceding experiments have yielded three important results. First, these
match, while other participants reliably chose the taxonomic match. Few participants were agnostic in the choice between thematic and taxonomic stimuli. The surprising prevalence of thematic responding was equally evident whether judging which alternative is more “similar to” the base (Experiment 1a) or which is more “like” the base (Experiment 1b). In fact, participants continued to exhibit thematic similarity choices even when those judgments were directly contrasted with difference judgments of the same stimuli (Experiment 2a), though this thematic tendency was reduced when similarity and difference were judged on
consecutive trials (Experiment 2b). Moreover, consistent thematic responding was evident not only in a triad choice task, but also in a similarity rating task (Experiment 3). Finally,
participants’ thematic tendencies were predicted by both their need for cognition and their beliefs about similarity. Specifically, participants with a high need for cognition were less likely to exhibit thematic responding, whereas participants who believe that scenario co-occurrence is a legitimate source of similarity were more likely to exhibit thematic
responding. Although preliminary evidence supported the hypothesis of substantial individual variability in perceived similarity (Gentner & Brem, 1999; Simmons & Estes, 2008), these experiments provide the first demonstration of how robust this individual variability is, and how it relates to perceived difference.
The second important observation of these experiments is that thematic responding is not simply a by-product of lexical factors. Previous demonstrations of a thematic effect on similarity (Bassok & Medin, 1997; Estes, 2003; Jones & Love, 2007; Simmons & Estes, 2008; Wisniewski & Bassok, 1999) have not matched taxonomic and thematic items for potential confounds such as word frequency, association strength, and co-occurrence
were matched for frequency, association, and co-occurrence. Thus, the thematic effect on similarity is not attributable to these lexical factors.
The third contribution of these experiments is to show that thematic relations may induce a non-inversion of similarity and difference. Experiment 1a corroborated the thematic non-inversion reported by Simmons and Estes (2008), and Experiment 2a provided the first within-participant demonstration of this non-inversion. Moreover, when participants’
similarity and difference choices were non-inverse, it was most often the thematic option that was chosen as both more similar to and more different from the base. Notably, however, the non-inversion was eliminated entirely when participants judged both the similarity and the difference of the same items on consecutive trials (Experiment 2b). Thus, non-inversion is more than a group level phenomenon, but it is sensitive to the influence of participants’ beliefs concerning similarity and difference. Below we discuss the theoretical and practical implications of these results.
These results clearly support a dual process model of perceived similarity. Single process models such as the contrast model (Tversky, 1977) and the structural alignment model (e.g., Gentner & A. B. Markman, 1997) cannot explain the present results. If similarity was the result of comparison only, then participants should have chosen the taxonomic option consistently across trials, because taxonomically related stimuli are more easily aligned and have more commonalities than do taxonomically unrelated stimuli (A. B. Markman & Gentner, 1993-a). So given the reliable and systematic occurrence of thematic choices, these results undermine comparison-only models of similarity. Simply stated, a model of similarity that does not account explicitly for thematic integration cannot explain participants’ similarity choices.
to describe accurately the influence of thematic integration on the perception of similarity. Understanding the systematic variability in thematic preference observed in the present
experiments necessitates an individualized approach. In this model the weights assigned to the comparison and integration processes vary dramatically across individuals, but are consistent within an individual. Some participants weight comparison more than integration (e.g., Taxonomic participants), while others show the reverse pattern (e.g., Thematic participants). And, some participants assign the processes roughly equal weight (e.g., Mixed participants). Thus, the tendency to compare or integrate is constrained not only by stimulus and task factors, as originally proposed by Wisniewski and Bassok (1999), but also by an individual’s preference for a given process. In particular, the results of Experiment 3 suggest that a preference for thematic integration in similarity judgments may arise from two independent sources. As suggested by Gentner and Brem (1999), some thematic respondents simply don’t process the stimuli very deeply. For these participants, thematic integration may be confused with feature comparison. However, other thematic respondents are relatively more thoughtful, and they believe that thematic relations are important for similarity. These participants appear to respond thematically as a matter of deliberate choice.
Like perceived similarity, perceived difference also necessitates an individualized dual process model. Some participants consistently chose the thematic alternative as more different from the base, whereas other participants consistently chose the taxonomic alternative.
Despite the comparable pattern of results for similarity and difference choices, however, it is not sufficient to model difference as the opposite of similarity. As illustrated by the
occurrence of non-inversion, perceived similarity and perceived difference diverge in the weighting of the thematic integration process. Specifically, the influence of thematic
integration was attenuated in the perception of difference. This result corroborates Simmons and Estes (2008), who found that thematic relations account for less variance in difference judgments than in similarity judgments.
Thus, it appears that different types of information are relevant to similarity and difference. Our results suggest that non-inversion is tied to the performance of participants who prefer thematic relations in similarity, since these participants tend to answer less consistently than those who prefer comparison. However, this explanation should be
interpreted with caution. As seen in Experiment 2b, non-inversion depends on the contiguity between similarity and difference judgments. Presenting similarity and difference
consecutively eliminates non-inversion, presumably because participants believe that these judgments should be complementary.
The individual differences observed in the present experiments, although substantial, do not necessarily reflect large variability in conceptual knowledge; participants who
some probability that he may weight thematic information more heavily on one occasion than on another. Indeed, such within-participant inconsistency has been observed in categorization (Barsalou, 1989), although not in terms of a taxonomic versus thematic preference. However, two results argue against dramatic inconsistency in similarity judgments. First, Experiment 3 demonstrated that the precise weights that individuals assign to the outputs of comparison and integration reflect differences in NFC; Thematic participants are less likely than their
Taxonomic counterparts to enjoy thinking and problem-solving. Because NFC is stable over time, thematic responding should also remain relatively stable over time. Furthermore,
Thematic and Taxonomic participants appear to weight comparison and integration differently because they hold different beliefs about what information is relevant to similarity.
Participants who believe that participation in the same scenario is important to similarity tend to exhibit a strong thematic preference. Intuitively, it seems unlikely that participants’ beliefs about similarity will change substantially across time, and hence their similarity judgments should also remain stable across time. However, more direct investigation of
References
Barsalou, L. W. (1982). Context-independent and context-dependent information in concepts. Memory & Cognition, 10, 82-93.
Barsalou, L. W. (1989). Intraconcept similarity and its implications for interconcept
similarity. In S. Vosniadou & A. Ortony (Eds.), Similarity and analogical reasoning (pp. 76-121). Cambridge: Cambridge University Press.
Bassok, M., & Medin, D. L. (1997). Birds of a feather flock together: Similarity judgments with semantically rich stimuli. Journal of Memory and Language, 36, 311–336. Beck, J. (1966). Effect of orientation and of shape similarity on perceptual grouping.
Perception & Psychophysics, 1, 300-302.
Cacioppo, J. T., & Petty, R. E. (1982). The need for cognition. Journal of Personality and Social Psychology, 42, 116-131.
Cacioppo, J. T., Petty, R. E., & Kao, C. F. (1984). The efficient assessment of need for cognition. Journal of Personality Assessment, 48, 306-307.
Estes, Z. (2003). A tale of two similarities: Comparison and integration in conceptual combination. Cognitive Science 27, 911–921.
Estes, Z. & Hasson, U. (2004). The importance of being nonalignable: A critical test of the structural alignment theory of similarity. Journal of Experimental Psychology: Learning, Memory, and Cognition, 30, 1082-1092.
Gati, I. & Tversky, A. (1984). Weighting common and distinctive features in conceptual and perceptual judgments. Cognitive Psychology, 16, 341-370.
Gentner, D. & Brem, S. K. (1999). Is snow really similar to a shovel? Distinguishing similarity from thematic relatedness. Proceedings of the 21st
Annual Conference of the
Cognitive Science Society (pp. 179-184). Hillsdale, NJ: Lawrence Earlbaum
Gentner, D. & Gunn, V. (2001). Structural alignment facilitates the noticing of differences. Memory & Cognition, 29, 565-577.
Gentner, D. & Markman, A. B. (1994). Structural alignment in comparison: No difference without similarity. Psychological Science, 5, 152-158.
Gentner, D. & Markman, A. B. (1997). Structure mapping in analogy and similarity. American Psychologist, 52, 45–56.
Goldstone, R. L. (1994). The role of similarity in categorization: Providing a groundwork. Cognition, 52, 125-157.
Hampton, J. A., Estes, Z., & Simmons, S. (2007) Metamorphosis: Essence, appearance and behavior in the categorization of natural kinds. Memory & Cognition, 35, 1785-1800. Jones, M. & Love, B. (2007). Beyond common features: The role of roles in determining
similarity. Cognitive Psychology, 55, 196-231.
Landauer, T. K. & Dumais, S. T. (2002). A solution to Plato’s problem: The latent semantic analysis theory of the acquisition, induction, and representation of knowledge. Psychological Review, 104, 211- 240.
Lassiter, G. D., Briggs, M. A., & Slaw, R. D. (1991). Need for cognition, causal processing, and memory for behavior. Personality and Social Psychology Bulletin, 17, 694–699. Levin, I. P., Huneke, M. E., & Jasper, J. D. (2000). Information processing at successive
stages of decision making: Need for cognition and inclusion–exclusion effects. Organizational Behavior and Human Decision Processes, 82, 171–193.
Lin, E. L. & Murphy, G. L. (2001). Thematic relations in adults’ concepts. Journal of Experimental Psychology: General, 130, 3-28.
Markman, A. B. & Gentner, D. (1993b). Structural alignment during similarity comparisons. Cognitive Psychology, 25, 431-467.
Markman, E. M. & Hutchinson, J. E. (1984). Children’s sensitivity to constraints on word meaning: Taxonomic versus thematic relations. Cognitive Psychology, 16, 1-27. Medin, D. L., Goldstone, R. L., & Gentner, D. (1990). Similarity involving attributes and
relations: Judgments of similarity and difference are not inverses. Psychological Science, 1, 64-69.
Medin, D. L., Goldstone, R. L., & Gentner, D. (1993). Respects for similarity. Psychological Review, 100, 254-278.
Murphy, G. L. (2001). Causes of taxonomic sorting by adults: A test of the thematic-to-taxonomic shift. Psychonomic Bulletin & Review, 8, 834-839.
Navarro, D. & Lee, M. (2004). Common and distinctive features in stimulus similarity: A modified version of the contrast model. Psychonomic Bulletin & Review, 11, 961-974. Nelson, D. L., McEvoy, C. L., & Schreiber, T. A. (1998). The University of South Florida
word association, rhyme, and word fragment norms. http://www.usf.edu/FreeAssociation
Simmons, S. & Estes, Z. (2008). Dual processes of comparison and integration in similarity and difference. Manuscript under review.
Smiley, S. S. & Brown, A. L. (1979). Conceptual preference for thematic or taxonomic relations: A nonmonotonic age trend from preschool to old age. Journal of Experimental Child Psychology, 28, 249-257.
Tversky, A. (1977). Features of similarity. Psychological Review, 84, 327–352. Wisniewski, E. J. & Bassok, M. (1999). What makes a man similar to a tie? Stimulus
Exp't Task N Min Max M SE N Min Max M SE N Min Max M SE
1a Sim 11 0.00 0.20 0.05 0.02 8 0.37 0.67 0.50 0.04 16 0.73 1.00 0.90 0.02
Dif 13 0.00 0.30 0.12 0.03 7 0.37 0.63 0.46 0.04 13 0.73 0.97 0.89 0.02
1b Sim 11 0.00 0.23 0.07 0.02 4 0.37 0.60 0.52 0.05 20 0.77 1.00 0.92 0.02
2a Sim 30 0.00 0.30 0.09 0.02 4 0.33 0.67 0.51 0.07 21 0.70 1.00 0.89 0.02
Dif 12 0.00 0.27 0.08 0.02 9 0.37 0.60 0.50 0.03 34 0.70 1.00 0.91 0.02
2b Sim 20 0.00 0.20 0.08 0.02 4 0.33 0.43 0.38 0.03 8 0.83 1.00 0.91 0.02
Dif 8 0.00 0.17 0.09 0.02 4 0.57 0.67 0.63 0.02 20 0.73 1.00 0.88 0.02
3 Sim 12 0.00 0.32 0.11 0.03 15 0.35 0.64 0.50 0.03 8 0.68 0.91 0.79 0.03
Taxonomic Mixed Thematic
[image:41.595.71.787.126.281.2]task (Similarity, Difference), Experiment 2a.
Difference
Taxonomic Mixed Thematic Total
Taxonomic 5.45% 3.64% 45.45% 54.55%
Similarity Mixed 1.82% 3.64% 1.82% 7.27%
Thematic 20.00% 3.64% 14.55% 38.19%
[image:42.595.80.451.130.223.2]Difference
Taxonomic Mixed Thematic Total
Taxonomic 0.00% 0.00% 62.00% 62.00%
Similarity Mixed 0.00% 13.00% 0.00% 13.00%
Thematic 25.00% 0.00% 0.00% 25.00%
[image:43.595.81.452.131.223.2]Total 25.00% 13.00% 62.00%
Table 3. Distribution of participants’ choice patterns (Taxonomic, Mixed, Thematic) in each
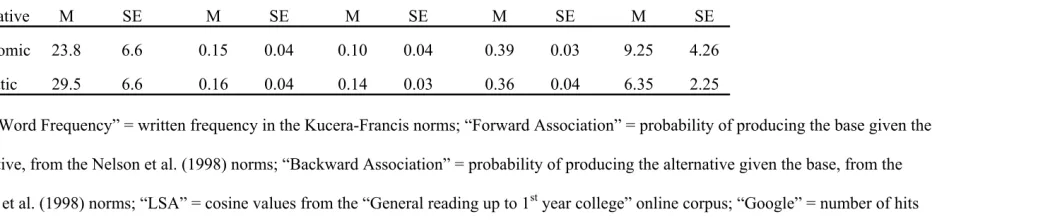
Note. “Word Frequency” = written frequency in the Kucera-Francis norms; “Forward Association” = probability of producing the base given the alternative, from the Nelson et al. (1998) norms; “Backward Association” = probability of producing the alternative given the base, from the
Nelson et al. (1998) norms; “LSA” = cosine values from the “General reading up to 1st year college” online corpus; “Google” = number of hits
(in millions) obtained in a search of “[alternative] [base]” on google.com, data retrieved on 9/21/2007. The taxonomic and thematic alternatives
did not differ significantly in any of these measures.
Alternative M SE M SE M SE M SE M SE
Taxonomic 23.8 6.6 0.15 0.04 0.10 0.04 0.39 0.03 9.25 4.26
Thematic 29.5 6.6 0.16 0.04 0.14 0.03 0.36 0.04 6.35 2.25
Word Frequency Forward Backward LSA Google
[image:44.595.76.627.108.220.2]Base Taxonomic Thematic
bee butterfly honey
bird robin nest
cake cookie birthday
carrot celery rabbit
cow pig ranch
crown hat queen
dog cat bone
dungeon basement torture
dust soot broom
flower plant vase
fur hair coat
jar bottle jelly
knight soldier armor
lamp flashlight desk
monkey primate banana
movie documentary producer
needle pin thimble
net rope fish
oyster clam pearl
pastry tart baker
prison jail criminal
river lake boat
robe cloak bath
sapphire emerald ring
sheep goat wool
ship yacht sailor
shirt jacket tie
smoke smog fire
squirrel rat nut
[image:45.595.72.369.101.542.2]Table 6. Inter-correlations (r) between Thematic preference, NFC, and follow-up questions, Experiment 3.
Thematic Category Feature Scenario Preference Relevance Relevance Relevance
Category
Relevance .17 Feature
Relevance .19 .74*
Scenario
Relevance .32† .42* .32
NFC -.30† .14 .11 .12
Figure 1. Distribution of participants’ choice patterns (Taxonomic, Mixed, Thematic) as a
function of task (Similarity, Difference), Experiment 1a.
31
39
23 21
46
39
0 10 20 30 40 50
Similarity Difference
P
er
cen
tag
e
o
f P
ar
ti
ci
p
an
ts
Figure 2. Proportion of thematic choices in difference plotted as a function of proportion of
thematic choices in similarity, Experiment 1a.
0 0.1 0.2 0.3 0.4 0.5 0.6 0.7 0.8 0.9 1
0 0.1 0.2 0.3 0.4 0.5 0.6 0.7 0.8 0.9 1
Thematic Proportion (Sim)
T
h
e
m
a
tic
P
ro
p
o
rt
io
n
(
D
if
Figure 3. Distribution of participants’ choice patterns (Taxonomic, Mixed, Thematic) as a
function of task (Similarity, Difference), Experiment 2a.
55
27
7 11
38
62
0 10 20 30 40 50 60 70
Similarity Difference
P
e
rcen
ta
g
e
o
f P
a
rt
icip
an
ts
Figure 4. Proportion of thematic choices in difference plotted as a function of proportion of
thematic choices in similarity, Experiment 2a.
0 0.1 0.2 0.3 0.4 0.5 0.6 0.7 0.8 0.9 1
0 0.1 0.2 0.3 0.4 0.5 0.6 0.7 0.8 0.9 1 Thematic Proportion (Sim)
The
m
a
ti
c
P
ropo
rt
ion
(
D
if
Figure 5. Distribution of participants’ choice patterns (Taxonomic, Mixed, Thematic) as a
function of task (Similarity, Difference), Experiment 2b.
62
25
13 13
25
62
0 10 20 30 40 50 60 70
Similarity Difference
P
e
rc
e
n
ta
ge
of
P
a
rt
ic
ipa
n
ts
Figure 6. Proportion of thematic choices in difference plotted as a function of proportion of thematic choices in similarity, Experiment 2b.
0 0.1 0.2 0.3 0.4 0.5 0.6 0.7 0.8 0.9 1
0 0.1 0.2 0.3 0.4 0.5 0.6 0.7 0.8 0.9 1
Thematic Proportion (Sim)
The
m
a
ti
c
P
ropor
ti
on (
D
if
Figure 7. Mean similarity ratings as a function of response group and item type, Experiment 3.
4.93 5.03 5.11
3.04
5.18
6.14
1.00 2.00 3.00 4.00 5.00 6.00 7.00
Taxonomic Participants
Mixed Participants Thematic Participants
S
imila
ri
ty