Improving the dependability of the
temperature build-up sensor system in
the city of Enschede
A Creative Technology Graduation Project
By: David Vrijenhoek S1722107
Supervisors: Hans Scholten & Richard Bults Version: Final version
Abstract
This graduation is concerned with the development of a sensor system which is used for long-term registration of the temperature development of different locations in Enschede in order to see if and where urban heat islands come into existence. Urban heat islands are urban areas which are significantly hotter than similar rural areas. Since urban areas are often heavily populated, the high temperatures are a cause of heat stress. The municipality of Enschede is therefore interested in the size and severity of these urban heat islands in Enschede. Previous graduation projects already proved that a sensor system can be developed to register the temperature development in the city of Enschede. However, the sensor system needs to be dependable to some degree for it to operate on a long-term base. The goal of this graduation project is to improve the design of the sensor system, so it is able to operate dependably on a long-term base.
This goal is achieved by applying the Creative Technology design method. First off,
dependability and systems that are similar to this sensor system were researched. The various stakeholders were interviewed in order to derive their expectations of this sensor system. Furthermore, the context of the deployment of the sensor system was researched. Through this analysis and the conducted interviews, a set of preliminary requirements were crafted. These requirements were then used to specify the design of the sensor system. When the sensor system was realised, it was evaluated in different ways.
Acknowledgement
First of all, I would like to thank my family and friends for supporting me throughout this graduation project. Without all the inspiration and motivation you all gave me, this graduation project would have been a lot harder.
Next I would like to express my gratitude to both my supervisors Hans Scholten and Richard Bults. In the many conversations we had, they never failed to provide me with plenty of
feedback and new inputs. This graduation project would not have been at the level it is now if it were not for them pushing me in the right direction.
I would also like to thank my stakeholders. Rik Meijer and Hendrik-Jan Teekens, the contacts at the municipality of Enschede, provided me with a lot of valuable information and supported this project throughout the process. I would also like to thank Wim Timmermans from the ITC faculty of the University of Twente. My conversations with Wim were always very insightful and he provided me with a lot of valuable information.
Table of content
Abstract... 2
Acknowledgement ... 3
Table of content ... 4
Table of figures ... 8
Chapter 1 Introduction ... 9
1.1 Context and problem statement ... 9
1.2 Research question ...10
1.3 Report Outline ...11
Chapter 2 State of the art ...13
2.1 Urban Heat Islands ...13
2.2 Autonomous environmental monitoring sensor systems ...15
2.2.1 EnskeTemp monitoring system ...15
2.2.2 IEEE 802.15.4 based wireless sensor network for temperature monitoring ...17
2.2.3 Environmental monitoring system by employing WSN on vehicles ...18
2.3 Dependability in sensor systems ...20
2.3.1 Dependability and its attributes ...20
2.3.2 Maximizing dependability ...22
2.4 Expert opinion ...23
2.5 Conclusion ...24
Chapter 3 Methods and Techniques ...26
3.1 Design method ...26
3.1.1 Ideation phase ...27
3.1.2 Specification phase ...27
3.1.3 Realisation phase ...28
3.1.5 Divergence and convergence ...29
3.2 Stakeholder identification and analysis ...29
3.3 Requirement elicitation ...30
3.4 Requirement analysis ...30
3.5 Testing procedure ...31
3.5.1 Testing functionalities first prototype ...31
3.5.2 Testing functional requirements ...32
Chapter 4 Ideation ...35
4.1 Idea generation...35
4.2 Stakeholders ...38
4.2.1 Wim Timmermans ITC ...38
4.2.2 Hans Scholten University of Twente ...39
4.2.3 Rik Meijer Municipality of Enschede ...40
4.2.4 Interest/Influence matrix and preliminary requirements ...41
4.3 Environmental factors ...42
4.4 Conclusion ...43
Chapter 5 Specification ...45
5.1 Requirements ...45
Functional requirements ...45
Non-functional requirements ...46
5.2 Sensors ...47
5.2.1 Temperature sensor ...47
5.2.2 Windspeed sensor ...47
5.2.3 Humidity sensor ...48
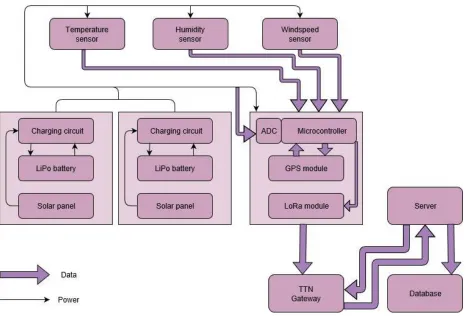
5.3 System architecture ...48
5.4 Software flowchart ...49
Chapter 6 Realisation...52
6.1 First prototype ...52
6.1.1 Casing ...52
6.1.2 Interfacing sensors ...53
6.1.3 Testing prototype ...56
6.2 Second prototype ...57
6.2.1 Casing ...57
6.2.2 Electronics ...57
6.2.3 Testing ...57
Chapter 7 Evaluation...58
7.1 Functional testing ...58
7.1.1 Test setup ...58
7.1.2 Evaluation of functional requirements ...59
7.1.3 Evaluation of non-functional requirements...60
7.2 Stakeholder evaluation ...61
7.2.1 Wim Timmermans ...62
7.2.2 Hendrik-Jan Teekens ...63
7.3 Analysis ...63
7.3.1 Temperature ...63
7.3.2 Humidity ...64
7.3.3 Windspeed ...65
7.4 Conclusion ...66
Chapter 8 Conclusion...68
8.1 Results ...68
8.2 Discussion ...71
Chapter 9 Future Work ...73
9.2 Data ...73
9.3 Communication...74
Reference ...75
Appendix ...79
Appendix A: Interviews ...79
Appendix B: Requirements ...81
Appendix C Evaluation survey ...91
Appendix D: Data analyses sensors ...93
Table of figures
Figure 1: First generation sensor system made by Tom Onderwater [12]. ...15
Figure 2: Second generation sensor system made by Laura Kester [13]. ...16
Figure 3: Sensor node with temperature sensor and IEEE 802.15.4 communication chip [14]. .17 Figure 4: Diagram of the WSN infrastructure [15]. ...19
Figure 5: Creative technology design method [19]. ...26
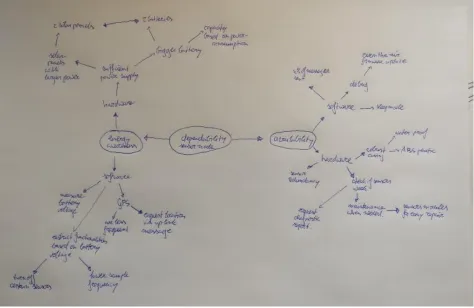
Figure 6: Ideation mind map. ...35
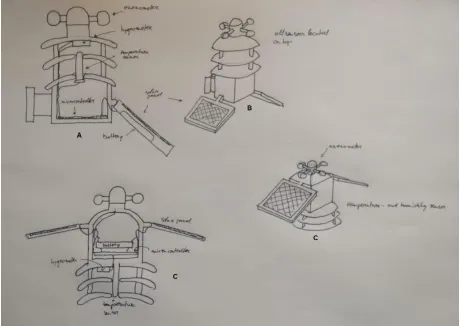
Figure 7:Various sketches of the casing. A: side-view of current sensor system. B: sensor system with two solar panels and sensors on top. C: Sensor system with two solar panels and the radiation shield on the bottom. ...37
Figure 8: Final sketch of the casing ...37
Figure 9: Interest/Influence matrix based on the theory of Mendelow [30]. ...41
Figure 10: Hardware flowchart. ...49
Figure 11: Software flowchart ...50
Figure 12: Design casing. ...52
Figure 13: Schematic electrical circuit. ...56
Figure 14: Deployment of second prototype. ...57
Figure 15: Test setup with Alecto WS-4800. ...58
Figure 16: Plotting the reference and measured temperature. ...64
Figure 17: Plotting the reference and measured humidity. ...65
Chapter 1 Introduction
1.1 Context and problem statement
Global warming is impacting our lives in various ways throughout society. Some more noticeable than others. One of the big issues cities are facing nowadays is the development of zones that are significantly hotter than their neighbouring (rural) areas. These zones are called (urban) heat islands [2] and can be found in urban settings due to fact that urbanised areas are prone to heat up more quickly than areas that are less urbanised.
This effect of urban heat islands poses severe problems related to health issues and
infrastructure within a city. These problems stretch from sleeping less to broken roads due to the heat islands [3]. Because of these problems the municipality of Enschede and the University of Twente are looking into the UHIs in Enschede by means of an outdoor temperature
measurement system. This system is used for a long-term registration of temperature development of different locations in Enschede in order to see where and if UHIs come into existence. The municipality of Enschede is interested in the factors that influence UHIs and wants to tackle UHI related problems.
A proof of concept of such a system has already been made and now the municipality of Enschede and the University of Twente want to scale up the UHI project. In order for the network to be scaled up it requires a certain level of dependability and more functionalities. These are two important aspects, since higher dependability means more and accurate data. This data is vital to understand the development of UHIs in Enschede.
Dependability is defined as a system’s ability to provide a service that can be justifiably trusted [1]. It can also be seen as an integrating concept which involves the following attributes [1]:
❖ Availability
❖ Reliability
❖ Safety
❖ Integrity
❖ Maintainability
A more elaborate definition of these attributes will be provided in chapter two.
The goal of this graduation project is to improve the dependability of the existing sensor system in such a way that it is operational for a period of at least five years while providing reliable data concerning the UHI effect. In order to achieve this goal three basic concepts should be
investigated:
❖ the dependability of the sensor system itself
❖ the dependability of the data gathered by the sensor system
❖ the dependability of the communication of the sensor system with the system’s back-end service
These three components define the overall dependability of the system.
1.2 Research question
In order to achieve the goal set for this project, the following research questions need to be addressed:
How to develop a dependable autonomous sensor system to measure the temperature build-up in the city of Enschede?
For the sake of answering this research question several sub-questions must be addressed. These questions relate to the different aspects of the sensor system in terms of dependability mentioned in the previous section. The first sub-question concerns the dependability of the data of the system. It is important for the system to send data that is dependable. The data should be of such quality that it accurately represents the situation the system aims to measure. Moreover, the data should be ‘complete’ in the sense that it contains samples that are regularly taken. Considering all these facets, the first sub question therefore is:
What does dependability entail in terms of data gathered by the sensor system?
What does dependability entail relating to the sensor system itself?
Lastly, it is also of importance to know about this system’s communication with the backend service. This back-end service consists of a gateway which picks up the sent payload. This gateway will then proceed to send the data to a central server. The payload can be retrieved from this service to be saved in a database. For example: without proper communication the functionality of the system is undependable and therefore useless. It is necessary to investigate the dependability of the communication infrastructure to see what it implies. Hence, the last sub question is:
What does dependability entail in terms of the system’s communication?
1.3 Report Outline
Chapter two describes the state-of-the-art in the field of climate-sensing wireless sensor networks. Background information regarding the dependability of systems is also presented in this chapter. An explanation on why the proposed solution is novel in its field is used to
conclude this chapter.
The third chapter describes the methodology and techniques used in this graduation project. It explains the general structure of the design process in terms of different phases. As well as different techniques that are used throughout these different phases.
The fourth chapter reports on the ideation phase of this graduation project. More information about what the ideation phase entails can be found in chapter three. The various stakeholders are identified in this chapter and through interviews a set of preliminary requirements is crafted. The context of the deployment of the sensor systems is also investigated in this chapter. This all leads to a project proposal. This proposal is specified in chapter five. The preliminary
requirements are converted into system requirements. These system requirements are then categorized in either functional or non-functional requirements. By means of flowcharts the software related processes are specified and clarified. The purpose of this chapter is to exactly establish how the sensor systems should be build.
After the sensor system is realised, it will be evaluated in three different ways. The system’s sensors will be evaluated on their performance. All the must have functional requirements will also be evaluated. Lastly, the sensor system will be evaluated together with the stakeholders. These three evaluations are described in chapter seven.
The conclusion of this graduation project is presented in chapter eight. The various sub
questions (see previous section) will answered first. These answers will then be used to answer the main research question of this graduation project. A discussion of this graduation project is also presented in this chapter.
Chapter 2 State of the art
The aim of this chapter is to provide the reader with some necessary background knowledge. This background knowledge is needed to put some of the discussed concepts into context. Furthermore, the state of the art within the field of autonomous environmental
monitoring sensor systems is presented. Lastly, an expert in the field of temperature modelling was consulted and section 2.4 reports on the results.
2.1 Urban Heat Islands
The UHI effect is part of a complex process which involves both climate factors as well as human factors. This process consists of various drivers that influence each other greatly. Since this process is so complex, it differs greatly from area to area. However, literature states that there are five main factors that play a vital role in the UHI effect [3] [4], namely:
❖ Vegetation and evapotranspiration
❖ Albedo effect of surfaces
❖ Anthropogenic heat production
❖ Amount of greenhouse gasses
❖ Airflow in urban settings
One of the main drivers in the UHI effect is the reduction of vegetation and evapotranspiration in urban settings. Even though all sources agree on this, they do not all agree on what is causing the reduction in evapotranspiration [2], [3], [4], [5], [6], [11]. Evapotranspiration is the sum of all the evaporation of earth surfaces and transpiration of plants. In other words, evapotranspiration uses the heat to evaporate water from the soil and the plants. This heat can be extracted from the setting where the evapotranspiration takes place and in this way, it has a cooling effect on its surroundings. By reducing the amount of water available to evaporate, the rate of
that large grassy areas increase the rate of evapotranspiration [2], [8]. While there is still some speculation about the exact reason of the reduction in evapotranspiration, it is mainly due to the reduction in vegetation and sealing of soil.
Another factor that drives the UHI effect is the low albedo of surfaces. The albedo of a surface is a number between 0 and 1 which corresponds to the reflection rate of incoming solar
radiation. Where 0 means that none of the radiation is reflected and 1 means that all the
radiation is reflected. All the radiation that is not reflected will be converted into heat [3], [4], [6], [9]. The albedo of structures found within an urban setting often have a low value, since they are built with material such as concrete and tarmac. These materials have a low albedo rate and will absorb heat. This heat will cause its surroundings to heat up and therefore contribute to the UHI effect [3], [6], [10]. Mohajerani et al. [4] states that asphalt concrete with a light colour (high albedo) is significantly cooler than asphalt concrete with a dark colour (low albedo) and therefore confirms this fact. All sources agree on this and state that this is one of the main factors responsible for the urban heat islands.
The third factor responsible for the UHI effect is the increasing anthropogenic heat production. This means the increased production of heat due to human activity, such as waste heat from factories or heat as a result of traffic. Literature states that climate control systems, such as air conditioners, play a significant role in the anthropogenic heat production [3], [9]. When the UHI effect is most noticeable, namely during the hot season, the demand for these systems
increases drastically [3], [8], [9]. Although it is not mentioned in all sources, it is rather logical that this results in a worsening of the UHI effect. Other literature also states that traffic is a contributor to the anthropogenic heat production [3], [8], but the consequences of this factor are noticeable all year round. This is not mentioned in other sources, so its contribution to the anthropogenic heat production might be limited. Anthropogenic heat is a source of heat within cities to such an extent that the temperature rises significantly due to this heat.
Whereas Jabareen [8] and Qin [10] argue that traffic within cities causes these emissions to rise. Although not all sources agree on the origin of these greenhouse gases, it is clear that greenhouse gases can be found in large amounts in urban settings and contribute therefore to the UHI effect.
The last factor that contributes to the UHI effect is the insufficient airflow in cities. The airflow in cities is restricted by buildings in such a way that they block the natural occurring wind.
Especially cities with a large number of skyscrapers and other multi-storey buildings suffer from this effect [3], [9]. This factor is not mentioned in all the sources, which might indicate that this factor plays less of a role compared to the other four factors. It is supported by Nuruzzaman [3] and Gunawardena et al. [9], since they mention the infrastructure of a city as being the
restricting factor of airflows. It can be argued that some cities have infrastructure that is counter beneficial for the city’s airflow, while others do not. Nevertheless, the wind is needed to
dissipate the heat coming from roads and buildings. If the city’s airflow is not sufficient, heat will get trapped in the city and contribute to the urban heat islands.
2.2 Autonomous environmental monitoring sensor systems
This section reports on various sensor systems that are similar in nature to the sensor system that will be developed during this graduation project. The first subsection is about the predecessors of this graduation project’s sensor system. The other subsections are about sensor systems that are similar to this graduation project’s sensor system.
2.2.1 EnskeTemp monitoring system
This graduation project aims to deliver the third-generation autonomous sensor system designed by Creative Technology students. This
sensor systems aims to measure various
environmental variables that relate to the UHI effect. The project continues the work done by Tom
[image:15.612.349.537.557.689.2]Onderwater (figure 1) and Laura Kester (figure 2), who made the first and second generation of this system. The three main aspects of these prototypes will be discussed in this section: the software, hardware and data-communication of the systems. The
microcontroller used in both projects is a SODAQ One board which features a GPS module, LoRa microchip and is compatible with the Arduino IDE [12], [13]. This board is powered by a 1200mAh lithium polymer battery, which is charged via a 1W solar panel. The temperature is measured using a DS18B20 temperature sensor, which features a range from -55° to 125° with an accuracy of +-0.5°.
The second-generation sensor system made by Laura Kester also features an WH1080 anemometer made by Froggit [13]. Moreover, it incorporates an SHT15 humidity sensor made by SparkFun [13]. The entire system is placed in a white 3D-printed PLA (polylactic-acid, commonly used plastic for 3D printing) casing, which is made waterproof in order to protect the electronics. The temperature sensor is placed in such a way that it cannot be influenced by factors other than the temperature by means of a radiation shield [12]. In the second-generation system, the anemometer is placed on top of the radiation shield [13].
The software of both these systems is designed with limiting the energy consumption as a priority. Limiting the energy consumption is a priority since the sensor systems feature a limited power source in the form of a solar panel. Limiting the energy consumption is
implemented by means of a sleep function. In the first prototype, the system is woken up from sleep mode every five minutes in order to check its location and temperature. It will then proceed to send this data to the LoRa back-end service. After this is all done, the
system goes in sleep mode again. The second prototype differs from the first one in the sense that it only checks the location every five hours and it
transmits the data every ten minutes instead of five. The
[image:16.612.355.539.355.569.2]GPS-module consumes relatively a lot of power. By checking the location less frequent the second prototype aims to limit the power consumption. Given the fact that sending the data every ten minutes suffices just as well as sending it every five minutes, the send rate is adjusted to limit the power consumption. For more details about the exact processes of the software, the reader is referred to [13, Fig. 9].
The communication of the sensor systems with the back-end service goes via a LoRaWAN network [23] called The Things Network [24]. This network is quite suited for applications such as this one, since data transfer consumes less power compared to other networks without compromising the communication range. However, due to the small transmission bandwidth requirements the network does not allow large data transfers. In Europe, using as spreading factor of 11 and a bandwidth of 125 kHz (SF11BW125) results in a data rate of 440bp/s [24]. The Things Network (henceforth referred to as TTN) allows a maximum duty cycle1 of 1% [12],
which limits the amount of data that can be send significantly. TTN allows for an average of 30 seconds of uplink time per device per day, which is equivalent to 1650 Bytes per day using the SF11BW125 standard. However, in case of [12] and [13] the data rate suffices.
2.2.2 IEEE 802.15.4 based wireless sensor network for temperature
monitoring
Silveira et al. [14] attempts to show that it is feasible to develop a low-cost, low-power wireless sensor network aimed to monitor the temperature. The system utilizes an IEEE 802.15.4 network (LPWAN or low power wide area network) in order to send the data from the sensor system to the gateway, which forms the back-end service. This gateway is connected to the internet via Wi-Fi (IEEE 802.11) and sends the data to a webserver. The advantage of IEEE 802.15.4 is that the network topology is defined by
the application layer of the network [14]. This means that the communication between the gateway and the sensor system can be designed by the system engineers. In case of [14], the communication between the sensor system and the back-end service is similar to that of Tom Onderwater’s [12] and Laura Kester’s prototype [13]. The gateway listens continuously to the network. Which means that the sensor systems save power, since they only need to send data.
[image:17.612.328.538.431.569.2]
1 Indicates the fraction of time a resource is busy [24].
The temperature sensor used in [14] is a LM60 temperature sensor by Texas Instruments [14], which features a range from -40°C to 125°C with a linear scale factor of 6.25mV per °C. The output voltage of the sensor is between 174mV and 1205mV.
The network of this wireless sensor network (WSN) is that of a tree topology. The network consists of end devices (sensor systems), repeaters and gateways. The JN5168-001-M00Z by NXP Laboratories is used as an IEEE 802.15.4 compliant microcontroller, whereas an ESP8266 microcontroller by Espressif is used to connect the system via Wi-Fi to the internet [14].
Contrary to the gateways and repeaters which are powered by net current, the sensor systems are powered by batteries. This means that they can be deployed both outside and inside. However, this particular sensor system is not suited for large scale outdoor deployment. The basic framework conceives a ten-meter communication range, which does not suffice for large scale outdoor deployment [29].
2.2.3 Environmental monitoring system by employing WSN on vehicles
The aim of the project by Jamil et al. [15] is to measure air pollution in cities in order to map the areas that are heavily polluted. The deployed wireless sensor network (WSN)
network is then used to pass the data on to the server.
2.3 Dependability in sensor systems
Section 2.3 reports on dependability in sensor systems. A general definition of what dependability entails is presented in the first subsection. The second subsection is about maximizing dependability by implementing a variety of methods in the system.
2.3.1 Dependability and its attributes
Dependability is defined as a system’s ability to provide a service that can be justifiably trusted. It can also be seen as an integrating concept which involves the following attributes [1]:
❖ availability
❖ reliability
❖ safety
❖ integrity
❖ maintainability
❖ confidentiality
Availability is defined as the readiness of the system for the correct service, so the percentage of time when a system is functional [16]. A system needs to be ready to perform a certain task to such an extent that it can be trusted that it will always perform this task as it should be.
The reliability of a system means the degree of continuity of the correct service, so the
probability that a system is functional during mission time [16]. This means that a system needs to guarantee it can deliver a correct service continuously in order to be fully reliable.
The safety of a system protects the users and environment by averting potential catastrophic consequences. A system should prevent itself from entering a state with potential danger and should therefore be robust.
A system’s integrity concerns its ability to avoid improper system alterations. Alterations done to the system due to malfunctions are considered improper and need to be avoided. These
alterations tend to cascade a system into a state where the system does not function properly anymore.
which a system is accessible for maintenance and the other is with what ease a system can be repaired in terms of complexity.
Lastly, a system’s confidentiality is the absence of unauthorized disclosure of information. This means that data generated and used by the system cannot be viewed by other parties without the system’s consent.
Security in a system is the composite of multiple of its dependability aspects. Security is the combination of confidentiality, integrity and availability [1]. Confidentiality is of the utmost importance for a system’s security because it prevents unwanted disclosure of information. The availability attribute means that a secure system should be available for authorized actions only and the integrity attribute means the absence of unauthorized system alterations.
The energy-awareness of a system can be seen as a composite of the reliability and availability aspects. In order for the system to be ready for a correct service, it needs to be able to monitor and manage its energy consumption. For the system to be reliable, the system should possess enough energy in order to guarantee the continuity of the correct service.
In order for a system to be considered dependable, a variety of means are developed in order to attain the attributes of security and dependability. These means aim to tackle the various faults, errors and failures in a system. These means consist in four general categories. Namely [1]:
❖ Fault prevention
❖ Fault tolerance
❖ Fault removal
❖ Fault forecasting
Fault prevention concerns the system’s ability to prevent faults from happening. Whereas fault tolerance means providing the system with the ability to deliver a service in presence of faults without compromising its service. If a system is able to remove faults and decrease their severity, then a system features sufficient fault removal means. When a system is able to forecast faults, analyse current faults and determine the consequences of faults, then this system suffices with regard to the fault forecasting means.
system. In order to prevent these threats from happening, a system features various means that are concerned with the prevention, removal, tolerance and forecasting of faults.
2.3.2 Maximizing dependability
As stated in the previous section, the various means to attain the different attributes of dependability can be categorized in four major categories. Fault tolerance means can be seen as means for both error detection and system recovery [1]. Where error detection can happen during the performance of a service or prior to it. System recovery can be split up in error handling and fault handling with the difference being that error handling eliminates errors from the system and fault handling prevents faults from happening. Error handling is established by either going to a previous stable state or going to a new state. These two are not mutually exclusive, a system may attempt to try both. Error handling may also be established by
incorporating compensation for errors into the system. Fault handling may occur by diagnosing and isolating faults in the system. In order to prevent these faults, the system may reconfigure or reinitialize itself.
Implementing these means for fault tolerance in a system depends on the assumption of faults that might occur in a system. A widely used method to achieve fault tolerance is to perform computation multiple times through multiple channels. This method is only effective for subtle faults though, via a method called rollback [17], [18]. Not all fault tolerance methods are equally effective, hence the degree of effectiveness in fault tolerance means is called the coverage [1]. Failing to achieve proper fault tolerance often depends on the wrong assumption of faults that might occur.
Removing faults in a system can happen either while the system is used or during the
development of the system. In case of the latter, three steps are applied: verification, diagnoses and correction [1] [18]. Verifying whether or not the system complies with the set conditions will determine if the other two steps have to be taken. If a system does not comply with the
verification conditions, the system needs to be diagnosed in order to establish the exact nature of the problem. Naturally, problems need to be corrected properly. In an iterative motion the system should be verified once again to see whether or not it complies with the verification conditions. Verifying a system can be done in either a static or dynamic setting, where the system either executes a function or it will not.
several ways [1]. The first method is called the oracle problem [1]. In this case the system will be observed while it operates in order to see whether or not it complies with the verification conditions. If a system is compared to another system which has been known to comply with the set conditions, then this is called golden unit testing [1]. The third known method of testing is called the back-to-back testing [1]. This means testing a system twice on a certain condition to see if the result is the same. All these methods are frequently used in combination with each other. Removing faults while the system is in use usually happens during maintenance in either a preventive way or a corrective way.
Forecasting faults in a system can be done in an evaluative way [1], [17]. The qualitative and quantitative aspects of this evaluation will result in an analysis from which plausible faults can be derived. This forecasting of faults is usually done while developing a system and consists of two phases, the modelling of a system followed by testing a system. Modelling of a system can be done by either physical faults in a system, developmental faults or a combination thereof [17].
2.4 Expert opinion
An interview was conducted with dr. ir. Wim Timmermans, who specializes in modelling temperature build-up, in order to gain some insights from an expert’s perspective. The first thing he mentioned is that a lot of variables associated with urban heat islands change very rapidly. For example, the temperature very close to a surface changes with a frequency of about 50Hz and can fluctuate up to 2 degrees Celsius. Fluctuations that big are considered outliers. Therefore, the mean temperature will be significantly more stable if the mean is taken over a longer period of time. In terms of taking measurements it always is a trade-off between the sample frequency and the data rate of the communication network. More frequent
Another aspect Timmermans mentioned is the fact that these sensor systems should be able to operate for an extended period of time in order to prove valuable.
2.5 Conclusion
Several topics relating to this project were investigated in this chapter. First of all, the five main drivers behind the urban heat island effect were identified:
❖ the reduced evapotranspiration
❖ low albedo
❖ high anthropogenic heat production
❖ increased amount of greenhouse gases
❖ the insufficient airflow
Moreover, the systems designed by Tom Onderwater [12] and Laura Kester [13] were explored. The various hardware, software and communication aspects were covered and reported on. Similar systems made by Selveira et. al. and Jamil et. al. were looked into in a similar way as well. The main difference between this graduation project and these projects is that this project’s deployment is longer than that of the similar system. This means that extra features need to be incorporated in this design in order for the system to operate in a reliable manner. Similarities between this project and similar projects are for example that the sensor systems only send data and that the gateways will listen for any network activity. This means that quite a lot of power is saved on the sensor system’s side. Other similarities are that networks (e.g. IEEE 802.15.4) are chosen that do not allow for a high data rate. These networks are really suited for applications such as this one because they are very efficient.
The different aspects of dependability were also examined. Dependability can be seen as an integrating concept of the following attributes:
❖ availability
❖ reliability
❖ safety
❖ integrity
❖ maintainability
❖ energy-awareness
❖ confidentiality
These attributes can be used to achieve a high degree of dependability by means categorized in four major groups. Fault prevention, fault tolerance, fault removal and fault forecasting means can be used to increase the level of dependability within this project’s system. What these means will exactly entail in terms of design choices will be investigated further in upcoming chapters.
Chapter 3 Methods and Techniques
Chapter three describes the various methods and techniques that are used throughout this graduation project. An overview of the design method specific for Creative Technology is given. Moreover, different techniques are presented that are used to derive the stakeholders, formulate requirements and realize concepts. The chapter concludes with a section that describes the testing procedure.
3.1 Design method
Given the fact that this project is a creative technology graduation project, the creative technology design method (figure 5) will be used. This method of designing is centred around the idea of an iterative process and combines several methods of similar disciplines into one coherent method especially suited for creative technology (henceforth referred to as CreaTe). The CreaTe design method comprises of four phases. Namely, the ideation phase, the specification phase, the realisation phase and the evaluation phase [19]. Even within these four phases evaluation and feedback play an important role in order to maximize the results of each phase.
Iteration plays an important role in the CreaTe design method as well, since it allows for quickly identifying flaws in the design. Each iteration of prototype is tested on a number of categories. The results of this testing will be implemented in the next prototype. The goal of this iterative designing
[image:26.612.307.565.270.650.2]Features that are implemented correctly will be passed on to the next iteration (prototype), whereas others need to be improved. The final iteration will be a fully functional prototype.
3.1.1 Ideation phase
The first phase in the CreaTe design method is the ideation phase. The goal of this phase is to generate a sufficient number of ideas in order to derive some preliminary
requirements for the intended product. In this phase related work is studied and future users are interviewed/observed in order to define the problem clearly, to acquire relevant information and to derive requirements. These early ideas will then be evaluated with the clients/users.
Conclusion of this phase will yield a more clearly defined project idea as well as a set of preliminary requirements. These results will then be used in the next phase.
This implementation of the ideation phase in this graduation project starts with generating ideas. Using various brainstorm methods (e.g. mind maps) will be used to generate new concepts that can be implemented in the system. The casing designed by Laura Kester [13] will be examined in order to find aspects that can be improved in her design.
Moreover, the different stakeholders will be identified and analysed. An interview will be conducted with each of these stakeholders, in order to find out what their expectations of the sensors system are. These expectations will be converted to a set of preliminary requirements that can be used in the specification phase.
Lastly, the different environmental factors will be examined. These environmental factors will tell something about the context of the deployment of the sensor systems. In order for the sensor systems to operate in this context, the sensor system needs to be able to handle these factors. An example of such an environmental factor is the average precipitation in the city of Enschede. This information will be used in the specification phase to derive a set of system requirements.
3.1.2 Specification phase
even more clearly. This will result in a set of requirements for the product and a specified product idea.
The specification phase of this graduation project starts with converting the set of preliminary requirements derived in the ideation phase to a set of system requirements. TTN guidelines, as well as the environmental factors and the initial brainstorm, pose a source which can be used to derive additional system requirements. The different sensors that will be used will be examined as well in order to see if they comply with the system requirements.
The software and hardware related processes will also be described in the form of flowcharts. The flowcharts provide a clear depiction of the flows of information and energy between the different subsystems. Additionally, the processes that happen in the software domain of the sensor system can be illustrated using flowcharts as well. These flowcharts show the interaction between different subprocesses in the software.
3.1.3 Realisation phase
In the third phase the project idea will be realized in the form of a functional prototype. Therefore, this phase is called the realisation phase. The product will be broken down into several components, which can be separately tested and evaluated on their specific task. When these various components are integrated into one prototype, the functional requirements of the product can be tested.
The realisation phase of this graduation project consists of building the casing, testing and interfacing all the sensors and testing the software. When all these three aspects suffice, they can be integrated in a functional prototype.
3.1.4 Evaluation phase
The last phase is called the evaluation phase. In this phase the prototype will be evaluated in order to see if the set requirements derived in the ideation phase are met. The preferred method of evaluating involves a great deal of user testing. Usually the functional requirements are already evaluated in the prior phase. However, these requirements might also be subjected to evaluation in this phase. Often the stakeholders are included in these
The sensor system will be evaluated by testing if the requirements specified in the specification phase are met. The system will be tested for accuracy and consistency. The sensor system will also be evaluated by the various stakeholders in order to see if the prototype meets their expectations.
3.1.5 Divergence and convergence
In the CreaTe design method the different phases can either be divergent in nature or convergent. A divergence phase will always be followed by a convergence phase. Divergent phases are phases that offer room for ideas to develop. The starting point is a question or concept from which the design space can be determined and defined. Because of this divergence unexpected solutions might present themselves. In order to formulate a definitive solution, the design space needs to be narrowed down again in the convergence phase. Every design decision the designer makes will narrow this design space until a tangible solution is reached. Divergence and convergence phases are commonly used in design disciplines, but in case of the CreaTe design method these phases are embedded in the ideation, specification and realisation phase. Each of these three phases contains a set of defined items [19] which can be the starting point of a divergent process or the end of a convergent process.
3.2 Stakeholder identification and analysis
resources from the baseline stakeholders. Satellite stakeholders can interact in a variety of ways with the baseline stakeholders but are characterised by the fact that their interaction has little impact on the baseline stakeholders. The process of identifying these three types of stakeholders will be repeated with the newly identified stakeholders until a web is formed which describes all the interaction between the stakeholders.
The types of stakeholders this graduation project will focus on are the supplier and client stakeholders. There will be client stakeholders given the fact that this graduation project is part of a larger project between the municipality of Enschede and the University of Twente. Supplier stakeholders will be identified in order to use their knowledge in their respective field in
developing the sensor system. In order to determine the importance of each stakeholder, an interest-influence matrix will be constructed using the method described by Mendelow [30].
3.3 Requirement elicitation
In order to elicit preliminary requirements from the stakeholders, a number of methods can be used. Techniques such as interviews, questionnaires and brainstorm sessions with the stakeholders are commonly used to derive these preliminary requirements. Because of the difference in knowledge between the various stakeholders, interviews will be used in this graduation project. The difference in knowledge can either be the difference in knowledge between the developer and the client stakeholders (i.e. the developer has more knowledge about sensor systems such as this project’s) or the difference between the developer and the supplier stakeholders (i.e. the supplier stakeholders supplies knowledge to the developer). These interviews will feature a semi-structured base in order to allow follow up questions. The interviews need some structure in order to guide the stakeholders in the right direction. The answers to these structured questions then offer room for further questioning. In this way a lot of qualitive data can be retrieved.
3.4 Requirement analysis
are identified, they will be analysed using the MoSCoW categorization method [31]. Although all requirements are important, it is necessary to prioritize and categorize them in order to deliver the maximum benefit to the project. If the most important requirements are met first, the greatest benefits to the projects are delivered early in the process. This helps stakeholders to better understand the impact of requirements and it helps in deciding what category a requirement falls. MoSCoW stands for Must haves, Should haves, Could haves and Won’t haves. The requirements that fall in the must haves category have the highest priority and must be implemented in the design within the set project duration. Since it is critical that these
requirements are implemented, the project can be regarded as a failure if one or more of the
must have requirements are not implemented. The should have requirements are also important to the project, but it is not necessary that they are implement in the project duration. They can be implemented in future deliveries and are therefore not critical to success. Could have
requirements are labelled desirable but not necessary for the project. They are usually
implemented if time and resources permit it. Won’t have requirements have the lowest priority and are therefore deemed irrelevant for the project.
3.5 Testing procedure
This section describes the different testing procedures that will be used to test the functionalities of the sensor system. In the first subsection the general testing procedure is presented which tests the sensor system for its basic functionalities. If the sensor system passes these tests, it can be regarded as functional. In the second subsection a testing procedure is presented which tests the sensor system on its functional and non-functional requirements. These test results will be used to evaluate the sensor system with the
stakeholders. The testing procedures are kept general. The proper amount of times and the period of testing will be determined, when evaluating the sensor system.
3.5.1 Testing functionalities first prototype
In order to test the quality of the casing, the casing needs to be closed as it would be when deployed. A paper towel will act as the electronics. To check if the casing is waterproof, it will be exposed to water for a period of time. This can be done by pouring water over it. After the period of time the casing will be opened and the paper towel is inspected. If the paper towel remained dry, it is safe to assume the casing passed the quality test. If so, the casing can be regarded as waterproof. Given the fact that the casing is protected against low pressure water jets, an IP66 code would be applicable to the system [32].
To test the functionality of the sensor and the transmission of the data, the sensor system needs to be deployed outside for a period of time. While being deployed, the data will be checked several times for a period of time. By inspecting the data, both the transmission quality as well as the sensor functionalities can be tested. The data from the last received message needs to be converted from hexadecimal to ascii during the test period. The quality of the transmission can be derived instantly if the message is converted correctly. By comparing the sensor data with official weather station data of the KNMI, the functionality of the sensors can be tested. If these sensor readings are similar to the KNMI’s readings, the functionality of the sensors is deemed sufficient. The range of sensor values that is regarded as similar to the KNMI’s values is established on site. The accuracy of the sensors will be established in later iterations; hence it is not necessary to check the sensors in-depth in this stage of the project. It suffices to check if the sensors are functional. Even though comparing the sensor data with data yielded from the KNMI implies co-location by deploying the sensor system next to the KNMI’s weather station, this is not necessary. The sensors will be selected on their accuracy and resolution. If the sensors are tested before they are implemented in the sensor system, it can be assumed that they work according to what the manufacturer guarantees. They will be tested in a later testing procedure in order to establish the sensors true accuracy.
3.5.2 Testing functional requirements
The second prototype will be tested on the functional requirements. These requirements are categorized using the requirement analysis as described in section 3.4. The only
requirements that must be implemented in this project are the must have requirements. Therefore, only these requirements will be tested.
Some of these requirements will be tested the same way Laura tested them, since these
To establish the accuracy of the sensors, they need to be compared to reference sensors. This is done by setting up the sensor system next to the respective reference sensors. These reference sensors require an accuracy of at least the required accuracy of the sensor system’s sensors. Two hours of sensor data is needed to compare this to the reference sensor data. The test is considered a success if a certain percentage of the sensor readings from the sensor system differ less than or equal to the required accuracy from the reference sensor. This way the accuracy of every sensor can be established.
In order to test the accuracy of the GPS-module, a number of locations are required with known GPS coordinates. When the sensor system is placed at such a location, the sensor system needs to derive its location for a period of 30 seconds. Repeat this process five times. The requirement is met if a certain percentage of the readings differ no more than 20 meters from the known location.
The duty cycle is determined by examining the metadata of the sensor system. The sensor system needs to operate for a period of three hours. The metadata contains information about the up-link. The duty cycle can then be calculated using this formula: 𝐷 = 𝑃𝑊
𝑇 ∗ 100%. PW is the
pulse width and T is the total period of the signal. The average up-link time needs to be calculated in order to derive the duty cycle. With a 1% duty cycle, 1650 bytes can be send by one sensor system per day. The requirement is met if the duty cycle is equal to or less than the specified duty cycle which means that the amount of data send by one sensor system should not exceed the 1650 bytes per day.
Chapter 4 Ideation
This chapter focuses on gathering the user requirements for the system and generating ideas and concepts. The different stakeholders will be interviewed in order to derive their expectations of the system. Because of the duration of this graduation project, the aim is to increase the dependability of this system in terms of its availability and energy-awareness. Even though the other attributes are also important to the system’s dependability, they are regarded as being outside of this graduation project’s scope.
4.1 Idea generation
[image:35.612.72.546.373.681.2]Creating a certain level of dependability in a sensor system can be a process which involves both software related concepts as well as hardware related concepts. In order to come up with these various concepts a mind map was constructed (figure 6). Such a mind map allows for the generation of a lot of ideas. By mapping these ideas to other ideas, an elaborate map can be constructed containing a variety of concepts.
The casings of the previous projects were investigated as well. Given the fact that this
graduation projects continues the work done by Laura Kester, the casing designed by her will be used as reference. Even though her casing would suffice for this project (it proved itself worthful; for more information see [13]) several of its features were investigated to see if there was room for improvement. First of all, the number of solar panels is likely to be changed in this graduation project. Due to fault tolerance, a solar panel with more power is preferred. This can also be implemented by incorporating two solar panels (figure 7B), which adds some form of
redundancy to the sensor system. Placing these two solar panels on opposite sites will result in more exposure to the sun, because the effect of shade on these solar panels is less. Positioning the solar panels on one side of the casing yields an even greater exposure to the sun (figure 8). The light will hit the solar panels with a certain angle from this position, which will maximize the amount of power generated throughout the day.
Figure 8: Final sketch of the casing
4.2 Stakeholders
This section reports on the interviews conducted with the stakeholders. The importance of these stakeholders is depicted in an interest/influence diagram. Preliminary requirements were derived from these interviews and can be found in a table at the end of this section.
4.2.1 Wim Timmermans ITC
In order to gain more insights into Wim Timmermans’ expectations of the to-be-build sensor system, a semi structured interview was conducted (which can be found in appendix A). The various aspects of dependability were presented and explained to Wim. Even though Wim recognizes that all attributes are of importance, the focus of the interview was shifted to the two attributes mentioned in the introduction of this chapter: availability and energy-awareness. In terms of availability Wim could not give a specific percentage. He mentioned that it depends on the variable that is being measured (air temperature, windspeed and humidity) and the sample frequency. For example, if the air temperature is measured every day then it is
important that the system is available 100%. However, if the air temperature is measured every second then the availability can be significantly lower.
According to Wim the air temperature is the primary variable, followed by the windspeed and then the humidity. This means that the availability in terms of these three variables can be different and that the temperature sensor demands the highest availability.
Wim also mentions that the quality of the data should be such that it accurately represents the situation on site. Wim was asked if the specifications of the sensors used in the 2nd generation
sensor system made by Laura [13] would suffice. According to Wim, these specifications still meet the required specification in order to accurately yield data. This means that the air
temperature should be measured with a 0.5°C accuracy, the windspeed with a 0.1m/s accuracy and the humidity with a 3% accuracy. The location derived using GPS should be accurate up to 20 meters. The location of the sensor system is important since the measurements taken by the sensor system tell something about the situation on site. This means that the location needs to be constant with a deviation of 20 meters.
should be send either every half hour, hour or day for it to be useful to check climate-related models. Multiples of these time intervals are also allowed, since the data can still be formatted to fit in these time intervals. This way a dataset can be made that uses the proper time intervals to verify these climate-related models. One value per time unit (i.e. half an hour) will suffice to depict the situation. This value can either be the mean taken over this half hour or one value.
4.2.2 Hans Scholten University of Twente
Hans Scholten is an expert in the field of Wireless Sensor Network (WSN) and was interviewed in order to derive requirements that are common in similar systems. Since Hans already has extensive knowledge in the field of dependability in sensor systems, the conducted semi-structured interview (appendix A) focussed on the two attributes of dependability that will be implemented in this graduation project. Hans’ input with regard to these two attributes will yield requirements that can be seen as standards in similar systems.
The first thing Hans mentioned is that an availability rate of 90% suffices. In terms of time this means a maximum downtime of 40 days per year. This means that the sensor system might not be available for several days at once. The gap between two moments of availability is therefore too large for this project, since such gaps will result in poor data. However, if the time window is changed, a 90% availability rate does suffice. Therefore, in terms of this graduation project, the sensor system should have an availability rate of 90% per day.
When it comes to the energy-awareness attribute of this project, Hans notes that a system such as this one should be energy autonomous. This means that the system should provide its own power and maintain a sustainable power consumption. Sustainable power consumption means that the system does not consume more power than it is able to generate. By doing so, the system will sustain adequate power levels and can therefore function properly.
According to Hans a system such as this one does not need scheduled or preventive
windspeed, air temperature and humidity) this poses no problems, since they are used
frequently when the sensor system is deployed. The GPS module is not needed frequently and should therefore be tested every day to see if it works properly.
Another thing Hans mentions is the fact that the data yielded by the sensor system might be compromised by several factors. He notes that the battery level might interfere with
functionalities of the sensors. If the battery’s voltage is not sufficient, the sensor readings might not be accurate, since the sensors only work properly within a certain range of voltage. The location of the sensor system is also important. This means if the sensor system is moved too much the data does not depict the correct situation, since it depicts the situation of another location. Combining this means that the sensor system should take into account the location and battery level and label the data accordingly with a data quality stamp. If the location is changed too much (20 meters) the sensor system should give a warning about the quality of the data. In case of a low battery level, the system should do the same. The user of the data should be notified about the fact that the data might not be accurate.
4.2.3 Rik Meijer Municipality of Enschede
Rik Meijer works for the municipality of Enschede and he is on behalf of the municipality involved in the project of the municipality of Enschede and the University of Twente. This
graduation project aims to contribute to this joined project. Prior to the semi-structured interview, Rik was informed about the various aspects of dependability and what they mean in terms of this project. The questions of the interview can be found in appendix A.
The goal of the municipality is to gain insights in the temperature distribution in the city of Enschede. Within the scope of the current project, this means comparing data of different locations. Eventually the overall goal (for future projects) is to predict what this heat distribution means for the citizens of Enschede. For example, how they perceive the temperature and if it is perceived as a nuisance.
One of the sources the municipality uses right know is the klimaateffectatlas [25]. This atlas lacks detailed information on a local level and therefore the municipality is looking into ways to yield more precise and detailed data of Enschede.
In terms of availability Rik Meijer mentions that a 90% availability rate per day suffices. However, he also mentions that large gaps in the dataset are not desired. It would pose a problem for him if the sensor system is not available 10% of the day in a consecutive manner. Meaning that the sensor system is available for 90% of the day and unavailable for the
be precise up to a hundredth of the measured unit (i.e. 18.52°). Climate-related policies will not be based on such precise data. Hence the resolution of the current sensors suffices.
4.2.4 Interest/Influence matrix and preliminary requirements
[image:41.612.82.293.259.456.2]This section reports on the relationship between the various stakeholders in terms of interest and influence in the project. The matrix (figure 9) consists of four quadrants that depict the low interest/low influence stakeholders as well as the low interest/ high influence, high interest/low power and high interest/high influence stakeholders.
Figure 9: Interest/Influence matrix based on the theory of Mendelow [30].
The following table contains the set with preliminary requirements. The requirements are described and categorized. The source of the requirement is also mentioned.
NR. PRELIMINARY REQUIREMENT SOURCE CATEGORIE
1 The sensor system should be able to measure three variables (temperature, windspeed and relative humidity) with accuracy as specified in previous prototype made by Laura [13].
Wim Timmermans Availability
2 The sensor system should be able to derive its location with an accuracy of 20 meters.
3 The sensor system should be able to send data every half hour.
Wim Timmermans Availability
4 The sensor system should not allow for large gaps in data due to unavailability.
Wim Timmermans & Rik Meijer
Availability
5 The sensor system should be available 90% of the day.
Hans Scholten & Rik Meijer
Availability
6 The sensor system should be energy autonomous.
Hans Scholten
Energy-awareness 7 The sensor system should be able to
operate without needing scheduled maintenance.
Hans Scholten Availability
8 The sensor system should be able to test if the various subsystems (i.e. sensors) still function properly.
Hans Scholten Availability
9 Location and battery-level might interfere with the data quality, the user should be made aware of this by the sensor system.
Hans Scholten Availability
10 The sensor system should be able to measure the previously mentioned three variables with a resolution of one
decimal.
Rik Meijer Availability
4.3 Environmental factors
Enschede’s climate is described as a moderate sea climate, which means that the winters and summers are mild in nature. Compared to climates situated inland, the winters are less cold and the summers are cooler. The lowest average temperature per day in Enschede (2018) was -5.2°C, while the highest average temperature per day was 28.9°C. These temperatures are daily averages, which means that the temperature can be either higher or lower on specific moments. In 2018 the highest measured temperature was 35.7°C and the lowest registered temperature was -9.6°C.
Given the fact that Enschede is situated quite far from the sea, the average windspeed is lower compared to coastal cities. The average windspeed per hour is between 1.6m/s and 5.5m/s, although some gusts of wind can reach speeds of 23m/s (82.8 km/h). On average, the fastest gust of wind per day reaches a speed of 10.2m/s (2018).
The relative humidity is on average between 56.22% and 92.80% per day. The maximum
relative humidity measured in 2018 was 99%, while the minimum relative humidity was 18%. On average the annual precipitation in Enschede is 750mm with a maximum hourly precipitation of 21.8mm. However, precipitation levels can reach up to 100mm/hour at specific moments. The amount of sunlight in Enschede is on average 8 hours per day during the winter and 16 hours per day during the summer.
4.4 Conclusion
In this chapter the various stakeholders were identified and interviewed in order to derive a preliminary set of requirements. The environmental factors that are of influence when the system is deployed were investigated and the possibilities within the design were addressed as well. This resulted in a more precise project description.
Chapter 5 Specification
In chapter five the various aspects of this graduation project will be specified. The preliminary requirements from the ideation phase (chapter four) will be formulated in a system-oriented way and can thus be categorized as functional or non-functional. The different sensors are discussed in this chapter as well. Moreover, the various processes that are involved in functionalities of the sensor system are displayed as flow diagrams.
5.1 Requirements
Both the functional and the non-functional requirements are given in this section. They are derived from the user requirements resulting from chapter four. All the requirements are described in convenient tables that break down the requirements in different sections. The requirements are described using a general description, the rationale behind the requirement, the source and the requirement is tested. The requirements are also categorized using the MoSCoW method (section 3.4) and the priority is mentioned in each table. Possible conflicts with other requirements are also described, as well as the attributes used by the requirement and its value. All the requirements can be found in Appendix B. A short summary of the requirements is provided below:
Functional requirements
The system must Source
Be able to measure the relative humidity 1, 3 and 5 Be able to measure the air temperature 1, 3 and 5 Be able to measure the windspeed 1, 3 and 5 Be able to derive its location 1 and 3 Be able to send a payload every 30 minutes 1 Be able to test if the GPS-module still
functions
2
Be able to label the data with a quality mark 2 Be able to send the payload within a 1% duty cycle
Be able to send payload with a size of 21 bytes
4
The system could
Be able to enter a diagnostic mode 2
Table 2: Analysed functional requirements.
Non-functional requirements
The system must Source
Be attachable 6
Be available 90% of the day 2
Be energy autonomous 2
Be able to operate in temperatures of -25°C minimum
5
Be able to operate in temperatures of 50°C maximum
5
Be able to operate in a humidity of 0% minimum
5
Be able to operate in a humidity of 99% maximum
5
The system should
Be able to withstand precipitation of 100mm/hour
5
[image:46.612.72.541.224.581.2]Be able to withstand wind gusts of 12 Bf. 5 Have a high albedo factor (i.e. light colour) 6 Have a durable casing of ABS or PETG 6
Table 3: Analysed non-functional requirements.
5.2 Sensors
This section contains information about the different sensors that will be used. A general overview of the advantages of different types of sensors is given. Also, the functional
requirements that relate to the to-be-measured variables are linked to the different sensors.
5.2.1 Temperature sensor
A digital temperature sensor is preferred over an analog sensor when it concerns this graduation project. Digital temperature sensors return the measured temperature digitally, which means that the microcontroller does not need to process data in order to retrieve the correct temperature. In case of the analog sensors, the microcontroller would have to process analog values in order to derive a usable temperature value. This means that the sensors need to be calibrated. Digital temperature sensors have the advantage that (most of them) are calibrated by the manufacturer. The electronics embedded in the sensor do the data-processing and return the temperature.
The temperature sensor needs to be able to accurately measure temperatures in the range of -25°C and 50°C. By doing so it should return the temperature with an accuracy of ±0.5°C (see Appendix B, functional requirement nr. 2).
5.2.2 Windspeed sensor
A mechanical contact closure sensor will be used to measure the speed of the wind. Such a sensor closes a switch every time it rotates. Often enough, this is done by a reed switch which closes when a magnet passes by. This magnet is embedded in the rotating part of the sensor and this rotating part is moved by the wind. The reed switch can be found in the static part of the sensor. By measuring the amount of pulses per second, the rotation can be determined by a microcontroller. This rotation is then used to calculate the windspeed.
The advantages of such a sensor is that it is able to accurately measure the windspeed at both low speeds as well as high speed, while being relatively simple and cheap. Because a constant windspeed will return a constant amount of pulses per second, the windspeed sensors of this type are relatively easy to calibrate.
The windspeed sensor needs to be able to accurately measure windspeeds in the range of 0 to 10 Bf. peak speed. This means that the measurement range is between 0m/s and
5.2.3 Humidity sensor
Like the temperature sensor, a digital humidity sensor is preferred over an analog one. The main advantage of such sensors is that they are calibrated by the manufacturer. Most humidity sensors are either based on capacitance or resistance. In case of capacitive humidity sensors, the capacitance changes relative to the humidity. The main advantage of such sensors is that they are very consistent. Resistive humidity sensors measure the humidity by monitoring the impedance of the sensor. This impedance changes based on the humidity. Given the fact that humidity is related to the temperature, most humidity sensors also feature a temperature sensor. Either one of the humidity sensor types is suitable for the application of this graduation project.
The humidity sensor needs to be able to measure the relative humidity in the range of 15% to 99%. The humidity sensor must do so with an accuracy of ±3%.
![Figure 1: First generation sensor system made by Tom Onderwater [12].](https://thumb-us.123doks.com/thumbv2/123dok_us/9656864.467676/15.612.349.537.557.689/figure-generation-sensor-tom-onderwater.webp)
![Figure 2: Second generation sensor system made by Laura Kester [13].](https://thumb-us.123doks.com/thumbv2/123dok_us/9656864.467676/16.612.355.539.355.569/figure-second-generation-sensor-laura-kester.webp)
![Figure 3: Sensor node with temperature sensor and IEEE 802.15.4 communication chip [14]](https://thumb-us.123doks.com/thumbv2/123dok_us/9656864.467676/17.612.328.538.431.569/figure-sensor-node-temperature-sensor-ieee-communication-chip.webp)
![Figure 4: Diagram of the WSN infrastructure [15].](https://thumb-us.123doks.com/thumbv2/123dok_us/9656864.467676/19.612.82.518.90.311/figure-diagram-wsn-infrastructure.webp)
![Figure 5: Creative technology design method [19].](https://thumb-us.123doks.com/thumbv2/123dok_us/9656864.467676/26.612.307.565.270.650/figure-creative-technology-design-method.webp)
![Figure 9: Interest/Influence matrix based on the theory of Mendelow [30].](https://thumb-us.123doks.com/thumbv2/123dok_us/9656864.467676/41.612.82.293.259.456/figure-influence-matrix-based-theory-mendelow.webp)