Ames Laboratory Conference Papers, Posters, and
Presentations
Ames Laboratory
2003
Dynamic Response in the Low-kHz Range and
Delta-E Effect in Ferromagnetic Shape Memory
Ni-Mn-Ga
LeAnn E. Faidley
Ohio State University
Marcelo J. Dapino
Ohio State University
Gregory N. Washington
Ohio State University
Thomas A. Lograsso
Iowa State University, [email protected]
Follow this and additional works at:
http://lib.dr.iastate.edu/ameslab_conf
This Conference Proceeding is brought to you for free and open access by the Ames Laboratory at Iowa State University Digital Repository. It has been accepted for inclusion in Ames Laboratory Conference Papers, Posters, and Presentations by an authorized administrator of Iowa State University Digital Repository. For more information, please [email protected].
Recommended Citation
Faidley, LeAnn E.; Dapino, Marcelo J.; Washington, Gregory N.; and Lograsso, Thomas A., "Dynamic Response in the Low-kHz Range and Delta-E Effect in Ferromagnetic Shape Memory Ni-Mn-Ga" (2003).Ames Laboratory Conference Papers, Posters, and Presentations. 60.
Dynamic Response in the Low-kHz Range and Delta-E Effect in
Ferromagnetic Shape Memory Ni-Mn-Ga
Abstract
Recent work on ferromagnetic shape memory nickel-manganese-gallium (Ni-Mn-Ga) has demonstrated
several characteristics which make this material attractive as an active element for the next generation of
intelligent transducers. Alloys of martensitic Ni-Mn-Ga can strain up to 6% as a result of the rotation of twin
variants and associated twin boundary motion which occur in these materials in response to magnetic fields.
The magnetic actuation holds promise in transducer design because it can lead to enhanced frequency
response compared with shape memory alloys with comparable strains. In this paper, we report on
experimental measurements collected from a Ni50 Mn28.7 Ga21.3 sample which has been tested in a
solenoid transducer by means of a novel drive configuration consisting of a collinear uniaxial field-uniaxial
stress pair. We have observed that the elastic modulus of a Ni-Mn-Ga sample driven in these conditions
changes substantially in response to varying bias field. In this paper, we further investigate the dependence of
the elastic modulus on ac field intensity and mechanical load as well as bias field. Quasistatic, white noise, and
swept-sine excitations were employed to examine the behavior of Ni50 Mn28.7 Ga21.3 driven under various
combinations of magnetic fields and mechanical loads. Mechanically free quasi-static tests demonstrate
reversible strains of 6300 με which are consistent with prior measurements on samples with similar
composition near the Heusler stoichiometry. Dynamic measurements reveal a significant stiffness increase, of
up to 209%, with dc bias field. This frequency shift or ΔE effect is shown to originate in the Ni-Mn-Ga sample
and is believed to stem from the reorientation of twin variants in response to varying dc field. These results
might facilitate a new class of solenoid-based Ni-Mn-Ga transducers for tunable vibration absorber
applications, and lay the ground work for developing methods and criteria for the implementation of
broadband Ni-Mn-Ga transducer technologies.
Keywords
Mechanical Engineering
Comments
This article is from
ASME 2003 International Mechanical Engineering Congress and Exposition
68 (2003): pp.
317-324, doi:10.1115/IMECE2003-43198
http://dx.doi.org/10.1115/IMECE2003-43198
August 15, 2003 16:21
Proceedings of IMECE’03 2003 ASME International Mechanical Engineering Congress & Exposition November 16-21, 2003, Washington, D.C. USA
IMECE2003-43198
DYNAMIC RESPONSE IN THE LOW-KHZ RANGE AND DELTA-E EFFECT
IN FERROMAGNETIC SHAPE MEMORY NI-MN-GA
LeAnn E. Faidley Marcelo J. Dapino∗ Gregory N. Washington Department of Mechanical Engineering
The Ohio State University Columbus, Ohio, 43210
Thomas A. Lograsso Ames laboratory U.S. Department of Energy
Iowa State University Ames, Iowa, 50011
ABSTRACT
Recent work on ferromagnetic shape memory nickel-manganese-gallium (Ni-Mn-Ga) has demonstrated several char-acteristics which make this material attractive as an active ele-ment for the next generation of intelligent transducers. Alloys of martensitic Ni-Mn-Ga can strain up to 6% as a result of the rota-tion of twin variants and associated twin boundary morota-tion which occur in these materials in response to magnetic fields. The mag-netic actuation holds promise in transducer design because it can lead to enhanced frequency response compared with shape mem-ory alloys with comparable strains. In this paper, we report on
experimental measurements collected from a Ni50Mn28.7Ga21.3
sample which has been tested in a solenoid transducer by means of a novel drive configuration consisting of a collinear uniaxial field- uniaxial stress pair. We have observed that the elastic mod-ulus of a Ni-Mn-Ga sample driven in these conditions changes substantially in response to varying bias field. In this paper, we further investigate the dependence of the elastic modulus on ac field intensity and mechanical load as well as bias field. Quasi-static, white noise, and swept-sine excitations were employed
to examine the behavior of Ni50Mn28.7Ga21.3driven under
vari-ous combinations of magnetic fields and mechanical loads. Me-chanically free quasi-static tests demonstrate reversible strains
of 6300 µεwhich are consistent with prior measurements on
sam-ples with similar composition near the Heusler stoichiometry. Dynamic measurements reveal a significant stiffness increase, of
∗Address all correspondence to this author ([email protected]).
up to 209%, with dc bias field. This frequency shift or ∆E
ef-fect is shown to originate in the Ni-Mn-Ga sample and is be-lieved to stem from the reorientation of twin variants in response to varying dc field. These results might facilitate a new class of solenoid-based Ni-Mn-Ga transducers for tunable vibration absorber applications, and lay the ground work for developing methods and criteria for the implementation of broadband Ni-Mn-Ga transducer technologies.
INTRODUCTION
Ferromagnetic shape memory alloys (FSMAs) in the Ni-Mn-Ga system have been shown to produce large strains up to 6% when exposed to magnetic fields [1]. These strains result from the reorientation of twinned martensitic variants and asso-ciated twin boundary motion which occur as the easy crystallo-graphic axis aligns with external magnetic fields. While these strains are on the same order of those seen in shape memory alloys (SMAs), the rotation of twin martensitic variants in re-sponse to magnetic activation is faster and thus can lead to faster response than those achieved through martensite-austenite phase transformations [2]. Upon removal of the external magnetic field, however, there is no restoring force to drive the twin boundary in the opposite direction and the field-induced strain is not recover-able.
To achieve large reversible field-induced strains, a compres-sive stress is typically applied perpendicular to the field direction that favors variants with the c-axis aligned along the
c
c
H
σ σ
c
c
1 2
CONVENTIONAL DRIVE CONFIGURATION
H c
c c
c
1 2
EMPLOYED DRIVE CONFIGURATION
σ
σ
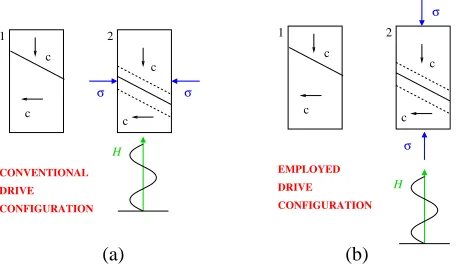
[image:4.612.57.287.90.223.2](a) (b)
Figure 1. (a) Conventional perpendicular configuration for field-induced
martensitic twin boundary motion; (b) collinear field-stress drive configu-ration employed in this paper.
sion axis. This perpendicular drive configuration is illustrated in Figure 1(a). In this investigation, experiments were conducted with the stress and magnetic field applied collinearly along the magnetic easy axis direction of the sample, contrary to the typ-ical perpendicular arrangement (see Figure 1(b)). Despite the lack of a readily recognizable restoring mechanism, reversible strains as large as 6300 µε(0.63 %) are demonstrated, which rep-resent almost a four-fold improvement over the technologically more mature giant magnetostrictive material Terfenol-D. These reversible field-induced strains are seemingly too large to result from Joule magnetostriction nor can they be explained by the ex-isting martensite variant reorientation models. In addition, con-trary to the conventional processing practice of material “train-ing” through field cycling and thermal treatments, these large strains were obtained from material tested as cast. The signif-icance of the collinear stress-field configuration lies in that the magnetic field can be applied by a solenoid wrapped around a cylindrical rod, as opposed to a transverse electromagnet as is required for the perpendicular stress-field arrangement. Primary benefits of solenoid actuation over electromagnets include sig-nificantly smaller volume and weight. In addition, avoiding the use of electromagnets eliminate much of the demagnetization ef-fects and eddy current losses which limit the frequency response of the Ni-Mn-Ga. For example, the solenoid based transducer to be described in the following section has shown response up to 5 kHz. Furthermore, we have shown that the collinear stress-field drive configuration can lead to significantly higher material stiffness than that previously measured employing conventional electromagnet tests [3].
The sample employed in this investigation has an average composition of Ni50Mn28.7Ga21.3, that is lower in Mn and higher in Ga than the composition which exhibits 6% strains [4]. De-spite the fractional increase in Mn content of the alloys studied in this and our prior investigations [3, 5] with respect to those ex-hibiting the largest magnetic field-induced strains, significant and
profound differences are apparent in several regards, especially since the material investigated elsewhere is largely inactive when driven under collinear field-stress conditions. One difference lies in that the room temperature structure of the martensite phase at higher Mn content is orthorhombic rather than tetragonal [6]. A second and perhaps more significant difference is that for the sample tested, the shape memory martensitic transformation temperature is nearly coincident with the ferromagnetic order-ing temperature, suggestorder-ing a coupled magneto-structural trans-formation which may be responsible for the observed reversible strains. Coupled transitions, known to exist in rare-earth-silicon-germanium compounds [7, 8], result in extraordinary magnetic responses including large magnetostriction, where the applica-tion of a magnetic field drives the structural change from a para-magnetic austenite phase to a ferropara-magnetic martensitic phase. This structural change is fully reversible when the magnetic field is removed.
The overall goal of this investigation is the determination of methods and criteria for the implementation of solenoid-based Mn-Ga transducers in dynamic environments. However, Ni-Mn-Ga compounds capable of large magnetically-activated re-sponses under collinear field-stress conditions have been elu-sive, in part because the variant reorientation theories required for modeling and analysis of such compounds suggest that re-versible strains stem exclusively from perpendicular field-field or field-stress configurations. Building on our prior results, and in order to ascertain the feasibility of collinear field-stress config-urations compatible with solenoid-based transducers, this paper presents a quasi-static and dynamic characterization of the alloy Ni50Mn28.7Ga21.3. Quasi-static measurements conducted under 0.5 Hz sinusoidal excitations reveal a maximum field-activated strain of 6300 µε. White noise and swept-sine excitations up to 5 kHz are employed to demonstrate large stiffness changes with varying bias fields and mechanical loads.
EXPERIMENTS
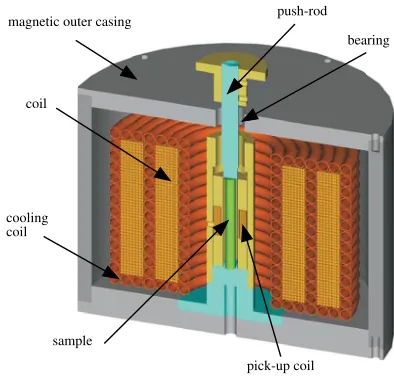
The experiments are focused on the quasi-static and dy-namic characterization of a single crystal alloy with composition Ni50Mn28.7Ga21.3which was prepared by the Bridgman method. The single crystal ingot was oriented along the [100] direction and a 0.248 in (0.630 cm) diameter, 0.883 in (2.243 cm) long rod was cut from the ingot using electrical discharge machining (EDM). The experiments were conducted with a collinear mag-netic field-stress pair in the broadband research transducer shown in Figure 2, which consists of a water-cooled solenoid, pickup coil, and magnetic steel components integrated to form a closed magnetic circuit. The solenoid consists of 1350 turns of AWG 15 magnet wire and has a field rating of 167 Gauss/A up to 8.1 kGauss. Interspersed within the solenoid lies a coil of 0.25 in di-ameter copper tubing which provides temperature control within
±1 F by means of water flow at a rate of up to 6.35 L/min. The
push-rod magnetic outer casing
sample coil
cooling coil
pick-up coil
[image:5.612.51.248.101.289.2]bearing
Figure 2. Cross-section of the broadband transducer employed in this
study.
fact that the Ni-Mn-Ga is surrounded by a closed magnetic cir-cuit ensures that demagnetization factors are negligible.
The solenoid is driven by two Techron 7790 4 kW amplifiers arranged in series with an overall voltage gain of 60 and a max-imum output current of 56 A at the nominal solenoid resistance
of 3.7Ω. The magnetic induction is measured with a pickup coil
[image:5.612.325.577.540.672.2]made from AWG 33 insulated copper wire wound in two layers around an aluminum spool. The quasi-static strain is measured by means of a Lucas Shaevitz MHR-025 linear variable differen-tial transducer (LVDT) while the dynamic response is measured by means of PCB U352C22 and 352C68 accelerometers. Several Omega thermocouples are used to monitor the system tempera-ture through a 10-channel Omega signal conditioner. For loaded tests, several static loads ranging from 0 – 750 grams are used. The system is controlled by a a SigLab 20-42 data acquisition system interfaced through a PC. The test setup is illustrated in Figure 3.
The dynamic response of the Ni-Mn-Ga sample was studied by way of a combination of white noise excitation and swept-sine tests. The white noise excitation tests were conducted to deter-mine frequency ranges where transducer and sample resonance behaviors occur, whereas the swept-sine excitation tests were employed to gather higher resolution data around the sample res-onance frequency under various operating conditions. For both types of excitation measured responses include transfer func-tions pushrod acceleration per current, acceleration of transducer housing (“canister”) per current, and electrical impedance com-puted from the pick-up coil voltage per input current. Three sets of swept-sine data were gathered in order to examine the effect of load, dc bias field, and ac field amplitude. In the first data
set, the mechanical load applied to the sample was varied from 0–750 grams for a bias level of 1.1 kOe (86.2 kA/m). A sec-ond set of tests were employed to determine the resonance over a range of bias fields from 0 – 1.6 kOe (0 – 129 kA/m). The tests were run in current controlled mode such that the applied ac field remained constant at 82.7 Oe (6.58 kA/m) which repre-sents the largest field that the amplifiers can supply to the 13.5 mH inductive load at 5 kHz. In the final set of swept-sine tests, the ac field intensity was varied between 33.4 – 82.7 Oe (2.66 – 6.58 kA/m) while maintaining a constant 812 Oe (64.7 kA/m) bias field. Throughout all the tests, temperatures were monitored at the core of the solenoid as well as at the inlet and outlet of the
cooling tubes to ensure constant temperature testing to within±
F. In addition, sufficient time was allowed between tests to ensure ambient temperature initial conditions on the Ni-Mn-Ga sample as well as to minimize thermal effects in the drive amplifiers.
EXPERIMENTAL RESULTS AND DISCUSSION
Quasi-Static Testing
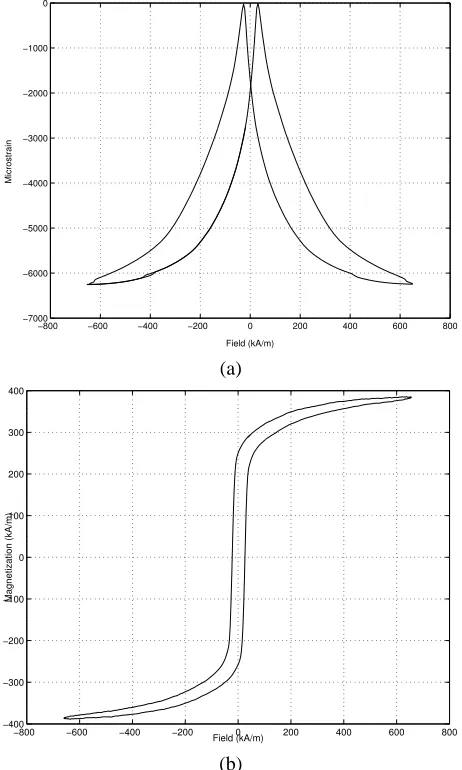
Quasi-static testing was performed on the Ni50Mn28.7Ga21.3 sample in the transducer shown in Figure 2 in order to determine the level of activity of this sample relative to other Ni-Mn-Ga compounds and other active materials. Mechanically-free mea-surements were conducted at 0.5 Hz under a sinusoidal magnetic field of amplitude 9.2 kOe (732 kA/m). Strain and magnetization results are shown in Figure 4, where corrections have been made to account for the magnetostriction of the transducer’s steel end
extensions and pushrod. The maximum strain of 6300 µε
repre-sents an increase of 47 percent over the maximum strain reported previously under collinear field-stress drive conditions [5]. It also represents a four-fold improvement over the saturation magne-tostriction of Terfenol-D (1600 µε).
Transducer output
current
push rod acc.
induced voltage PC
Amplifier
Accelerometer
Current Monitor
Data Acquisition System
Signal Conditioner
canister acc.
Load
Figure 3. Experimental setup used for quasi-static and dynamic testing
of Ni-Mn-Ga.
−800 −600 −400 −200 0 200 400 600 800 −7000
−6000 −5000 −4000 −3000 −2000 −1000 0
Field (kA/m)
Microstrain
(a)
−800 −600 −400 −200 0 200 400 600 800
−400 −300 −200 −100 0 100 200 300 400
Field (kA/m)
Magnetization (kA/m)
[image:6.612.49.280.91.476.2](b)
Figure 4. (a) Strain vs. field and (b) magnetization vs. field for
Ni50Mn28.7Ga21.3at 0.5 Hz.
Dynamic Testing
The overall system response was measured using 0–20 kHz white noise excitation under a magnetic bias of 1.4 kOe (107.7 kA/m). The effective bandwidth of the solenoid transducer is eddy current-limited and estimated to be greater than 5 kHz. It is shown that the Ni-Mn-Ga response occurs below 5 kHz. In order to separate the transducer spectral components from those associated with the active sample, tests were conducted utilizing different core materials: Ni-Mn-Ga, 1018 steel, aluminum, and copper. Figure 5 shows the transfer function pushrod accelera-tion per current in these different cases. Notably, the locaaccelera-tion of the primary peak does not change with core material though their magnitudes change slightly due to slight variation in the system’s mass and impedance. This indicates that, as expected,
the first axial resonance for the steel, aluminum, and copper are outside of the 20 kHz range. For example, the peak at 1.8 kHz is unaffected by the choice of material, thus suggesting it orig-inates from transducer structural elements which are uncoupled from the core material.
Figure 6 shows the white noise response of the
Ni50Mn28.7Ga21.3 sample under various loads. The graph
shows all of the same transducer peaks as those seen in Figure 5 but also exhibits new peaks at about 1.5 kHz for a 60 gram load and at about 0.5 kHz for a load of 750 grams. This peak is believed to be the primary resonance of the sample and is the focus of the tests presented in the following sections. It is not
0 0.2 0.4 0.6 0.8 1 1.2 1.4 1.6 1.8 2
x 104 0
0.2 0.4 0.6 0.8 1 1.2 1.4
Frequency, Hz
Pushrod Acceleration per Input Current (g/A)
NiMnGa Cu Al Steel
Figure 5. Transfer function pushrod acceleration per input current for
white noise excitation for various core materials.
0 1000 2000 3000 4000 5000 6000 7000 8000 9000 10000 0
0.2 0.4 0.6 0.8 1 1.2 1.4
Frequency, Hz
Pushrod Acceleration per Input Current (g/A)
2.5 g
22.3 g
60.6 g
750 g shifting
peak
Figure 6. Transfer function pushrod acceleration per input current for
white noise excitation at various loads.
[image:6.612.325.564.495.680.2]visible for loads lower than 60 grams because for those loads it is located in regions dominated by transducer housing resonances. It is noted that as the load is increased, the amplitude of the peak at 1.8 kHz decreases substantially.
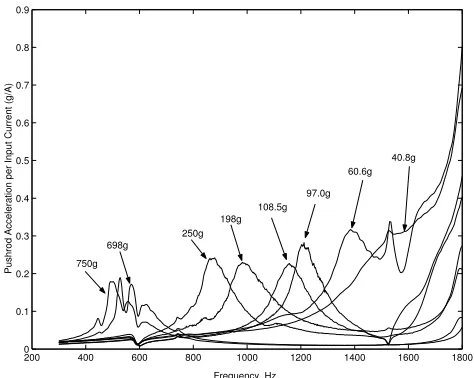
Effect of Load The white noise excitation tests shown in Figures 5 and 6 suggest that there is a resonance peak located in the range below 1.8 kHz which stems for the Ni-Mn-Ga element and whose location is directly correlated to the externally applied mechanical load. Figure 7 shows the effect of mechanical load on the transfer function pushrod acceleration per current. For all of the curves, a fixed 1.1 kOe (86.2 kA/m) dc bias field and 82.7 Oe (6.6 kA/m) ac field amplitude were employed. Loads varying from 40.8 to 750 grams were applied since the resonance peaks for loads smaller than this lie within the activity region for the actuator structure and thus cannot be accurately measured. It is seen that as the load was increased the resonance shifted from about 1.4 kHz to about 0.5 kHz. Figure 8 shows the relationship between the applied mass, m, and the resonance frequency, f compared to the inverse squared relationship suggested by the simple 1 degree of freedom model
(2πf)2= k
m (1)
where k is the stiffness of the series combination of Ni-Mn-Ga sample, end extensions, and pushrod, and m is the dynamic mass of the system which is the sum of the applied mass and one third of the sample, end extensions, and pushrod mass. The stiffness value, k, used for the model curve is the average of the stiffness values calculated for each peak from Equation 1. It is concluded that although there are slight deviations from the predicted trend due to the physical complexity of the transducer compared with the model, this model can provide adequate estimates of the over-all material behavior.
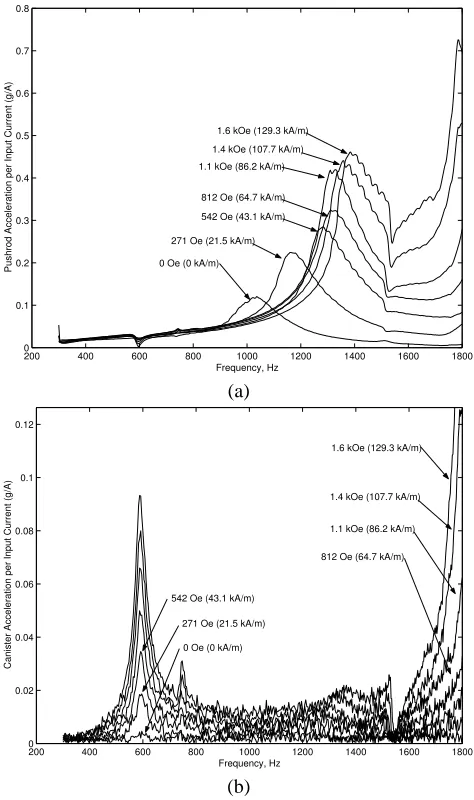
Effect of Bias Field Figures 9 and 10 show the results of swept-sine tests in which the bias levels were varied between 0– 1.6 kOe (0–129.3 kA/m) for a 60.6 and 250.0 gram load. Part (a) of each figure shows the transfer function pushrod acceleration per input current, while part (b) shows the transducer housing acceleration per input current. The results suggest a substantial shift of the pushrod acceleration resonance peak which indicates a stiffening of the sample with increasing bias level. This trend is analogous to the resonance shift with bias field, or∆E effect, observed in magnetostrictive materials. However, the effect ob-served here is not believed to stem from Joule magnetostriction, but from twin variant reorientation effects as suggested by quasi-static measurements. It is noted that the resonance peak show-ing the shift is not evident in the housshow-ing acceleration transfer
200 400 600 800 1000 1200 1400 1600 1800 0
0.1 0.2 0.3 0.4 0.5 0.6 0.7 0.8 0.9
Frequency, Hz
Pushrod Acceleration per Input Current (g/A) 750g
698g
250g 198g
108.5g 97.0g
[image:7.612.325.562.88.277.2]60.6g 40.8g
Figure 7. Pushrod acceleration per input current for several applied
loads for the Ni-Mn-Ga sample.
0 0.1 0.2 0.3 0.4 0.5 0.6 0.7 0.8
0 0.5 1 1.5 2 2.5 3 3.5 4 4.5
Load, kg
Resonance Frequency, kHz
[image:7.612.325.565.323.518.2]f = sqrt(7.0823e6/m)/(2pi)
Figure 8. Comparison of experimental and 1DOF model results for
fre-quency (f) as a function of load (m).
function, suggesting that this peak is in fact associated with the Ni-Mn-Ga sample rather than the transducer.
Figure 11 shows the transfer function pushrod acceleration per input current for the primary transducer resonance peak at 1.8 kHz. This peak also exhibits a shift with bias field showing a slight shift toward higher frequencies followed by a shift to-ward lower frequencies. A similar shift is seen in the equivalent transducer peak when an aluminum core is employed instead of Ni-Mn-Ga. This suggests that this shift is due to a change in stiff-ness of transducer components unrelated to the sample itself and also explains why this shift is substantially smaller that the shift seen in Figures 9 and 10. The results presented in [3] employed
the latter resonance shifts to calculate the∆E effect in Ni-Mn-Ga since, under the unloaded conditions used, the existence of the sample resonance was not apparent. This resulted in the report-ing of numbers much smaller than those presented below.
Effect of AC Drive Amplitude Figure 12 shows the effect of ac drive magnitude on the resonance frequency in the transfer function pushrod acceleration per input current for tests run with an 812 Oe (64.7 kA/m) magnetic bias and 60.6 gram load. In this case, the dependence of stiffness upon ac field in-tensity is quite weak.
200 400 600 800 1000 1200 1400 1600 1800
0 0.1 0.2 0.3 0.4 0.5 0.6 0.7 0.8
Frequency, Hz
Pushrod Acceleration per Input Current (g/A)
1.6 kOe (129.3 kA/m)
1.4 kOe (107.7 kA/m)
1.1 kOe (86.2 kA/m)
812 Oe (64.7 kA/m)
542 Oe (43.1 kA/m)
271 Oe (21.5 kA/m)
0 Oe (0 kA/m)
(a)
200 400 600 800 1000 1200 1400 1600 1800
0 0.02 0.04 0.06 0.08 0.1 0.12
Frequency, Hz
Canister Acceleration per Input Current (g/A)
1.6 kOe (129.3 kA/m)
1.4 kOe (107.7 kA/m)
1.1 kOe (86.2 kA/m)
812 Oe (64.7 kA/m)
542 Oe (43.1 kA/m)
271 Oe (21.5 kA/m)
0 Oe (0 kA/m)
[image:8.612.329.566.88.483.2](b)
Figure 9. Transfer functions (a) pushrod acceleration per input current
and (b) transducer housing acceleration per input current for the Ni-Mn-Ga sample loaded with 60 grams external load.
200 400 600 800 1000 1200 1400 1600 1800 0
0.05 0.1 0.15 0.2 0.25 0.3 0.35
Frequency, Hz
Pushrod Acceleration per Input Current (g/A)
0 Oe (0 kA/m) 271 Oe (21.5 kA/m)
542 Oe (43.1 kA/m) 812 Oe (64.7 kA/m)
1.1 kOe (86.2 kA/m) 1.4 kOe (107.7 kA/m)
1.6 kOe (129.3 kA/m)
(a)
200 400 600 800 1000 1200 1400 1600 1800
0 0.02 0.04 0.06 0.08 0.1 0.12 0.14 0.16 0.18
Frequency, Hz
Canister Acceleration per Input Current (g/A)
1.6 kOe (129.3 kA/m)
1.4 kOe (107.7 kA/m)
1.1 kOe (86.2 kA/m)
812 Oe (64.7 kA/m)
542 Oe (43.1 kA/m)
271 Oe (21.5 kA/m)
0 Oe (0 kA/m)
(b)
Figure 10. Transfer functions (a) pushrod acceleration per input current
and (b) transducer housing acceleration per input current for the Ni-Mn-Ga sample loaded with 250 grams external load.
Delta-E Effect
The resonance shifts shown in Figures 9 and 10 represent
a change in the stiffness or∆E effect which stems from the
re-sponse of Ni-Mn-Ga to applied fields. Figure 7 shows a shift in resonance due to applied mass. To quantify the stiffness shift, the following linear model for rod vibrations is employed,
k=AE
l , (2)
where A is the cross-sectional area, E is the elastic modulus of the sample, and l is the rod length. Combining relations (1) and (2)
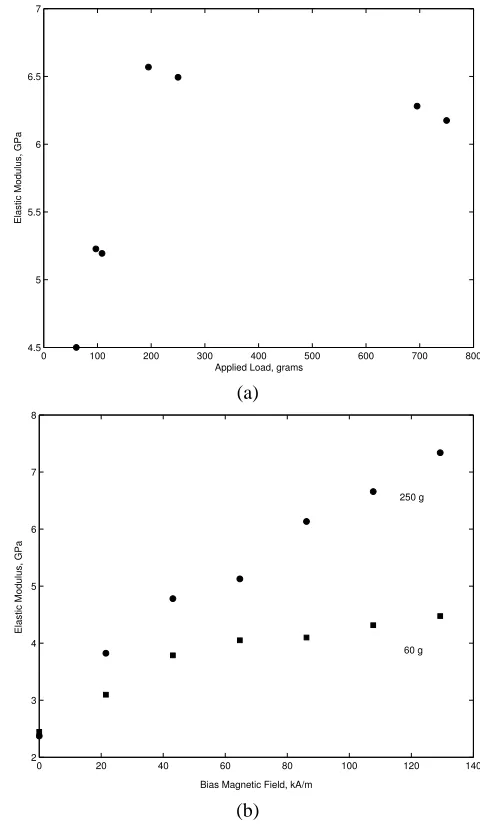
[image:8.612.45.282.262.662.2]and observing that in these relations the stiffness k represents the series combination of the pushrod, end extensions, and Ni-Mn-Ga sample, allows for the determination of the elastic modulus of the material in each of the states represented in Figures 7, 9, and 10. The elastic modulus as a function of load is shown in Figure 13(a), while its dependence on bias field is shown in Figure 13(b).
Tables 1 and 2 show the numerical values for the points on the plots in Figure 13(a) and (b). According to the simple model (1) - (2) there is a 46% change in modulus with a change in load of about 700 grams. The overall trend shown is an increasing region followed by a slightly decreasing region as the load is
15000 1600 1700 1800 1900 2000 2100 2200 2300 2400 2500 0.1
0.2 0.3 0.4 0.5 0.6 0.7
Frequency, Hz
Pushrod Acceleration per Input Current
1.6 kOe (129.3 kA/m)
1.4 kOe (107.7 kA/m)
1.1 kOe (86.2 kA/m)
812 Oe (64.7 kA/m)
542 Oe (43.1 kA/m)
271 Oe (21.5 kA/m)
[image:9.612.324.564.92.506.2]0 Oe (0 kA/m)
Figure 11. Pushrod acceleration per input current for the primary
trans-ducer resonance.
200 400 600 800 1000 1200 1400 1600 1800 0
0.05 0.1 0.15 0.2 0.25 0.3 0.35 0.4
Frequency, Hz
Pushrod Acceleration per Input Current (g/A)
100 Oe (7.97 kA/m) 83.5 Oe (6.64 kA/m)
66.8 Oe (5.3 kA/m) 50 Oe (4.0 kA/m)
[image:9.612.43.284.259.444.2]33.4 Oe (2.66 kA/m)
Figure 12. Pushrod acceleration per input current for several ac
mag-netic field levels.
0 100 200 300 400 500 600 700 800 4.5
5 5.5 6 6.5 7
Elastic Modulus, GPa
Applied Load, grams
(a)
0 20 40 60 80 100 120 140
2 3 4 5 6 7 8
Bias Magnetic Field, kA/m
Elastic Modulus, GPa
250 g
60 g
[image:9.612.42.280.497.679.2](b)
Figure 13. Elastic modulus dependence on (a) applied load and (b) bias
magnetic field.
Table 1. Elastic modulus dependence on applied load.
Load Elastic Modulus
(grams) (GPa)
60.6 4.500
97.0 5.228
108.5 5.194
198.0 6.569
250.0 6.494
698.0 6.281
750.0 6.175
∆E→ 46%
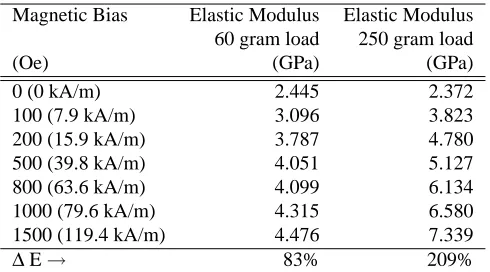
[image:9.612.386.510.574.699.2]Table 2. Elastic modulus dependence on bias magnetic field for 60 & 250 gram loads.
Magnetic Bias Elastic Modulus Elastic Modulus
60 gram load 250 gram load
(Oe) (GPa) (GPa)
0 (0 kA/m) 2.445 2.372
100 (7.9 kA/m) 3.096 3.823
200 (15.9 kA/m) 3.787 4.780
500 (39.8 kA/m) 4.051 5.127
800 (63.6 kA/m) 4.099 6.134
1000 (79.6 kA/m) 4.315 6.580
1500 (119.4 kA/m) 4.476 7.339
∆E→ 83% 209%
increased. The dependence of elastic modulus on magnetic bias field is much more significant than that of load. Elastic modulus varies by 83% with magnetic bias field for the 60 gram load and
by 209% for the 250 gram load. This∆E effect is on the order
of magnitude as that seen in Terfenol-D and also shows the same increasing trend [9].
CONCLUDING REMARKS
The quasi-static and dynamic behavior of Ni50Mn28.7Ga21.3 under a collinear uniaxial stress - uniaxial magnetic field pair have been examined for various mechanical loads, bias magnetic fields, and ac field amplitudes. Quasi-static testing demonstrates that the mechanically-free Ni-Mn-Ga sample exhibits reversible strains of up to 6300 µε(0.63%). This result is consistent with prior results obtained from material of similar composition. Dy-namic testing identified the sample resonance peak at about 0.5 kHz when the sample was loaded with 750 grams. This peak was found to shift upwards into the frequency range dominated by transducer resonance at about 1.8 kHz when the load was re-duced to under about 50 grams. The peak also exhibited a signif-icant shift toward high frequencies as the magnetic bias field was increased from 0 – 1.6 kOe (0 – 129.3 kA/m). This shift indi-cates a stiffening of the sample which corresponds to a∆E effect of 83% for the 60 gram load and 209% for the 250 gram load. The magnitude of this field-induced∆E effect suggests that this material will be valuable for applications such as tunable vibra-tion absorbers. Future work will involve the complete mapping of this Ni-Mn-Ga composition with respect to bias field and me-chanical load in order to verify the trends found here. In addition, models will be developed to predict this behavior and to help un-derstand the overall behavior of Ni-Mn-Ga when activated by a collinear stress-field pair.
ACKNOWLEDGMENT
Financial support for L.E.F. comes from the Ohio Space Grant Consortium and The Ohio State University Graduate Fel-lowship program. Funding for M.J.D. was provided in part by The Ohio State University through startup funds. T.A.L. ac-knowledges the support of the Office of Basic Energy Sciences, Materials Science Division, of the U.S. Department of Energy under Contract No. W-7405-ENG-82. Private conversations with D. L. Schlagel, R. L. Kellogg, and P. R. Downey are acknowl-edged as well.
REFERENCES
[1] O’Handley, R., Murray, S., Marioni, M., Nembach, H., and Allen, S., 2000. “Phenomenology of giant magnetic-field induced strain in ferromagnetic shape-memory materials.” J. Appl. Phys., 87 (9) [May], pp. 4712–4717.
[2] Chopra, H., Ji, C., and Kokorin, V., 2000. “Magnetic-field-induced twin boundary motion in magnetic shape-memory alloys.” Phys. Rev. B., 61 (66) [June], pp. 4913–4915. [3] Faidley, L., Dapino, M., Washington, G., Lograsso, T.,
and Smith, R., 2003. “Analytical and experimental issues
in Ni−Mn−Ga transducers.” Proceedings of SPIE Smart
Structures and Materials Conf. [March] To appear.
[4] Jin, X., Marioni, M., Bono, D., Allen, S., O’Handley, R., and Hsu, T., 2002. “Empirical mapping of Ni-Mn-Ga prop-erties with composition and valence electron concentration.” Journal of Applied Physics, 91 (10) [May].
[5] Malla, A., Dapino, M., and Lograsso, T., 2003. “Effect of composition on the magnetic and elastic properties of shape memory NiMnGa.” Proceedings of SPIE Smart Structures and Mateials Conf. [March] To appear.
[6] Sozinov, A., Likhachev, A. A., Lanska, N., and Ullakko, K., 2002. “Giant magnetic-field induced strain in NiMnGa seven-layered martensitic phase.” Appl. Phys. Let., 80 (10) [March], pp. 1746–1749.
[7] Pecharsky, V., and K.A. Gshneidner, J., 1997. “Giant mag-netocaloric effect in Gd5(Si2Ge2).” Physical Review Letters, 78 (23) [June], pp. 4494–4497.
[8] Pecharsky, V., and K.A. Gshneidner, J., 1997. “Tunable mag-netic regenerator alloys with a giant magnetocaloric effect
for magnetic refrigeration from ≈20 to≈290 K.” Applied
Physics Letters, 70 (24) [June], pp. 3299–3301.
[9] Flatau, A., Dapino, M., and Calkins, F., 2000. “High band-width tunability in a smart vibration absorber.” J. Intell. Mater. Syst. and Struct., 11 (12) [Dec], pp. 923–929.
REFERENCES
[1] O’Handley, R., Murray, S., Marioni, M., Nembach, H., and Allen, S., 2000. “Phenomenology of giant magnetic-field induced strain in ferromagnetic shape-memory materials.”, J. Appl. Phys., 87 (9) [May], pp. 4712–4717.
[2] Chopra, H., Ji, C., and Kokorin, V., 2000. “Magnetic-field-induced twin boundary motion in magnetic shape-memory alloys.”, Phys. Rev. B., 61 (66) [June], pp. 4913–4915. [3] Faidley, L., Dapino, M., Washington, G., Lograsso, T.,
and Smith, R., 2003. “Analytical and experimental issues
in Ni−Mn−Ga transducers.”, Proceedings of SPIE Smart
Structures and Mateials Conf. [March].
[4] Jin, X., Marioni, M., Bono, D., Allen, S., O’Handley, R., and Hsu, T., 2002. “Empirical mapping of Ni-Mn-Ga prop-erties with composition and valence elctron concentration.”, Journal of Applied Physics, 91 (10) [May].
[5] Malla, A., Dapino, M., and Lograsso, T., 2003. “Effect of composition on the magnetic and elastic properties of shape memory NiMnGa.”, Proceedings of SPIE Smart Structures and Mateials Conf. [March].
[6] Sozinov, A., Likhachev, A. A., Lanska, N., and Ullakko, K., 2002. “Giant magnetic-field induced strain in NiMnGa seven-layered martensitic phase.”, Appl. Phys. Let., 80 (10) [March], pp. 1746–1749.
[7] Pecharsky, V., and K.A. Gshneidner, J., 1997. “Giant magne-tocaloric effect in Gd5(Si2Ge2).”, Physical Review Letters, 78 (23) [June], pp. 4494–4497.
[8] Pecharsky, V., and K.A. Gshneidner, J., 1997. “Tunable mag-netic regenerator alloys with a giant magnetocaloric effect
for magnetic refrigeration from≈20 to≈290 K.”, Applied
Physics Letters, 70 (24) [June], pp. 3299–3301.
[9] Flatau, A., Dapino, M., and Calkins, F., 2000. “High band-width tunability in a smart vibration absorber.”, J. Intell. Mater. Syst. and Struct., 11 (12) [Dec], pp. 923–929.