Determining Gains Acquired from Word Embedding Quantitatively
Using Discrete Distribution Clustering
Jianbo Ye
?, Yanran Li
†, Zhaohui Wu
‡, James Z. Wang
?, Wenjie Li
†and Jia Li
? ?The Pennsylvania State University, University Park, Pennsylvania
†
The Hong Kong Polytechnic University, Hong Kong
‡Microsoft
Abstract
Word embeddings have become widely-used in document analysis. While a large number of models for mapping words to vector spaces have been developed, it remains undetermined how much net gain can be achieved over traditional approaches based on bag-of-words. In this paper, we propose a new document clustering approach by combining any word embedding with a state-of-the-art algorithm for clustering empirical distri-butions. By using the Wasserstein distance between distributions, the word-to-word semantic relationship is taken into account in a principled way. The new clustering method is easy to use and consistently outperforms other methods on a variety of data sets. More importantly, the method provides an effective framework for determining when and how much word embeddings contribute to document anal-ysis. Experimental results with multiple embedding models are reported.
1 Introduction
Word embeddings (a.k.a. word vectors) have been broadly adopted for document analysis (Mikolov et al.,2013a,b). The embeddings can be trained from external large-scale corpus and then easily utilized for different data. To a certain degree, the knowledge mined from the corpus, possibly in very intricate ways, is coded in the vector space, Correspondence should be sent to J. Ye ([email protected]) and J. Li ([email protected]). The work was done when Z. Wu was with Penn State.
the samples of which are easy to describe and ready for mathematical modeling. Despite the appeal, researchers will be interested in knowing how much gain an embedding can bring forth over the performance achievable by existing bag-of-words based approaches. Moreover, how can the gain be quantified? Such a preliminary evaluation will be carried out before building a sophisticated pipeline of analysis.
Almost every document analysis model used in practice is constructed assuming a cer-tain basic representation—bag-of-words or word embeddings—for the sake of computational tractability. For example, after word embed-ding is done, high-level models in the embedded space, such as entity representations, similarity measures, data manifolds, hierarchical structures, language models, and neural architectures, are designed for various tasks. In order to invent or enhance analysis tools, we want to under-stand precisely the pros and cons of the high-level models and the underlying representations. Because the model and the representation are tightly coupled in an analytical system, it is not easy to pinpoint where the gain or loss found in practice comes from. Should the gain be credited to the mechanism of the model or to the use of word embeddings? As our experiments demonstrate, introducing certain assumptions will make individual methods effective only if certain constraints are met. We will address this issue under an unsupervised learning framework.
nonparametric measures (or discrete distributions) over the word embedding space is defined as the Wasserstein metric (a.k.a. the Earth Mover’s Distance or EMD) (Wan, 2007; Kusner et al.,
2015). Comparing with a vector representation, an empirical distribution can represent with higher fidelity a cloud of points such as words in a document mapped to a certain space. In the extreme case, the empirical distribution can be set directly as the cloud of points. In contrast, a vector representation reduces data significantly, and its effectiveness relies on the assumption that the discarded information is irrelevant or nonessential to later analysis. This simplification itself can cause degradation in performance, obscuring the inherent power of the word embedding space.
Our approach is intuitive and robust. In addition to a high fidelity representation of the data, the Wasserstein distance takes into account the cross-term relationship between different words in a
principled fashion. According to the definition, the distance between two documents A and B are the minimum cumulative cost that words from document A need to “travel” to match exactly the set of words for document B. Here, the travel cost of a path between two words is their (squared) Euclidean distance in the word embedding space. Therefore, how much benefit the Wasserstein distance brings also depends on how well the word embedding space captures the semantic difference between words.
While Wasserstein distance is well suited for document analysis, a major obstacle of approaches based on this distance is the computational in-tensity, especially for the original D2-clustering method (Li and Wang,2008). The main technical hurdle is to compute efficiently the Wasserstein barycenter, which is itself a discrete distribution, for a given set of discrete distributions. Thanks to the recent advances in the algorithms for solv-ing Wasserstein barycenters (Cuturi and Doucet,
2014; Ye and Li, 2014; Benamou et al., 2015;
Ye et al.,2017), one can now perform document clustering by directly treating them as empirical measures over a word embedding space. Although the computational cost is still higher than the usual vector-based clustering methods, we believe that the new clustering approach has reached a level of efficiency to justify its usage given how important it is to obtain high-quality clustering of unstructured text data. For instance, clustering is
a crucial step performed ahead of cross-document co-reference resolution (Singh et al.,2011), doc-ument summarization, retrospective events detec-tion, and opinion mining (Zhai et al.,2011).
1.1 Contributions
Our work has two main contributions. First, we create a basic tool of document clustering, which is easy to use and scalable. The new method leverages the latest numerical toolbox developed for optimal transport. It achieves state-of-the-art clustering performance across heterogeneous text data—an advantage over other methods in the literature. Second, the method enables us to quantitatively inspect how well a word-embedding model can fit the data and how much gain it can produce over the bag-of-words models.
2 Related Work
In the original D2-clustering framework proposed by Li and Wang (2008), calculating Wasserstein barycenter involves solving a large-scale LP prob-lem at each inner iteration, severely limiting the scalability and robustness of the framework. Such high magnitude of computations had prohibited it from deploying in many real-world applications until recently. To accelerate the computation of Wasserstein barycenter, and ultimately to improve D2-clustering, multiple numerical algorithmic ef-forts have been made in the recent few years ( Cu-turi and Doucet,2014;Ye and Li,2014;Benamou et al.,2015;Ye et al.,2017).
Although the effectiveness of Wasserstein dis-tance has been well recognized in the computer vision and multimedia literature, the property of Wasserstein barycenter has not been well under-stood. To our knowledge, there still lacks sys-tematic study of applying Wasserstein barycenter and D2-clustering in document analysis with word embeddings.
the scalability of this modified approach is still limited, an issue to be discussed in Section4.3. On the other hand, our approach adopts the framework similar to the K-means which is of complexity
O(n) per iteration and usually converges within just tens of iterations. The computation of D2-clustering, though in its original form was mag-nitudes heavier than typical document clustering methods, can now be efficiently carried out with parallelization and proper implementations (Ye et al.,2017).
3 The Method
This section introduces the distance, the D2-clustering technique, the fast computation frame-work, and how they are used in the proposed document clustering method.
3.1 Wasserstein Distance
Suppose we represent each documentdk consist-ing mk unique words by a discrete measure or a discrete distribution, wherek= 1, . . . , N withN
being the sample size:
dk=
Xmk i=1w
(k)
i x(ik). (1)
Here x denotes the Dirac measure with support x, and wi(k) 0 is the “importance weight” for the i-th word in the k-th document, with
Pmk i=1w
(k)
i = 1. And x (k)
i 2 Rd, called a support point, is the semantic embedding vector of the i-th word. The 2nd-order Wasserstein distance between two documents d1 andd2(and
likewise for any document pairs) is defined by the following LP problem:W2(d1, d2) :=
min ⇧
P
i,j⇡i,jkx(1)i x (2) j k22
s.t. Pm2
j=1⇡i,j =wi,8i, Pm1i=1⇡i,j =wj,8j ⇡i,j 0,8i, j ,
(2) where⇧ ={⇡i,j}is am1⇥m2coupling matrix,
and let{Ci,j :=kx(1)i x(2)j k22}be transportation costs between words. Wasserstein distance is a true metric (Villani, 2003) for measures, and its best exact algorithm has a complexity of
O(m3logm)(Orlin,1993), ifm
1=m2=m.
3.2 Discrete Distribution (D2-) Clustering
D2-clustering (Li and Wang, 2008) iterates be-tween the assignment step and centroids updating step in a similar way as the Lloyd’s K-means.
Suppose we are to find K clusters. The as-signment step finds each member distribution its nearest mean from K candidates. The mean of each cluster is again a discrete distribution with
m support points, denoted byci, i = 1, . . . , K. Each mean is iteratively updated to minimize its total within cluster variation. We can write the D2-clustering problem as follows: given sample data
{dk}Nk=1, support size of means m, and desired
number of clustersK, D2-clustering solves
min c1,...,cK
XN
k=11miniKW 2(d
k, ci), (3)
wherec1, . . . , cKare Wasserstein barycenters. At the core of solving the above formulation is an optimization method that searches the Wasserstein barycenters of varying partitions. Therefore, we concentrate on the following problem. For each cluster, we reorganize the index of member distributions from 1, . . . , n. The Wasserstein
barycenter (Agueh and Carlier,2011;Cuturi and Doucet,2014) is by definition the solution of
min c
Xn k=1W
2(d
k, c), (4)
where c = Pmi=1wi xi. The above Wasserstein
barycenter formulation involves two levels of optimization: the outer level finding the minimizer of total variations, and the inner level solving Wasserstein distances. We remark that in D2-clustering, we need to solve multiple Wasserstein barycenters rather than a single one. This consti-tutes the third level of optimization.
3.3 Modified Bregman ADMM for Computing Wasserstein Barycenter
The recent modified Bregman alternating direction method of multiplier (B-ADMM) algorithm (Ye et al., 2017), motivated by the work by Wang and Banerjee (2014), is a practical choice for computing Wasserstein barycenters. We briefly sketch their algorithmic procedure of this opti-mization method here for the sake of complete-ness. To solve for Wasserstein barycenter defined in Eq. (4), the key procedure of the modified Breg-man ADMM involves iterative updates of four block of primal variables: the support points of
c —{xi}mi=1(with transportation costs {Ci,j}(k) fork= 1, . . . , n), the importance weights ofc— {wi}mi=1, and two sets of split matching variables
—{⇡i,j(k,1)}and{⇡(i,jk,2)}, fork= 1, . . . , n, as well
In the end, both {⇡(i,jk,1)} and{⇡i,j(k,2)} converge to the matching weight in Eq. (2) with respect to d(c, dk). The iterative algorithm proceeds as follows untilcconverges or a maximum number of
iterations are reached: given constant⌧ 10,⇢/
P
i,j,kC (k) i,j
Pn
k=1mkm and round-off tolerance✏ = 10 10,
those variables are updated in the following order.
Update{xi}mi=1and{C (k)
i,j}in every⌧iterations:
xi := 1 nwi
Xn k=1
Xmk j=1⇡
(k,1) i,j x
(k) j ,8i,(5)
Ci,j(k) := kxi xj(k)k22, 8i, jandk. (6)
Update {⇡(i,jk,1)} and{⇡(i,jk,2)}. For eachi, jand k,
⇡i,j(k,2) := ⇡i,j(k,2)exp C (k) i,j
(k) i,j ⇢
!
+✏ ,(7)
⇡i,j(k,1) := wj(k)⇡i,j(k,2). ⇣Xm l=1⇡
(k,2) l,j
⌘
, (8)
⇡i,j(k,1) := ⇡i,j(k,1)exp⇣ (i,jk)/⇢⌘+✏ . (9)
Update{wi}mi=1. Fori= 1, . . . , m ,
wi := n
X
k=1
Pmk j=1⇡
(k,1) i,j
P
i,j⇡ (k,1) i,j
, (10)
wi := wi
. ⇣Xm i=1wi
⌘
. (11)
Update{⇡(i,jk,2)}and{ i,j(k)}. For eachi, jandk,
⇡i,j(k,2) := wi⇡i,j(k,1)
. ⇣Xmk l=1⇡
(k,1) i,l
⌘
, (12)
(k) i,j :=
(k) i,j +⇢
⇣
⇡i,l(k,1) ⇡i,l(k,2)⌘ . (13)
Eq. (5)-(13) can all be vectorized as very efficient numerical routines. In a data parallel implementa-tion, only Eq. (5) and Eq. (10) (involvingPn
k=1)
needs to be synchronized. The software package detailed in (Ye et al.,2017) was used to generate relevant experiments. We make available our codes and pre-processed datasets for reproducing all experiments of our approach.
4 Experimental Results
4.1 Datasets and Evaluation Metrics
We prepare six datasets to conduct a set of ex-periments. Two short-text datasets are created as follows. (D1) BBCNews abstract: We concatenate
the title and the first sentence of news posts from BBCNews dataset1 to create an abstract version.
(D2) Wiki events: Each cluster/class contains a set of news abstracts on the same story such as “2014 Crimean Crisis” crawled from Wikipedia current events following (Wu et al., 2015); this dataset offers more challenges because it has more fine-grained classes and fewer documents (with shorter length) per class than the others. It also shows more realistic nature of applications such as news event clustering.
We also experiment with two long-text datasets and two domain-specific text datasets. (D3) Reuters-21578: We obtain the original Reuters-21578 text dataset and process as follows: remove documents with multiple categories, remove documents with empty body, remove duplicates, and select documents from the largest ten categories. Reuters dataset is a highly unbalanced dataset (the top category has more than 3,000 documents while the 10-th category has fewer than 100). This imbalance induces some extra randomness in comparing the results. (D4) 20Newsgroups “bydate” version: We obtain the raw “bydate” version and process them as follows: remove headers and footers, remove URLs and Email addresses, delete documents with less than ten words. 20Newsgroups have roughly comparable sizes of categories. (D5) BBCSports. (D6) Ohsumed and Ohsumed-full: Documents are medical abstracts from the MeSH categories of the year 1991. Specifically, there are 23 cardiovascular diseases categories.
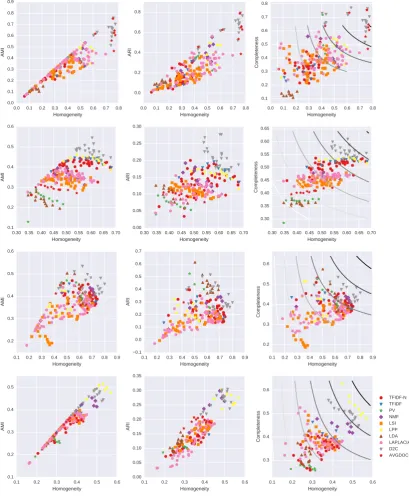
Evaluating clustering results is known to be nontrivial. We use the following three sets of quantitative metrics to assess the quality of clus-ters by knowing the ground truth categorical labels of documents: (i) Homogeneity, Completeness, and V-measure (Rosenberg and Hirschberg,2007); (ii) Adjusted Mutual Information (AMI) (Vinh et al., 2010); and (iii) Adjusted Rand Index (ARI) (Rand, 1971). For sensitivity analysis, we use the homogeneity score (Rosenberg and Hirschberg, 2007) as a projection dimension of other metrics, creating a 2D plot to visualize the metrics of a method along different homogeneity levels. Generally speaking, more clusters leads to higher homogeneity by chance.
4.2 Methods in Comparison
We examine four categories of methods that assume a vector-space model for documents, and compare them to our D2-clustering framework. When needed, we use K-means++ to obtain clusters from dimension reduced vectors. To diminish the randomness brought by K-mean initialization, we ensemble the clustering results of 50 repeated runs (Strehl and Ghosh, 2003), and report the metrics for the ensembled one. The largest possible vocabulary used, excluding word embedding based approaches, is composed of words appearing in at least two documents. On each dataset, we select the same set of Ks, the
number of clusters, for all methods. Typically,
Ks are chosen around the number of ground truth
categories in logarithmic scale.
We prepare two versions of the TF-IDF vectors as the unigram model. The ensembled K-means methods are used to obtain clusters. (1) TF-IDF
vector (Sparck Jones,1972). (2)TF-IDF-Nvector is found by choosing the most frequentN words
in a corpus, whereN 2 {500,1000,1500,2000}. The difference between the two methods high-lights the sensitivity issue brought by the size of chosen vocabulary.
We also compare our approach with the fol-lowing seven additional baselines. They are (3) Spectral Clustering (Laplacian), (4) Latent Semantic Indexing (LSI)(Deerwester et al.,1990), (5) Locality Preserving Projection (LPP) (He and Niyogi, 2004; Cai et al., 2005), (6) Non-negative Matrix Factorization (NMF) (Lee and Seung,1999;Xu et al.,2003), (7)Latent Dirichlet Allocation (LDA)(Blei et al.,2003;Hoffman et al.,
2010), (8) Average of word vectors (AvgDoc), and (9)Paragraph Vectors (PV)(Le and Mikolov,
2014). Details on their experimental setups and hyper-parameter search strategies can be found in the Appendix.
4.3 Runtime
We report the runtime for our approach on two largest datasets. The experiments regarding other smaller datasets all terminate within minutes in a single machine, which we omit due to space limitation. Like K-means, the runtime by our approach depends on the number of actual itera-tions before a termination criterion is met. In the Newsgroups dataset, with m = 100 and K = 45, the time per iteration is 121 seconds on 48
processors. In Reuters dataset, withm= 100and
K = 20, the time per iteration is190seconds on 24 processors. Each run terminates in around tens of iterations typically, upon which the percentage of label changes is less than 0.1%.
Our approach adopts the Elkan’s algorithm (2003) pruning unnecessary computations of Wasserstein distance in assignment steps of K-means. For the Newsgroups data (withm= 100andK = 45), our approach terminates in 36 iterations, and totally computes 12,162,717(⇡3.5%⇥186122) distance pairs in
assignment steps, saving60%(⇡1 3612⇥,45162⇥,18612717 ) distance pairs to calculate in the standard D2-clustering. In comparison, the clustering approaches based on K-nearest neighbor (KNN) graph with the prefetch-and-prune method of (Kusner et al., 2015) needs substantially more pairs to compute Wasserstein distance, meanwhile the speed-ups also suffer from the curse of dimensionality. Their detailed statistics are reported in Table 1. Based on the results, our approach is much more practical as a basic document clustering tool.
Method EMD counts (%) Our approach d= 400,K= 10 2.0 Our approach d= 400,K= 40 3.5
KNN d= 400,K= 1 73.9
KNN d= 100,K= 1 53.0
[image:5.595.306.506.400.468.2]KNN d= 50,K= 1 23.4
Table 1: Percentage of total 186122 Wasserstein distance pairs needed to compute on the full Newsgroup dataset. The KNN graph based on 1st order Wasserstein distance is computed from the prefetch-and-prune approach according to (Kusner et al.,2015).
4.4 Results
We now summarize our numerical results.
ro-Figure 1: The quantitative cluster metrics used for performance evaluation of “BBC title and abstract”, “Wiki events”, “Reuters”, and “Newsgroups” (row-wise, from top to down). Y-axis corresponds to AMI, ARI, and Completeness, respective (column-wise, from left to right). X-axis corresponds to Homogeneity for sensitivity analysis.
bustly superior performances among all ten meth-ods. Specifically, it ranks first in three datasets, and second in the other one. In comparison, LDA performs competitively on the “Reuters” dataset, but is substantially unsuccessful on others.
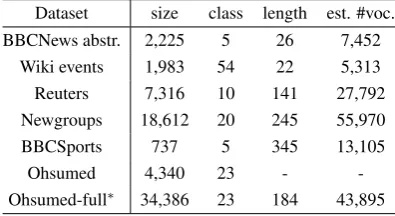
[image:6.595.95.505.97.595.2]Dataset size class length est. #voc. BBCNews abstr. 2,225 5 26 7,452
Wiki events 1,983 54 22 5,313
Reuters 7,316 10 141 27,792
Newgroups 18,612 20 245 55,970
BBCSports 737 5 345 13,105
Ohsumed 4,340 23 -
-Ohsumed-full⇤ 34,386 23 184 43,895
Table 2: Description of corpus data that have been used in our experiments. ⇤Ohsumed-full dataset is used for pre-training word embeddings only. Ohsumed is a downsampled evaluation set resulting from removing posts from Ohsumed-full that belong to multiple categories.
unfortunately is unrealistic in practice. NMF is a simple and effective method which always gives stable, though subpar, performance.
Short texts vs. long texts. D2-clustering performs much more impressively on short texts (“BBC abstract” and “Wiki events”) than it does on long texts (“Reuters” and “Newsgroups”). This outcome is somewhat expected, because the bag-of-words method suffers from high sparsity for short texts, and word-embedding based methods in theory should have an edge here. As shown in Fig.1, D2-clustering has indeed outperformed other non-embedding approaches by a large mar-gin on short texts (improved by about 40% and 20% respectively). Nevertheless, we find lifting from word embedding to document clustering is not without a cost. Neither AvgDoc nor PV can perform as competitively as D2-clustering performs on both.
Domain-specific text datasets. We are also interested in how word embedding can help group domain-specific texts into clusters. In particu-lar, does the semantic knowledge “embedded” in words provides enough clues to discriminate fine-grained concepts? We report the best AMI achieved by each method in Table 3. Our preliminary result indicates state-of-the-art word embeddings do not provide enough gain here to exceed the performance of existing methodolo-gies. On the unchallenging one, the “BBCSport” dataset, basic bag-of-words approaches (Tfidf and Tfidf-N) already suffice to discriminate different sport categories; and on the difficult one, the “Ohsumed” dataset, D2-clustering only slightly improves over Tfidf and others, ranking behind
LPP. Meanwhile, we feel the overall quality of clustering “Ohsumed” texts is quite far from useful in practice, no matter which method to use. More discussions will be provided next.
4.5 Sensitivity to Word Embeddings.
We validate the robustness of D2-clustering with different word embedding models, and we also show all their results in Fig.2. As we mentioned, the effectiveness of Wasserstein document clus-tering depends on how relevant the utilized word embeddings are with the tasks. In those general document clustering tasks, however, word embed-ding models trained on general corpus perform robustly well with acceptably small variations. This outcome reveals our framework as generally effective and not dependent on a specific word embedding model. In addition, we also conduct experiments with word embeddings with smaller dimensions, at 50 and 100. Their results are not as good as those we have reported (therefore detailed numbers are not included due to space limitation).
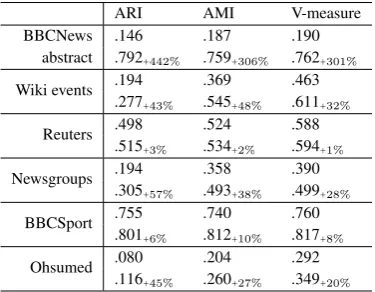
Inadequate embeddings may not be disastrous. In addition to our standard running set, we also used D2-clustering with purely random word embeddings, meaning each word vector is inde-pendently sampled from spherical Gaussian at 300 dimension, to see how deficient it can be. Experi-mental results show that random word embeddings degrade the performance of D2-clustering, but it still performs much better than purely random clustering, and is even consistently better than LDA. Its performances across different datasets is highly correlated with the bag-of-words (Tfidf and Tfidf-N). By comparing a pre-trained word embedding model to a randomly generated one, we find that the extra gain is significant (>10%) in clustering four of the six datasets. Their detailed statistics are in Table4and Fig.3.
5 Discussions
Performance advantage. There has been one immediate observation from these studies, D2-clustering always outperforms two of its degener-ated cases, namely Tf-idf and AvgDoc, and three other popular methods: LDA, NMF, and PV, on all tasks. Therefore, for document clustering, users can expect to gain performance improvements by using our approach.
[image:7.595.91.289.94.202.2]regular dataset domain-specific dataset BBCNews
abstract Wik events Reuters Newsgroups BBCSport Ohsumed Avg. Tfidf-N 0.389 0.448 0.470 0.388 0.883 0.210 0.465
Tfidf 0.376 0.446 0.456 0.417 0.799 0.235 0.455 Laplacian 0.538 0.395 0.448 0.385 0.855 0.223 0.474
LSI 0.454 0.379 0.400 0.398 0.840 0.222 0.448 LPP 0.521 0.462 0.426 0.515 0.859 0.284 0.511
NMF 0.537 0.395 0.438 0.453 0.809 0.226 0.476
[image:8.595.101.501.90.236.2]LDA 0.151 0.280 0.503 0.288 0.616 0.132 0.328 AvgDoc 0.753 0.312 0.413 0.376 0.504 0.172 0.422 PV 0.428 0.289 0.471 0.275 0.553 0.233 0.375 D2C (Our approach) 0.759 0.545 0.534 0.493 0.812 0.260 0.567
Table 3: Best AMIs (Vinh et al.,2010) of compared methods on different datasets and their averaging. The best results are marked in bold font for each dataset, the 2nd and 3rd are marked by blue and magenta colors respectively.
Figure 2: Sensitivity analysis: the clustering performances of D2C under different word embeddings. Left: Reuters, Right: Newsgroups. An extra evaluation index (CCD (Zhou et al.,2005)) is also used.
ARI AMI V-measure BBCNews .146 .187 .190
abstract .792+442% .759+306% .762+301% Wiki events .194.277 .369 .463
+43% .545+48% .611+32% Reuters .498 .524 .588
.515+3% .534+2% .594+1% Newsgroups .194 .358 .390
.305+57% .493+38% .499+28% BBCSport .755 .740 .760
.801+6% .812+10% .817+8% Ohsumed .080.116 .204 .292
+45% .260+27% .349+20% Table 4: Comparison betweenrandomword em-beddings (upper row) and meaningfulpre-trained
word embeddings (lower row), based on their best ARI, AMI, and V-measures. The improvements by percentiles are also shown in the subscripts.
LSI and Tfidf-N are rather sensitive to their extra hyper-parameters. Once the vocabulary
25%
[image:8.595.96.506.293.427.2]75% 68%32% 98% 2% 73%27% 91% 9% 78%22%
Figure 3: Pie charts of clustering gains in AMI calculated from our framework. Light region is by bag-of-words, and dark region is by pre-trained word embeddings. Six datasets (from left to right): BBCNews abstract, Wiki events, Reuters, Newsgroups, BBCSport, and Ohsumed.
[image:8.595.92.280.479.625.2]sensitive than the change ofK. Results at different
K are plotted for each method (Fig. 1). The
gray dots denote results of multiple runs of D2-clustering. They are always contracted around the top-right region of the whole population, revealing the predictive and robustly supreme performance.
When bag-of-words suffices. Among the results of “BBCSport” dataset, Tfidf-N shows that by restricting the vocabulary set into a smaller one (which may be more relevant to the interest of tasks), it already can achieve highest cluster-ing AMI without any other techniques. Other unsupervised regularization over data is likely unnecessary, or even degrades the performance slightly.
Toward better word embeddings. Our ex-periments on the Ohsumed dataset have been limited. The result shows that it could be highly desirable to incorporate certain domain knowledge to derive more effective vector embeddings of words and phrases to encode their domain-specific knowledge, such as jargons that have knowledge dependencies and hierarchies in educational data mining, and signal words that capture multi-dimensional aspects of emotions in sentiment analysis.
Finally, we report the best AMIs of all methods on all datasets in Table 3. By looking at each method and the average of best AMIs over six datasets, we find our proposed clustering frame-work often performs competitively and robustly, which is the only method reaching more than 90% of the best AMI on each dataset. Furthermore, this observation holds for varying lengths of doc-uments and varying difficulty levels of clustering tasks.
6 Conclusions and Future Work
This paper introduces a nonparametric clustering framework for document analysis. Its compu-tational tractability, robustness and supreme per-formance, as a fundamental tool, are empirically validated. Its ease of use enables data scientists to apply it for the pre-screening purpose of examining word embeddings in a specific task. Finally, the gains acquired from word embeddings are quantitatively measured from a nonparametric unsupervised perspective.
It would also be interesting to investigate sev-eral possible extensions to the current cluster-ing work. One direction is to learn a proper
ground distance for word embeddings such that the final document clustering performance can be improved with labeled data. The work by (Huang et al., 2016; Cuturi and Avis,2014) have partly touched this goal with an emphasis on document proximities. A more appealing direction is to develop problem-driven methods to represent a document as a distributional entity, taking into consideration of phrases, sentence structures, and syntactical characteristics. We believe the frame-work of Wasserstein distance and D2-clustering creates room for further investigation on complex structures and knowledge carried by documents.
Acknowledgments
This material is based upon work supported by the National Science Foundation under Grant Nos. ECCS-1462230, DMS-1521092, and Research Grants Council of Hong Kong under Grant No. PolyU 152094/14E. The primary computational infrastructures used were supported by the Foun-dation under Grant Nos. ACI-0821527 (Cyber-Star) and ACI-1053575 (XSEDE).
References
Martial Agueh and Guillaume Carlier. 2011. Barycen-ters in the Wasserstein space. SIAM J. Math. Analysis43(2):904–924.
Mikhail Belkin and Partha Niyogi. 2001. Laplacian eigenmaps and spectral techniques for embedding and clustering. InAdvances in Neural Information Processing Systems (NIPS). volume 14, pages 585– 591.
Jean-David Benamou, Guillaume Carlier, Marco Cu-turi, Luca Nenna, and Gabriel Peyr´e. 2015. It-erative Bregman projections for regularized trans-portation problems.SIAM J. Sci. Computing (SJSC) 37(2):A1111–A1138.
David M Blei, Andrew Y Ng, and Michael I Jordan. 2003. Latent dirichlet allocation. J. Machine Learning Research (JMLR)3:993–1022.
Deng Cai, Xiaofei He, and Jiawei Han. 2005. Docu-ment clustering using locality preserving indexing. Trans. Knowledge and Data Engineering (TKDE) 17(12):1624–1637.
Marco Cuturi and David Avis. 2014. Ground metric learning. Journal of Machine Learning Research 15(1):533–564.
Scott C. Deerwester, Susan T Dumais, Thomas K. Lan-dauer, George W. Furnas, and Richard A. Harshman. 1990. Indexing by latent semantic analysis. J. American Soc. Information Science41(6):391–407. Charles Elkan. 2003. Using the triangle inequality to accelerate k-means. InInt. Conf. Machine Learning (ICML). volume 3, pages 147–153.
Xiaofei He and Partha Niyogi. 2004. Locality preserv-ing projections. InAdvances in Neural Information Processing Systems (NIPS). MIT, volume 16, page 153.
Matthew Hoffman, Francis R Bach, and David M Blei. 2010. Online learning for latent Dirichlet allocation. In Advances in Neural Information Processing Systems (NIPS). pages 856–864. Gao Huang, Chuan Guo, Matt J Kusner, Yu Sun, Fei
Sha, and Kilian Q Weinberger. 2016. Supervised word mover’s distance. InAdvances in Neural In-formation Processing Systems (NIPS). pages 4862– 4870.
Matt J Kusner, Yu Sun, Nicholas N I. Kolkin, and K Q. Weinberger. 2015. From word embeddings to document distances. InInt. Conf. Machine Learning (ICML).
Quoc Le and Tomas Mikolov. 2014. Distributed representations of sentences and documents. InInt. Conf. Machine Learning. pages 1188–1196. Daniel D Lee and H Sebastian Seung. 1999. Learning
the parts of objects by non-negative matrix factor-ization. Nature401(6755):788–791.
Jia Li and James Z Wang. 2008. Real-time computer-ized annotation of pictures. Trans. Pattern Analysis and Machine Intelligence (PAMI)30(6):985–1002. Tomas Mikolov, Ilya Sutskever, Kai Chen, Greg S
Corrado, and Jeff Dean. 2013a. Distributed rep-resentations of words and phrases and their com-positionality. In Advances in Neural Information Processing Systems (NIPS). pages 3111–3119. Tomas Mikolov, Wen-tau Yih, and Geoffrey Zweig.
2013b. Linguistic regularities in continuous space word representations. InHLT-NAACL. pages 746– 751.
James B Orlin. 1993. A faster strongly polynomial minimum cost flow algorithm. Operations research 41(2):338–350.
Jeffrey Pennington, Richard Socher, and Christopher D Manning. 2014. Glove: Global vectors for word representation. In Empirical Methods in Natural Language Processing (EMNLP). volume 14, pages 1532–1543.
William M Rand. 1971. Objective criteria for the evaluation of clustering methods. J. American Statistical Association66(336):846–850.
Andrew Rosenberg and Julia Hirschberg. 2007. V-measure: A conditional entropy-based external cluster evaluation measure. In EMNLP-CoNLL. volume 7, pages 410–420.
Sameer Singh, Amarnag Subramanya, Fernando Pereira, and Andrew McCallum. 2011. Large-scale cross-document coreference using distributed inference and hierarchical models. In ACL-HLT. Association for Computational Linguistics, pages 793–803.
Karen Sparck Jones. 1972. A statistical interpretation of term specificity and its application in retrieval. J. Documentation28(1):11–21.
Alexander Strehl and Joydeep Ghosh. 2003. Clus-ter ensembles—a knowledge reuse framework for combining multiple partitions.J. Machine Learning Research (JMLR)3:583–617.
C´edric Villani. 2003.Topics in optimal transportation. 58. American Mathematical Soc.
Nguyen Xuan Vinh, Julien Epps, and James Bailey. 2010. Information theoretic measures for cluster-ings comparison: Variants, properties, normaliza-tion and correcnormaliza-tion for chance.J. Machine Learning Research (JMLR)11:2837–2854.
Xiaojun Wan. 2007. A novel document similarity mea-sure based on earth movers distance. Information Sciences177(18):3718–3730.
Huahua Wang and Arindam Banerjee. 2014. Bregman alternating direction method of multipliers. In Advances in Neural Information Processing Systems (NIPS). pages 2816–2824.
Zhaohui Wu, Chen Liang, and C Lee Giles. 2015. Storybase: Towards building a knowledge base for news events. InACL-IJCNLP 2015. pages 133–138. Wei Xu, Xin Liu, and Yihong Gong. 2003. Document clustering based on non-negative matrix factoriza-tion. In ACM SIGIR Conf. on Research and Development in Informaion Retrieval. ACM, pages 267–273.
Jianbo Ye and Jia Li. 2014. Scaling up discrete distribution clustering using admm. In Int. Conf. Image Processing (ICIP). IEEE, pages 5267–5271. Jianbo Ye, Panruo Wu, James Z. Wang, and Jia Li.
2017. Fast discrete distribution clustering using Wasserstein barycenter with sparse support. IEEE Trans. on Signal Processing (TSP) 65(9):2317– 2332.
Zhongwu Zhai, Bing Liu, Hua Xu, and Peifa Jia. 2011. Clustering product features for opinion mining. In Int. Conf. on Web Search and Data Mining (WSDM). ACM, pages 347–354.