2572
Predicting Human Activities from User-Generated Content
Steven R. Wilson and Rada Mihalcea University of Michigan
{steverw,mihalcea}@umich.edu
Abstract
The activities we do are linked to our inter-ests, personality, political preferences, and de-cisions we make about the future. In this pa-per, we explore the task of predicting human activities from user-generated content. We collect a dataset containing instances of social media users writing about a range of everyday activities. We then use a state-of-the-art sen-tence embedding framework tailored to recog-nize the semantics of human activities and per-form an automatic clustering of these activi-ties. We train a neural network model to make predictions about which clusters contain activ-ities that were performed by a given user based on the text of their previous posts and self-description. Additionally, we explore the de-gree to which incorporating inferred user traits into our model helps with this prediction task.
1 Introduction
What a person does says a lot about who they are. Information about the types of activities that a person engages in can provide insights about their interests (Goecks and Shavlik, 2000), per-sonality (Ajzen,1987), physical health (Bouchard et al., 2018), the activities that they are likely to do in the future (Ouellette and Wood,1998), and other psychological phenomena like personal val-ues (Rokeach, 1973). For example, it has been shown that university students who exhibit traits of interpersonal affect and self-esteem are more likely to attend parties (Paunonen and Ashton,
2001), and those that value stimulation are likely to watch movies that can be categorized as thrillers (Bardi and Schwartz,2003).
Several studies have applied computational ap-proaches to the understanding and modeling of hu-man behavior at scale (Yin et al., 2014) and in real time (Wang et al.,2015). However, this pre-vious work has mainly relied on specific devices or platforms that require structured definitions of
behaviors to be measured. While this leads to an accurate understanding of the types of activities being done by the involved users, these methods capture a relatively narrow set of behaviors com-pared to the huge range of things that people do on a day-to-day basis. On the other hand, publicly available social media data provide us with infor-mation about an extremely rich and diverse set of human activities, but the data are rarely structured or categorized, and they mostly exist in the form of natural language. Recently, however, natural language processing research has provided several examples of methodologies for extracting and rep-resenting human activities from text (Fast et al.,
2016;Wilson and Mihalcea,2017) and even mul-timodal data (Agrawal et al.,2016).
In this paper, we explore the task of predict-ing human activities from user-generated text data, which will allow us to gain a deeper understand-ing of the kinds of everyday activities that peo-ple discuss online with one another. Throughout the paper, we use the word “activity” to refer to what an individual user does or has done in their daily life. Unlike the typical use of this term in the computer vision community (Cheng et al., 2015;
Zhang et al., 2017), in this paper we use it in a broad sense, to also encompass non-visual activ-ities such as “make vacation plans” or “have a dream” We do not focus on fine-grained sequences actions such as “pick up a camera”, “hold a cam-era to one’s face”, “press the shutter release but-ton”, and others. Rather, we focus on the high-level activity as a person would report to others: “take a picture”. Additionally, we specifically fo-cus on everyday human activities done by the users themselves, rather than larger-scale events (Atefeh and Khreich,2015), which are typically character-ized by the involvement or interest of many users, often at a specific time and location.
describ-ing human activities is nearly limitless, we pro-pose a set of human activity clusters that summa-rize a large set of several hundred-thousand self-reported activities. We then construct predictive models that are able to estimate the likelihood that a user has reported that they have performed an activity from any cluster.
The paper makes the following main contribu-tions. First, starting with a set of nearly 30,000 human activity patterns, we compile a very large dataset of more than 200,000 users undertaking one of the human activities matching these pat-terns, along with over 500 million total tweets from these users. Second, we use a state-of-the-art sentence embedding framework tailored to rec-ognize the semantics of human activities and cre-ate a set of activity clusters of variable granularity. Third, we explore a neural model that can predict human activities based on natural language data, and in the process also investigate the relationships between everyday human activities and other so-cial variables such as personal values.
2 Data
While we do not expect to know exactly what a person is doing at any given time, it is fairly com-mon for people to publicly share the types of activ-ities that they are doing by making posts, written in natural language, on social media platforms like Twitter. However, when taking a randomly sam-pled stream of tweets, we find that only a small fraction of the content was directly related to ac-tivities that the users were doing in the real world – instead, most instances are more conversational in nature, or contain the sharing of opinions about the world or links to websites or images. Using such a random sample would require us to filter out a large percentage of the total data collected, making the data collection process inefficient.
Therefore, in order to target only those tweets that are rich in human activity content, we formu-late a set of queries that allows us to use the Twit-ter Search API to find instances of users tweeting about common human activities. Each query con-tains a first-person, past-tense verb within a phrase that describes a common activity that people do. Using this approach, we are able to retrieve a set of tweets that contains a high concentration of hu-man activity content, and we also find that users who wrote these tweets are much more likely to have writtenothertweets that describe human ac-tivities (Table1). We build our set of human
[image:2.595.329.504.208.258.2]ac-Sampled tweets w/valid activities 2% Queried tweets w/valid activities 81% Addtl. user tweets w/valid activities 15%
Table 1: Effect of targeted query approach on activity frequency in tweets. “Valid activities” are defined as first-person verb phrases that clearly indicate that the author of the text has actually performed the concrete activity being described. For each set of tweets, a ran-dom subset of 100 was chosen and manually annotated for validity.
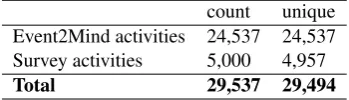
count unique Event2Mind activities 24,537 24,537 Survey activities 5,000 4,957
Total 29,537 29,494
Table 2: Number of human activity queries from mul-tiple sources.
tivity queries from two sources: the Event2Mind dataset (Rashkin et al.,2018) and a set of short ac-tivity surveys, which we collect ourselves, to ob-tain nearly 30K queries (Table2) .
2.1 Event2Mind Activities
The Event2Mind dataset contains a large number of event phrases which are annotated for intent and reaction. The events themselves come from four sources of phrasal events (stories, common n-grams found in web data, blogs, and English id-ioms), and many of them fall under our classifi-cation of human activities, making Event2Mind a great resource in our search for concrete examples of human activities. We consider events for which a person is the subject (e.g, “PersonX listens to PersonX’s music”) to be human activities, and re-move the rest (e.g., “It is Christmas morning”). We then use several simple rules to convert the Event2Mind instances into first-person past-tense activities. Since all events were already filtered so that they begin with “PersonX”, we replace the first occurrence of “PersonX” in each event with “I” and all subsequent occurrences with “me”. All occurrences of “PersonX’s” become “my”, and the main verb in each phrase is conjugated to its past-tense form using the Pattern python module.1 For example, the event “PersonX teaches PersonX’s son” becomes the query “I taught my son”. Since Event2Mind also contains wildcard placeholders that can match any span of text within the same
Total queries 29,494 Queried tweets 422,607 Avg. tweets/query 14.33 Valid queried tweets 335,357 Avg. valid tweets/query 11.37
Table 3: Summary of query results.
phrase (e.g., “PersonX buys at the store”)2but the Twitter API doesn’t provide a mechanism for wildcard search, we split the event on the string and generate a query that requires all substrings to appear in the tweet. We then check all candidate tweets after retrieval and remove any for which the substrings do not appear in the same order as the original pattern.
2.2 Short Survey Activities
In order to get an even richer set of human activ-ities, we also ask a set of 1,000 people across the United States to list any five activities that they had done in the past week. We collect our responses using Amazon Mechanical Turk,3 and manually verify that all responses are reasonable. We re-move any duplicate strings and automatically con-vert them into first-person and past-tense (if they were not in that form already). For this set of queries, there are no wildcards and we only search for exact matches. Example queries obtained us-ing this approach include “I went to the gym” and “I watched a documentary”.
2.3 Query Results
Using our combined set of unique human activity queries, we use the Twitter Search API4to collect the most recent 100 matches per query (the maxi-mum allowed by the API per request), as available, and we refer to these tweets as our set ofqueried tweets. We then filter the queried tweets as fol-lows: first, we verify that for any tweets requiring the match of multiple substrings (due to wildcards in the original activity phrase), the substrings ap-pear in the correct order and do not span multiple sentences. Next, we remove activity phrases that are preceded with indications that the author of the tweet did not actually perform the activity, such as “I wish” or “should I . . . ?”. We refer to the set
2We also treat instance of “PersonY” as a wildcard since
this could be any name or even a user (@) mention on Twitter.
3www.mturk.com 4
developer.twitter.com/en/docs/tweets/search/api-reference/get-search-tweets.html
[image:3.595.318.513.160.248.2]Num. unique users 358,091 Additional tweets collected 560,526,633 Avg. additional tweets / user 1,565 Additional activities extracted 21,316,364 Avg. additional activities / user 59.52
Table 4: Summary of additional data.
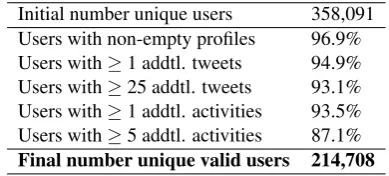
Initial number unique users 358,091 Users with non-empty profiles 96.9% Users with≥1 addtl. tweets 94.9% Users with≥25 addtl. tweets 93.1% Users with≥1 addtl. activities 93.5% Users with≥5 addtl. activities 87.1%
Final number unique valid users 214,708
Table 5: Summary valid user filtering.
of tweets left after this filtering as valid queried tweets(see Table3for more details).
In order to gather other potentially useful infor-mation about the users who wrote at least onevalid queried tweet, we collect both their self-written profile and their previously written tweets (up to 3,200 past tweets per user, as allowed by the Twit-ter API), and we refer to these as our set of ad-ditional tweets. We ensure that there is no over-lap between the sets ofqueried tweetsand addi-tional tweets, so in the unlikely case that a user has posted the same tweet multiple times, it cannot be included in both sets.
Further, we use a simple pattern-matching ap-proach to extract additional activities from these additional tweets. We search for strings that match I <VBD> .* <EOS> where <VBD> is any past-tense verb,.*matches any string (non-greedy), and <EOS> matches the end of a sen-tence. We then perform the same filtering as be-fore for indications that the person did not actu-ally do the activity, and we refer to these filtered matches as our set of additional activities (see Table 4 for more information). Note that since these additional activitiescan contain any range of verbs, they are naturally noisier than our set of valid query tweets, and we therefore do not treat them as a reliable “ground truth” source of self-reported human activities, but as a potentially use-ful signal of activity-related information that can be associated with users in our dataset.
addi-tional tweets, and those with less than 5 addiaddi-tional activities (Table5).
2.4 Creating Human Activity Clusters
Given that the set of possible human activity phrases is extremely large and it is unlikely that the same phrase will appear multiple times, we make this space more manageable by first performing a clustering over the set ofactivity phrase instances that we extract from allvalid queried tweets. We define an activity phrase instance as the set of words matching an activity query, plus all follow-ing words through the end of the sentence in which the match appears. By doing this clustering, our models will be able to make a prediction about the likelihood that a user has mentioned activities from each cluster, rather than only making predic-tions about a single point in the semantic space of human activities.
In order to cluster ouractivity phrase instances, we need to define a notion of distance between any pair of instances. For this, we turn to prior work on models to determine semantic similar-ity between human activsimilar-ity phrases (Zhang et al.,
2018) in which the authors utilized transfer learn-ing in order to fine-tune the Infersent (Conneau et al.,2017) sentence similarity model to specifi-cally capture relationships between human activ-ity phrases. We use the authors’ BiLSTM-max sentence encoder trained to capture the related-ness dimension of human activity phrases5 to ob-tain vector representations of each of our activity phrases. The measure of distance between vectors produced by this model was shown to be strongly correlated with human judgments of general activ-ity relatedness (Spearman’sρ =.722between the model and human ratings, while inter-annotator agreement is.768).
While the relationship between two activity phrases can be defined in a number of ways ( Wil-son and Mihalcea, 2017), we we chose a model that was optimized to capture relatedness so that our clusters would contain groups of related ac-tivities without enforcing that they are strictly the same activity. Since the model that we employed was trained on activity phrases in the infinitive form, we again use the Pattern python library, this time to convert all of our past-tense activities to this form. We also omit the leading first person pronoun from each phrase, and remove user men-tions (@<user>), hashtags, and URLs. We then
5Shared by the first author of the referenced paper.
“Cooking”
make cauliflower stir-fry for dinner make garlic and olive oil vermicelli for lunch start cooking bacon in the oven (on foil in a sheet)
burn the turkey
make perfect swordfish steaks tonight
“Pet/Animal related”
get a new pet spider today cuddle 4 dogs get a pet sitter
feel so happy being able to pet kitties today spend some time with cats
“Spectating”
watch football italia watch a football game in the pub
watch basketball today watch sports
watch fireworks today in the theatre
“Passing Examinations”
ace the exam pass one’s exam thank god get a perfect score on one’s exam
[image:4.595.309.523.59.356.2]get a c on one’s french exam pass another exam omg
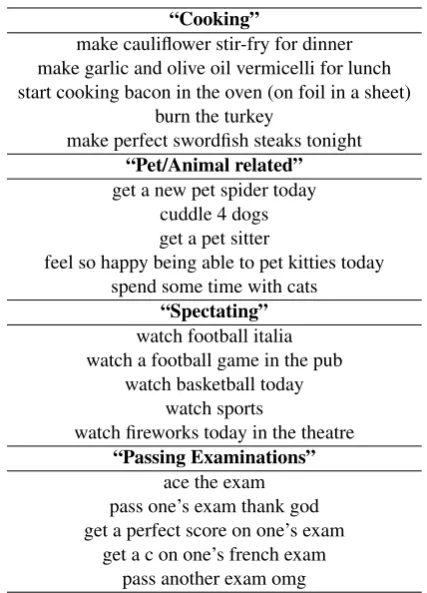
Table 6: Examples of clustered activities (with manu-ally provided labels, for reference purposes only).
define the distance between any two vectors using cosine distance, i.e., 1− A·B
||A||||B||, for vectors A andB.
We use K-means clustering in order to find a set of kact clusters that can be used to
repre-sent the semantic space in which the activity vec-tors lie. We experiment with kact = 2n with
n∈Z∩[3,13]and evaluate the clustering results using several metrics that do not require super-vision: within-cluster variance, silhouette coeffi-cient (Rousseeuw,1987), Calinski-Harabaz crite-rion (Cali´nski and Harabasz, 1974), and Davies-Bouldin criterion (Davies and Bouldin, 1979). In practice, however, we find that these metrics are strongly correlated (either positively or nega-tively) with thekact, making it difficult to
quan-titatively compare the results of using a different number of clusters, and we therefore make a de-cision based on a qualitative analysis of the clus-ters.6 For the purpose of making these kinds of
6
Distance to “Cooking”: 0.11
cook breakfast cook the spaghetti
start cooking cook something simple start cooking a lot more
Distance to “Cooking”: 0.52
feed one’s ducks bread all the time give one’s dog some chicken
stop eating meat eat hot dogs and fries
get one’s dog addicted to marshmellows
Distance to “Cooking”: 0.99
take a picture with her post a photo of one
[image:5.595.75.288.58.278.2]bring something like 1000 rolls of film draw a picture of us holding hands capture every magical moment to give to the bride
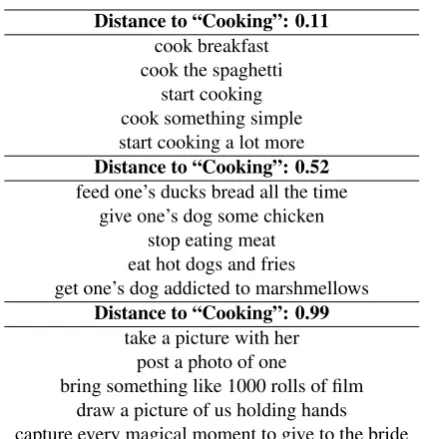
Table 7: Three sample clusters and their distances from the first cluster in Table6, showing the closest cluster, a somewhat distant cluster, and a very distant cluster.
predictions about clusters, it is beneficial to have a smaller number of larger clusters, but clusters that are too large are no longer meaningful since they contain sets of activities that are less strongly re-lated to one another. In the end, we find that using
210 = 1024clusters leads to a good balance be-tween cluster size and specificity, and we use this configuration for our prediction experiments mov-ing forward. Examples of activities that were as-signed the same cluster label are shown in Table6, and Table7illustrates the notion of distance within our newly defined semantic space of human activi-ties. For example, two cooking-related clusters are near to one another, while a photography-related cluster is very distant from both.
3 Methodology
Given a set of activity clusters and knowledge about the users who have reported to have partic-ipated in these activities, we explore the ability of machine learning models to make inferences about which activities are likely to be next performed by a user. Here we describe the supervised learning setup, evaluation, and neural architecture used for the prediction task.
3.1 Problem Statement
We formulate our prediction problem as follows: for a given user, we would like to produce a prob-ability distribution over all activity clusters such
that:
argmax
ci∈C
P(ci|h,p,a) =ct,
whereCis a set of activity clusters,h,p, andaare vectors that represent the user’s history, profile, and attributes, respectively, and ct is the target
cluster. The target cluster is the cluster label of an activity cluster that contains an activity that is known to have been performed by the user.
If a model is able to accurately predict the tar-get cluster, then it is able to estimate the general type of activity that the user is likely to write about doing in the future given some set of information about the user and what they have written in the past. By also generating a probability distribution over the clusters, we can assign a likelihood that each user will write about performing each group of activities in the future. For example, such a model could predict the likelihood that a person will claim to engage in a “Cooking” activity or a “Pet/Animal related” activity.
The ability to predict the exact activity cluster correctly is an extremely difficult task, and in fact, achieving that alone would be a less informative result than producing predictions about the like-lihood of all clusters. Further, in our setup, we only have knowledge about a sample of activities that people actually have done. In reality, it is very likely that users have participated in activi-ties that belong to a huge variety of clusters, re-gardless of which activities were actually reported on social media. Therefore, it should be sufficient for a model to give a relatively high probability to any activity that has been reported by a user, even if there is no report of the user having performed an activity from the cluster with the highest prob-ability for that user.
3.2 Model Architecture
As input to our activity prediction model, we use three major components: a user’shistory,profile, and attributes. We represent a history as a se-quence of documents,D, written by the user, that contain information about the kinds of activities that they have done. Lett=|D|, and each docu-ment inDis represented as a sequence of tokens. We experiment with two sources forD: all addi-tional tweetswritten by a user, or only the addi-tional activities contained in tweets written by a user, which is a direct subset of the text contained in the full set of tweets.
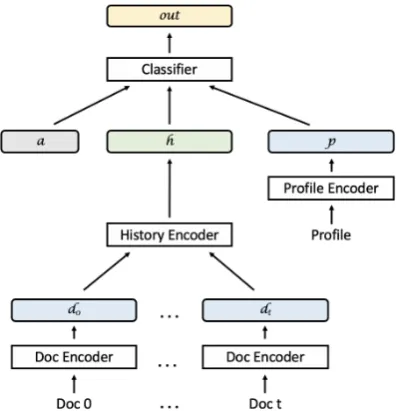
Figure 1: Predictive model architecture.
represented as a sequence of tokens. For each user, we populate theprofileinput using the plain text user description associated with their account, which often contains terms which express self-identity such as “republican” or “athiest.”
We represent the tokens in both the user’s history and profile with the pretrained 100-dimensional GloVe-Twitter word embeddings (Pennington et al.,2014), and preprocess all text with the script included with these embeddings.7
Finally, our model allows the inclusion of any additional attributes that might be known or in-ferred in order to aid the prediction task, which can be passed to the model as adimadimensional
real-valued vector. For instance, we can use per-sonal values as a set of attributes, as described in Section3.3.
We train a deep neural model, summarized in Figure1, to take a user’shistory,profile, and at-tributes, and output a probability distribution over the set of kact clusters of human activities,
indi-cating the likelihood that the user has reported to have performed an activity in each cluster. There are four major components of our network:
Document Encoder This is applied to each of the tdocuments in the history– either an activity phrase or a full tweet. For documentiinD, it takes a sequence of token embeddings as in-put and produces adimddimensional vector,
dias output.
History Encoder This layer takes the sequence
7nlp.stanford.edu/projects/glove/preprocess-twitter.rb
{d0, . . . ,dt} as input and produces a
sin-gledimH dimensional vector, h, as output,
intended to represent high-level features ex-tracted from the entirehistoryof the user.
Profile Encoder Takes each token in the user’s profile as input and produces a single dimp
dimensional vector,pas output.
Classifier As input, this module takes the con-catenationa⊕h⊕p, whereais the prede-fined attribute vector associated with the user. Then, a prediction is made for each of thekact
clusters, first applying softmax in order to ob-tain a probability distribution. We refer to the dimension of the output asdimo.
For any of the three encoder layers, several layer types can be used, including recurrent, convo-lutional, or self-attention based (Vaswani et al.,
2017) layers. The classifier layer is the only layer that does not take a sequence as input and we implement it using a simple feed-forward multi-layer network containing`clayers withhchidden
units each. The network is trained with cross-entropy loss, which has been shown to perform competitively when optimizing for top-k classifi-cation tasks (Berrada et al.,2018).
3.3 Incorporating Personal Values
While the attributesvectoracan be used to en-code any information of interest about a user, we choose to experiment with the use of personal val-ues because of their theoretical connection to hu-man activities (Bardi and Schwartz, 2003). In order to get a representation of a user’s values, we turn to the hierarchical personal values lexi-con from (Wilson et al., 2018). In this lexicon, there are 50 value dimensions, represented as sets of words and phrases that characterize that value. Since users’ profiles often contain value-related content, we use the Distributed Dictionary Repre-sentations (DDR) method (Garten et al.,2018) to compute a score, sv for each value dimension,v,
using cosine similarity as follows:
sv =
R(prof ile)·R(lexiconv)
||R(prof ile)||||R(lexiconv)||
,
where R(·) is a representation of a set of vec-tors, which, for the DDR method, is defined as the mean vector of the set; prof ile is a set of word embeddings, one for each token in the user’s pro-file; andlexiconv is another set of word
dimensionv. Finally, we seta = (s0, . . . , sdimL)
where dimL = 50, the number of value
di-mensions in the lexicon. Examples of profiles with high scores for sample value dimensions are shown in Table8.
Category Top Scoring Profile
Family a mother to my son
Nature Environment & nat resource economist tweeting about cli-mate change/risk, energy, envi-ronmental protection, green fi-nance, commodities, data sci-ence, politics
Work-Ethic Football is like life - it requires perseverance, self-denial, hard work, sacrifice, dedication and respect for authority
[image:7.595.82.281.138.310.2]Religion /Galatians 2:20/ I love our Lord Jesus Christ.
Table 8: Profiles scoring the highest for various values categories when measured with the values lexicon.
Further, we explore the types of activity clusters that contain activities reported by users with high scores for various value dimensions. For a given value, we compute a score for each clustersCv by taking the average sv of all users who tweeted
about doing activities in the cluster. For each value v, we can then rank all clusters by theirsCv score. Examples of those with the highest scores are pre-sented in Table 9. We observe that users whose profiles had high scores for Family were likely to report doing activities including family members, those with high scores for Nature tweeted about travel, and those with high Work-Ethic scores re-ported performing writing related tasks.
Category Activities in High Scoring Cluster
give one’s daughter a number of plants Family take one’s family to the park
work in the garden with mom visit another castle
Nature visit france go on a fishing trip
add another footnote to the dissertation Work-Ethic file a complaint with the fcc
write one’s first novel by hand follow the rules
Religion study really hard do a good deed
Table 9: Activity clusters associated with the highest scoring users for various values categories when mea-sured with the values lexicon.
3.4 Evaluation
We evaluate our activity prediction models using a number of metrics that consider not only the most likely cluster, but also the set ofkeval most likely
clusters. First, we evaluate the average per-class accuracy of the model’s ability to rankct, the
tar-get cluster, within the top keval clusters. These
scores tell us how well the model is able to make predictions about the kinds of activities that each user is likely to do.
Second, we test how well the model is able to sort users by their likelihood of having reported to do an activity from a cluster. This average compar-ison rank (ACR) score is computed as follows: for each user in the test set, we samplenother users who do not have the same activity label. Then, we use the probabilities assigned by the model to rank alln+ 1 users8 by their likelihood of being assignedct, and the comparison rank score is the
percentage of users who were ranked ahead of the target user (lower is better). We then average this comparison rank across all users in the test set to get the ACR. The ACR score tells us how well the model is able to find a rank users based on their likelihood of writing about doing a given activity, which could be useful for finding, e.g., the users who are most likely to claim that they “purchased some pants” or least likely to mention that they “went to the gym” in the future.
4 Experiments and Results
We split our data at the user-level, and from our set of valid users we use 200,000 instances for train-ing data, 10,000 as test data, and the rest as our validation set.
For the document encoder and profile encoder we use Bi-LSTMs with max pooling (Conneau et al.,2017), withdimd = 128anddimp = 128.
For the history encoder, we empirically found that single mean pooling layer over the set of all docu-ment embeddings outperformed other more com-plicated architectures, and so that is what we use in our experiments. Finally, the classifier is a 3-layer feed-forward network with and dimc = 512 for
the hidden layers, followed by a softmax over the dimo-dimensional output. We use Adam (Kingma
and Ba,2014) as our optimizer, set the maximum number of epochs to 100, and shuffle the order of the training data at each epoch. During each
train-8
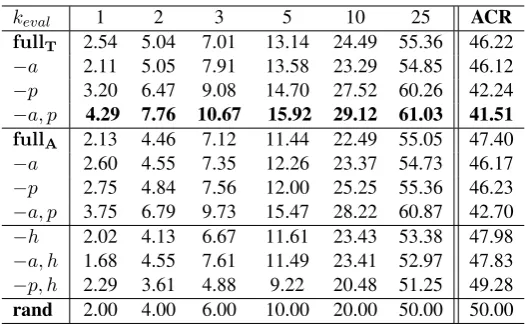
[image:7.595.74.296.560.719.2]keval 1 2 3 5 10 25 ACR
fullT 2.54 5.04 7.01 13.14 24.49 55.36 46.22
−a 2.11 5.05 7.91 13.58 23.29 54.85 46.12 −p 3.20 6.47 9.08 14.70 27.52 60.26 42.24 −a, p 4.29 7.76 10.67 15.92 29.12 61.03 41.51
fullA 2.13 4.46 7.12 11.44 22.49 55.05 47.40
−a 2.60 4.55 7.35 12.26 23.37 54.73 46.17 −p 2.75 4.84 7.56 12.00 25.25 55.36 46.23 −a, p 3.75 6.79 9.73 15.47 28.22 60.87 42.70 −h 2.02 4.13 6.67 11.61 23.43 53.38 47.98 −a, h 1.68 4.55 7.61 11.49 23.41 52.97 47.83 −p, h 2.29 3.61 4.88 9.22 20.48 51.25 49.28
[image:8.595.167.430.60.222.2]rand 2.00 4.00 6.00 10.00 20.00 50.00 50.00
Table 10: Per-class accuracy (%) @kevaland ACR scores for the 50-class prediction task. Note that removingh from eitherfullTorfullAgives the same model. For ACR only, lower is better.
ing step, we represent each user’s history as a new random sample ofmax sample docs= 100 doc-uments9if there are more thanmax sample docs documents available for the user, and we use a batch size of 32 users. Since there is a class im-balance in our data, we use sample weighting in order to prevent the model from converging to a solution that simply predicts the most common classes present in the training data. Each sample is weighted according to its class,c, using the fol-lowing formula:
wc=
N count(c)∗dimo
wherecount(c)is the number of training instances belonging to classc. We evaluate our model on the development data after each epoch and save the model with the highest per-class accuracy. Finally, we compute the results on the test data using this model, and report these results.
We test several configurations of our model. We use the complete model described in section 3.2
using either the set of additional tweets written by a user as theirhistory(fullT), or only the set
ofadditional activities contained in those tweets (fullA). Then, to test the effect of the various
model components, we systematically ablate the attributes vector inputa, the profile text (and sub-sequently, the Profile Encoder layer) p, and the set of documents, D, comprising the history along with the Document and History Encoders, thereby removing thehvector as input to the classifier. We also explore removing pairs of these inputs at the same time. To contextualize the results, we also
9
We empirically found that increasing this value beyond 100 had little effect on the development accuracy.
include the theoretical scores achieved by random guessing, labeled asrand.10
We consider two variations on our dataset: the first is a simplified, 50-class classification prob-lem. We choose the 50 most common clusters out of our full set ofkact = 1024and only make
predictions about users who have reportedly per-formed an activity in one of these clusters. The second variation uses the entire dataset, but rather than making predictions about allkactclasses, we
only make fine-grained predictions about those classes for which count(c) ≥ minCount. We do this under the assumption that training an adequate classifier for a given class requires at leastminCountexamples. All classes for which count(c) < minCount are assigned an “other” label. In this way, we still make a prediction for every instance in the dataset, but we avoid allow-ing the model to try to fit to a huge landscape of outputs when the training data for some of these outputs is insufficient. By setting minCount to 100, we are left with 805 out of 1024 classes, and an 806th “other” class for our 806-class setup. Note that this version includes all activities from all 1024 clusters, it is just that the smallest clus-ters are grouped together with the “other” label.
While our models are able to make predictions indicating that learning has taken place, it is clear that this prediction task is difficult. In the 50-class setup, thefullT−a, pmodel consistently had the
strongest average per-class accuracy for all values of keval and the lowest (best) ACR score (Table
10). ThefullA−a, pmodel performed nearly as
well, showing that using only the human-activity
10
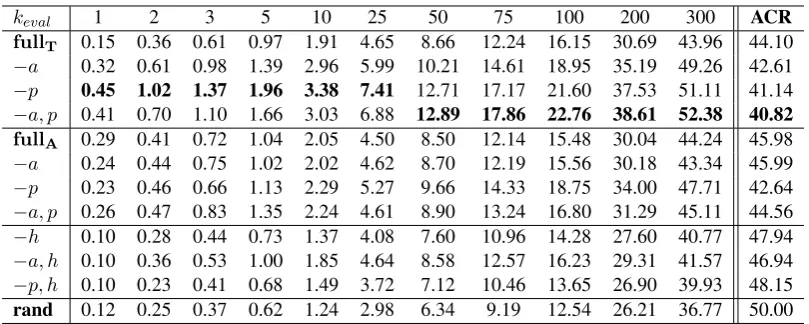
keval 1 2 3 5 10 25 50 75 100 200 300 ACR
fullT 0.15 0.36 0.61 0.97 1.91 4.65 8.66 12.24 16.15 30.69 43.96 44.10
−a 0.32 0.61 0.98 1.39 2.96 5.99 10.21 14.61 18.95 35.19 49.26 42.61 −p 0.45 1.02 1.37 1.96 3.38 7.41 12.71 17.17 21.60 37.53 51.11 41.14 −a, p 0.41 0.70 1.10 1.66 3.03 6.88 12.89 17.86 22.76 38.61 52.38 40.82
fullA 0.29 0.41 0.72 1.04 2.05 4.50 8.50 12.14 15.48 30.04 44.24 45.98
−a 0.24 0.44 0.75 1.02 2.02 4.62 8.70 12.19 15.56 30.18 43.34 45.99 −p 0.23 0.46 0.66 1.13 2.29 5.27 9.66 14.33 18.75 34.00 47.71 42.64 −a, p 0.26 0.47 0.83 1.35 2.24 4.61 8.90 13.24 16.80 31.29 45.11 44.56 −h 0.10 0.28 0.44 0.73 1.37 4.08 7.60 10.96 14.28 27.60 40.77 47.94 −a, h 0.10 0.36 0.53 1.00 1.85 4.64 8.58 12.57 16.23 29.31 41.57 46.94 −p, h 0.10 0.23 0.41 0.68 1.49 3.72 7.12 10.46 13.65 26.90 39.93 48.15
[image:9.595.97.502.60.222.2]rand 0.12 0.25 0.37 0.62 1.24 2.98 6.34 9.19 12.54 26.21 36.77 50.00
Table 11: Per-class accuracy (%) @kevaland ACR scores for the 806-class prediction task. Note that removingh from eitherfullTorfullAgives the same model. For ACR only, lower is better.
relevant content from a user’shistorygives simi-lar results to using the full set of content available. When including the attributes andprofile for a user, the model typically overfits quickly and gen-eralization deteriorates.
In the 806-class version of the task, we observe the effects of including a larger range of activi-ties, including many that do not appear as often as others in the training data (Table11). This version of the task also simulates a more realistic scenario, since predictions can be made for the “other” class when the model does to expect the user to claim to do an activity fromanyof the known clusters. In this setting, we see that thefullT−pmodel works
well for keval ≤ 25, suggesting that the use of
theattributevectors helps, especially when pre-dicting the correct cluster within the top 25 is im-portant. Forkeval ≥ 50, the same fullT −a, p
model that worked best in the 50-class setup again outperforms the others. Here, in contrast to the 50-class setting, using the full set of tweets usu-ally performs better than focusing only on the hu-man activity content. Interestingly, the best ACR scores are even lower in the 806-class setup, show-ing that it is just as easy to rank users by their like-lihood of writing about an activity, even when con-sidering many more activity clusters.
5 Conclusions
In this paper, we addressed the task of predict-ing human activities from user-generated content. We collected a large Twitter dataset consisting of posts from more than 200,000 users mentioning at least one of the nearly 30,000 everyday activi-ties that we explored. Using sentence embedding models, we projected activity instances into a
vec-tor space and perform clustering in order to learn about the high-level groups of behaviors that are commonly mentioned online. We trained predic-tive models to make inferences about the likeli-hood that a user had reported to have done activi-ties across the range of clusters that we discovered, and found that these models were able to achieve results significantly higher than random guessing baselines for the metrics that we consider. While the overall prediction scores are not very high, the models that we trained do show that they are able to generalize findings from one set of users to an-other. This is evidence that the task is feasible, but very difficult, and it could benefit from further investigation.
We make the activity clusters, models, and code for the prediction task available at http://lit.eecs.umich.edu/downloads.html
Acknowledgments
References
Harsh Agrawal, Arjun Chandrasekaran, Dhruv Batra, Devi Parikh, and Mohit Bansal. 2016. Sort story: Sorting jumbled images and captions into stories. In Proceedings of the 2016 Conference on Empiri-cal Methods in Natural Language Processing, pages 925–931.
Icek Ajzen. 1987. Attitudes, traits, and actions: Dis-positional prediction of behavior in personality and social psychology. InAdvances in experimental so-cial psychology, volume 20, pages 1–63. Elsevier.
Farzindar Atefeh and Wael Khreich. 2015. A survey of techniques for event detection in twitter. Computa-tional Intelligence, 31(1):132–164.
Anat Bardi and Shalom H Schwartz. 2003. Val-ues and behavior: Strength and structure of rela-tions. Personality and social psychology bulletin, 29(10):1207–1220.
Leonard Berrada, Andrew Zisserman, and M Pawan Kumar. 2018. Smooth loss functions for deep top-k classification. arXiv preprint arXiv:1802.07595.
Claude Bouchard, Steven N Blair, and William L Haskell. 2018. Physical activity and health. Human Kinetics.
Tadeusz Cali´nski and Jerzy Harabasz. 1974. A den-drite method for cluster analysis. Communications in Statistics-theory and Methods, 3(1):1–27.
Guangchun Cheng, Yiwen Wan, Abdullah N Sauda-gar, Kamesh Namuduri, and Bill P Buckles. 2015. Advances in human action recognition: A survey.
arXiv preprint arXiv:1501.05964.
Alexis Conneau, Douwe Kiela, Holger Schwenk, Loic Barrault, and Antoine Bordes. 2017. Supervised learning of universal sentence representations from natural language inference data. arXiv preprint arXiv:1705.02364.
David L Davies and Donald W Bouldin. 1979. A cluster separation measure. IEEE transactions on pattern analysis and machine intelligence, (2):224– 227.
Ethan Fast, William McGrath, Pranav Rajpurkar, and Michael S Bernstein. 2016. Augur: Mining human behaviors from fiction to power interactive systems. InProceedings of the 2016 CHI Conference on Hu-man Factors in Computing Systems, pages 237–247. ACM.
Justin Garten, Joe Hoover, Kate M Johnson, Rei-hane Boghrati, Carol Iskiwitch, and Morteza De-hghani. 2018. Dictionaries and distributions: Com-bining expert knowledge and large scale textual data content analysis. Behavior research methods, 50(1):344–361.
Jeremy Goecks and Jude Shavlik. 2000. Learning users’ interests by unobtrusively observing their nor-mal behavior. In Proceedings of the 5th inter-national conference on Intelligent user interfaces, pages 129–132. ACM.
Diederik P Kingma and Jimmy Ba. 2014. Adam: A method for stochastic optimization. arXiv preprint arXiv:1412.6980.
Judith A Ouellette and Wendy Wood. 1998. Habit and intention in everyday life: The multiple processes by which past behavior predicts future behavior. Psy-chological bulletin, 124(1):54.
Sampo V Paunonen and Michael C Ashton. 2001. Big five factors and facets and the prediction of behav-ior. Journal of personality and social psychology, 81(3):524.
Jeffrey Pennington, Richard Socher, and Christopher Manning. 2014. Glove: Global vectors for word representation. InProceedings of the 2014 confer-ence on empirical methods in natural language pro-cessing (EMNLP), pages 1532–1543.
Hannah Rashkin, Maarten Sap, Emily Allaway, Noah A. Smith, and Yejin Choi. 2018. Event2mind: Commonsense inference on events, intents, and re-actions. InACL.
Milton Rokeach. 1973. The nature of human values.
Free press.
Peter J Rousseeuw. 1987. Silhouettes: a graphical aid to the interpretation and validation of cluster anal-ysis. Journal of computational and applied mathe-matics, 20:53–65.
Ashish Vaswani, Noam Shazeer, Niki Parmar, Jakob Uszkoreit, Llion Jones, Aidan N Gomez, Łukasz Kaiser, and Illia Polosukhin. 2017. Attention is all you need. InAdvances in Neural Information Pro-cessing Systems, pages 5998–6008.
Rui Wang, Gabriella Harari, Peilin Hao, Xia Zhou, and Andrew T Campbell. 2015. Smartgpa: how smartphones can assess and predict academic per-formance of college students. InProceedings of the 2015 ACM international joint conference on per-vasive and ubiquitous computing, pages 295–306. ACM.
Steven R Wilson and Rada Mihalcea. 2017. Measur-ing semantic relations between human activities. In
Proceedings of the Eighth International Joint Con-ference on Natural Language Processing (Volume 1: Long Papers), volume 1, pages 664–673.
Hongzhi Yin, Bin Cui, Ling Chen, Zhiting Hu, and Zi Huang. 2014. A temporal context-aware model for user behavior modeling in social media systems. In Proceedings of the 2014 ACM SIGMOD inter-national conference on Management of data, pages 1543–1554. ACM.
Li Zhang, Steven R. Wilson, and Rada Mihalcea. 2018.
Direct network transfer: Transfer learning of sen-tence embeddings for semantic similarity. CoRR, abs/1804.07835.
Shugang Zhang, Zhiqiang Wei, Jie Nie, Lei Huang, Shuang Wang, and Zhen Li. 2017. A review on hu-man activity recognition using vision-based method.