ORIGINAL RESEARCH
Do Transient Ischemic Attacks with
Diffusion-Weighted Imaging Abnormalities Correspond to
Brain Infarctions?
C. Oppenheim C. Lamy E. Touze´ D. Calvet M. Hamon J.-L. Mas J.-F. Me´der
BACKGROUND AND PURPOSE:Our aim was to determine whether diffusion-weighted imaging (DWI) changes associated with transient ischemic attack (TIA) are reversible or correspond to permanent tissue injury.
METHODS: Among 103 consecutive patients admitted for TIA, 36 (34.9%) had abnormalities on initial DWI (delay from TIA⫽30⫾33 hours [mean⫾SD]). Thirty-three patients (59 DWI lesions) had an MR imaging follow-up (delay from TIA⫽10.6⫾5 months) including fluid-attenuated inversion recovery, T2, DWI, and 3D T1-weighted sequences. For each lesion, we recorded the quantitative parameters on initial DWI (volume, apparent diffusion coefficient [ADC]) and performed a comparison between reversible and irreversible lesions.
RESULTS: MR imaging failed to detect any permanent injury in 7 patients and identified subsequent infarct in regions corresponding to the original DWI abnormalities in 26 patients (79%). Of the 59 lesions initially identified on DWI, 45 (76.3%) were associated with permanent injury on follow-up MR imaging. The DWI volume was significantly larger (0.91⫾1.7 versus 0.21⫾0.21 cm3,P⫽.003) and the ADC ratio values lower (79⫾15% versus 91⫾9%,P⫽.001) in lesions with subsequent infarct than in those that were fully reversible.
CONCLUSION:By showing that most patients with DWI-positive TIAs share the same imaging out-come as stroke patients, our data provide additional support for the redefinition of TIA, which considers that all cases of transient deficit with characteristic neuroimaging abnormalities should be diagnosed as a stroke.
B
rain imaging has challenged the assumption that because clinical transient ischemic attack (TIA) symptoms re-solve, significant ischemic tissue does not occur.1-4MRimag-ing usimag-ing diffusion-weighted imagimag-ing (DWI) reveals an isch-emic lesion in approximately half of all TIAs (range, 21%– 67%),1,4-11with the probability of DWI positivity increasing
with the duration of symptoms.7,12Therefore, the TIA
Work-ing Group has proposed a new definition of TIA as a brief episode of neurologic dysfunction presumptively caused by focal brain or retinal ischemia, with clinical symptoms typi-cally lasting less than 1 hour, and without neuroimaging evi-dence of acute infarction. The corollary is that persistent clin-ical signs or characteristic imaging abnormalities define infarction—that is, stroke.3This implicitly assumes that
im-aging changes associated with these transient focal neurologic symptoms correspond to permanent injury (ie, infarction), a question that remains to be answered. In particular, we need to determine how often these signal intensity changes lead to an established infarct. Case studies13,14and follow-up images in 9
nonconsecutive patients with TIA4have suggested that acute
DWI changes can reflect fully reversible ischemia. Conversely, another group recently described a series of 11 patients with TIA with DWI lesions at the hyperacute stage, all of which persisted at the subacute stage.15
To improve our knowledge of the pathophysiology of TIA-related DWI lesions, we performed a long-term MR follow-up of 33 consecutive TIA patients who initially had a positive DWI. We also compared TIA patients with a fully reversible lesion with the other patients, with the aim of identifying pa-rameters that are predictive of subsequent infarction.
Methods
Patient Population
We studied clinical and imaging data of 105 consecutive patients ad-mitted to our stroke unit for a TIA over a 15-month period (between January 1, 2003, and March 31, 2004). A senior neurologist initially examined all patients on admission. TIAs were defined as symptoms of presumed ischemic cerebrovascular origin lasting less than 24 hours. Patients with isolated amaurosis fugax were included in the study. The following clinical data were compiled for all patients: age, sex, symptoms of TIA, duration of symptoms, number of events, vas-cular territory, identifiable cause of TIA.16For patients with multiple TIAs, only the longest attack was considered for the evaluation of the duration of symptoms. In cases of recurrent TIA events, the delay was calculated from the last event. All patients underwent routine blood biochemistry, electrocardiography, and cervical duplex ultrasonogra-phy. All but 2 patients had transthoracic or transesophageal echocar-diography, and 79 patients had a cervical MR angiography.
All patients with TIA had brain MR imaging on the day of admis-sion as part of their routine work-up, except for 2 patients (MR con-traindication in 1 case and nonavailability of MR units in the other), leaving a group of 103 TIA patients. There were 58 men and 45 women, with a mean age⫾SD of 59.6⫾17.9 years. The mean dura-tion of symptoms was 1.8⫾3.4 hours. The median time from onset of TIA symptoms to initial MR imaging study was 24 hours (range, 3.3
Received September 27, 2005; accepted after revision December 8.
From the Departments of Neuroradiology (C.O., J.-F.M.) and Neurology (C.L., E.T., D.C., J.-L.M.), Universite´ Paris Descartes, Centre Hospitalier Sainte-Anne, Paris, France; Depart-ment of Neuroradiology, Centre Hospitalo-Universitaire, Caen, France, (M.H.); and Unite´ INSERM 562, Unite´ de Neuro-imagerie Anatomo Fonctionnelle (UNAF) Service Hospitalier Fre´de´ric Joliot, CEA/DRM/DSV, Orsay, France (C.O.)
hours to 11.7 days). One neuroradiologist (C.O.) reviewed all initial MRIs for bright signal intensity changes on DWI on a dedicated work-station. Of the 103 patients studied, 36 (34.9%) presented at least 1 hyperintense lesion. A follow-up MR imaging, performed as part of routine work-up, was available in all but 3 of these patients, leaving a study group of 33 patients (delay from TIA onset to follow-up MR imaging, 10.6 ⫾ 5 months; median, 11.5 months; range, 4 –22 months).
Initial MR Imaging
Initial imaging studies were performed on a 1.5T MR unit equipped with echo-planar capability (Signa; GE Medical Systems, Milwaukee, Wis). The initial MR imaging was performed according to our routine MR stroke protocol, including the following 3-pulse sequences ac-quired in the anterior commissure-posterior commissure (AC-PC) plane with 24 contiguous 6-mm sections: (1) single-shot, echo-pla-nar, spin-echo DWI with b⫽0, 1000 s/mm2(matrix, 128⫻128; field of view, 24⫻24 cm; repetition time/echo time [TR/TE], 5000/86; number of excitations [NEX], 2). The diffusion trace images were calculated from 3 DWI acquisitions with the diffusion gradients se-quentially applied along each of the 3 orthogonal axes; (2) fast fluid-attenuated inversion recovery (FLAIR) sequence (matrix, 256⫻160; field of view, 24⫻24 cm; TR/TE/inversion time [TI], 10,002/148/ 2200 ms; NEX, 1); (3) gradient echo T2*-weighted sequence (matrix, 256⫻224; field of view, 24⫻18 cm; TR/TE, 480/13 ms; flip angle, 25°; NEX, 1).
For patients with a positive initial DWI, a single neuroradiologist recorded the number of lesions and the affected arterial territory (an-terior, pos(an-terior, multiple). Blinded to the results of the follow-up MR imaging (see below), a single observer then analyzed each DWI lesion separately by measuring its volume and apparent diffusion coefficient (ADC) with the aid of an image analysis software (FuncTool; GE Medical Systems). Volume measurements of DWI lesions were done by outlining the hyperintense area on DWI manually. The final vol-ume for each lesion was then obtained by adding the contoured DWI lesion and multiplying by the section thickness. ADC maps were cre-ated from 2-point analysis and thresholded at 1200 mm2/s to mini-mize partial volume effect with the CSF. For each lesion, the ADC was computed using a small (size, 12⫾6; range, 5–23 mm2) circular region of interest (ROI) centered in the DWI hyperintensity. ROIs were mirrored onto the contralateral hemisphere to compute ADC ratios (rADC).
Follow-Up MR Imaging
The follow-up MR imaging included 4 sequences: DWI (matrix, 128⫻128; field of view, 24⫻24 cm; TR/TE, 5000/82.4; NEX, 2; section thickness, 5 mm; gap, 0.5 mm; imaging time, 40 seconds), fast FLAIR (matrix, 256⫻192; field of view, 24⫻24 cm; TR/TE/TI, 9802/156/2300 ms; NEX, 1; section thickness, 5 mm; gap, 0.5 mm; imaging time, 2 minutes 18 seconds), fast spin-echo (FSE) T2 (matrix 512⫻256; field of view, 24⫻24 cm; TR/TE, 7540/85.2 ms; NEX, 2; section thickness, 5 mm; gap, 0.5 mm; imaging time, 2 minutes 39 seconds), and a 3D fast-spoiled gradient echo T1-weighted sequence (124⫻1.4-mm axial sections; matrix, 256⫻256; field of view, 24⫻ 24 cm; TR/TE, 12/2.1 ms; NEX, 1; imaging time, 2 minutes 39 sec-onds). Except for the 3D T1 acquisition, all follow-up images were acquired in the AC-PC plane to ensure section positioning similar to that of the initial MR examinations. All but 4 patients completed the entire MR follow-up protocol. The remaining 4 patients underwent our routine MR stroke protocol including 2D T1 in the sagittal plane,
DWI, FLAIR, and T2-gradient echo, whereas the FSE T2- and 3D-T1-weighted sequence were missing.
All initial and follow-up MR images were retrospectively analyzed simultaneously on a dual-screen workstation. Where necessary, fol-low-up images were reformatted in the same plane as the initial MR acquisitions. On each follow-up MR image, a single neuroradiologist (C.O.) looked for signal intensity changes or signs of atrophy in a region corresponding to the initial DWI abnormalities. Each lesion was classified as either (1) fully reversible, when no signal intensity changes or atrophy existed on any of the follow-up MR images, or (2) infarction, when signal intensity changes or focal atrophy was seen. Patients harboring multiple lesions with different outcomes were classed in the infarction group.
Statistical Analysis
Analyses were performed with the SPSS statistical package (SPSS, Chicago, Ill). Patients with a fully reversible DWI lesion were com-pared with the others for age, sex, duration of symptoms, proportion with symptoms lasting less than 60 minutes, number of lesions on initial DWI (solitary versus multiple), delay from TIA onset to initial and follow-up MR imaging using nonparametric tests, including a Mann-WhitneyUtest for continuous variables and a Fisher exact test for categoric variables. We then considered each lesion individually and compared fully reversible lesions with those associated with sub-sequent permanent tissue injury for the quantitative DWI parameters (DWI volume, absolute ADC, and rADC) using a nonparametric Mann-Whitney test. Because these parameters were likely to be linked with each other, we also looked for any such correlation by using a Pearson correlation test. Finally, a multivariate logistic regression was conducted for variables that reachedP⬎.05 on the univariate anal-ysis. All descriptive statistics are expressed as mean⫾SD unless spec-ified otherwise.
Results
As detailed in Table 1, the 33 TIA patients with a positive initial DWI who underwent a follow-up MR imaging consisted of 23 men and 10 women with a mean age of 60.6⫾16 years. TIA symptoms were recorded as follows: aphasia (51.5%), motor weakness (70%), sensory disturbances (48%), visual deficits (12%), brain stem symptoms (12%), and cerebellar symptoms (3%). Isolated amaurosis fugax was observed in 1 case. Initial MR imaging (delay from TIA onset to MR imaging, 30⫾33 hours; median, 21 hours; range, 4 hours to 6 days) was ob-tained within 12 hours after the onset of TIA in 13 (39%) patients and within 24 hours in 21 (64%) patients. On initial DWI, lesions were solitary in 17 patients and multiple in 16 patients, with a total number of 59 lesions. Lesions were lo-cated in the anterior circulation in 22 patients, in the posterior circulation in 7 patients, and involved both of them in the remaining 4 patients. Forty-four lesions (74.6%) were cortical, and 15 (25.4%) were deeply located. Of the latter, there were 7 small and solitary DWI lesions, probably lacunar. On initial DWI, lesions were small (volume, 0.74⫾1.5 mL; range, 0.03– 10.4 mL) and ADC was moderately decreased (rADC⫽82⫾ 15%). There was a positive correlation between absolute ADC and rADC (P⬍.001,r⫽0.8), whereas absolute ADC or rADC was negatively correlated with the initial DWI lesion volume
(r⫽ ⫺0.47 and⫺0.52, respectively;P⬍.001).
In the 33 patients with TIA, follow-up MR imaging de-tected no permanent injury in 7 cases and identified a
subse-BRAIN
ORIGINAL
quent infarct in regions corresponding to the original DWI abnormalities in 26 (79.6%) patients (Figs 1–3). Of the 59 lesions initially identified on DWI, 45 (76.3%) were associated with permanent injury on follow-up MR imaging. If only le-sions initially imaged within 12 (n⫽24) or 24 hours (n⫽36) were considered, the rates of permanent injury on follow-up MR imaging were 83.3% and 78%, respectively. Over the whole study group, the most typical MR hallmark of the 45 infarcts was bright signal intensity on follow-up FLAIR and T2-weighted sequences, and dark signal intensity on T1-weighted sequence with various degrees of focal atrophy. However, 5 lesions lacked signal intensity changes on FLAIR and/or conventional T2-weighted sequences and were identi-fied solely because of focal atrophy or cortical bright spot on a T1-weighted sequence (Fig 4). Five additional cortical lesions were bright on FLAIR but not on FSE T2-weighted sequences. On DWI, most lesions were no longer visible, apart from 6 larger lesions that displayed a hypointense signal and 3 others associated with a T2 shine-through effect. Interestingly, in 1 patient, an additional, silent infarct was discovered in the cer-ebellum on MR follow-up. No patient had recent lesions seen as bright signal intensity on follow-up DWI.
The characteristics of patients with TIA, according to the presence or absence of permanent injury on follow-up MR im-aging, are presented in Table 1. None of the studied variables significantly dif-fered between patients with fully re-versible lesions and those with infarct. Patients with solitary lesions on initial DWI were more likely to be free of per-manent injury than those with multiple lesions, though this difference did not reach statistical significance (P⫽.08). As detailed in Table 2, all quantitative MR parameters derived from the initial DWI differed significantly between the 2 groups of patients: the DWI volume was significantly larger and the ADC values lower in lesions with subsequent infarction than in lesions that were fully versible. Except for the absolute ADC, these differences re-mained significant when only lesions initially imaged within 24 hours were considered (DWI volume:P⫽.02; rADC:P⫽ .035). Over the whole study group, half of the lesions with a DWI volume of less than 0.2 cm3(n⫽20) were reversible, whereas only 10% regressed when their initial DWI volume exceeded this arbitrary threshold (n⫽39). A multivariate lo-gistic regression with rADC and DWI volume showed that only rADC remained significantly associated of tissue out-come (P⫽.037).
Discussion
We found that 79.6% of TIA-related bright signals on initial DWI were the signature of established infarcts. To our knowl-edge, this is the first study to have focused on the long-term MR imaging outcome of TIA-related DWI lesions. Our results corroborate previous data obtained in a small subset of non-consecutive patients with TIA who all manifested a subse-quent infarct in the region corresponding to the original DWI lesion.10In line with this, subsequent infarction has also been
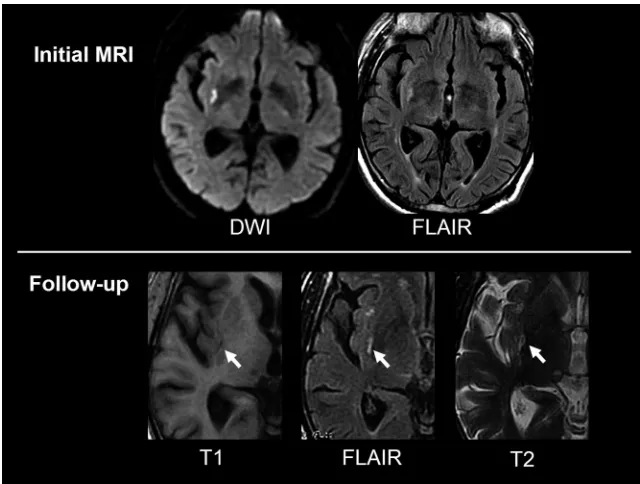
[image:3.585.52.538.57.203.2]Fig 1.A 67-year-old man with a left sensory-motor deficit for 30 minutes. Initial MR imaging (3 days after onset) demonstrates a small DWI and FLAIR hyperintensity in the deep right middle cerebral artery (MCA) territory. On follow-up MR imaging (14 months after onset), focal signal intensity changes on all sequences indicate perma-nent injury in the corresponding area.
Table 1: Characteristics of transient ischemic attack (TIA) patients with and without infarction on follow-up MR imaging (MRI)
Reversible (n⫽7)
Infarction (n⫽26)
All Patients (n⫽33)
P Value
Male, % 5 (71%) 18 (70%) 23 (69%) 1
Age, y (mean⫾SD) 58⫾15 61⫾17 60⫾16 .5
Symptoms
Duration, min (mean⫾SD) 76⫾85 188⫾253 201⫾262 .2
Duration⬍60 min 3 (43%) 10 (38%) 13 (39%) 1
Multiple TIA events 3 (43%) 10 (38%) 13 (39%) 1
Identified cause, % 3 (43%) 12 (46%) 15 (45%) 1
Initial MRI
Delay from onset MRI, h 21⫾10 33⫾36 30⫾33 .9
Solitary lesions 6 (86%) 11 (42%) 17 (51.5%) .08
Follow-up MRI
Delay from onset MRI, mo 11.6⫾3.1 10.4⫾5.5 10.6⫾5 .75
[image:3.585.52.372.222.464.2]reported in the subacute phase in a recent series of 11 pa-tients.15Our findings partially contradict the fact that approx-imately half of the TIA-related DWI abnormalities may be fully reversible. However, the latter findings were based on follow-up images obtained in 9 nonconsecutive TIAs.4Along
similar lines, others have advocated that the low rate (14%) of DWI-positive findings at the subacute stage of TIA suggests that most of these lesions do not persist after 2 weeks.5
The outcome of TIA-related brain lesions can be expected to be linked to several parameters, such as the duration of symptoms and those reflecting the severity of brain ischemia.2
Prolonged symptoms imply a prolonged decrease in brain per-fusion and may thus be associated with a higher risk of subse-quent infarction. Therefore, several previous CT or conven-tional MR studies have suggested an association between the duration of TIA symptoms and the development of a subse-quent infarct, with the probability of infarct increasing with
the duration of symptoms.17,18In line with this is the shorter
duration of symptoms in our patients with fully reversible DWI lesions (mean⫾SD, 76⫾85 minutes) than in those with subsequent infarction (188⫾253 minutes), though the differ-ence did not reach statistical significance. Because the severity of ischemia may be reflected by the ADC, we expected ADC measurements at the acute stage to be predictive of tissue out-come in TIAs. In acute stroke, tissue with a marked ADC de-crease often evolves toward infarction, whereas moderate ADC changes have been shown to be associated with reversible ischemic injury.19,20Like others,4,6,21we found that
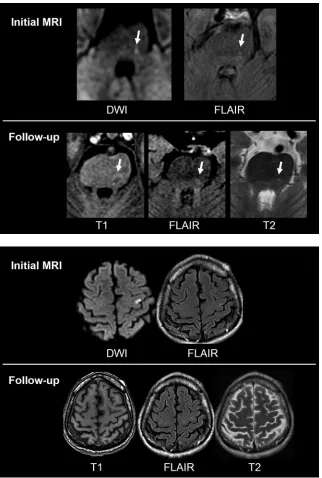
TIA-re-lated ADC decrease is moderate compared with that of stroke patients. Furthermore, our data suggest that ADC values mea-sured in the core of the initial DWI lesion may be predictive of long-term tissue outcome. Indeed, the initial ADC decrease was significantly more severe in lesions that evolved toward infarction than in those that were reversible (rADC⫽79% Fig 2.A 63-year-old man with a right sensory deficit for 10 hours. Initial MR imaging (63 hours after onset) dem-onstrates a focal DWI and FLAIR hyperintensity in the left brain stem (arrow). On follow-up MR imaging (6 months after onset), a small permanent injury can be seen as a dark signal intensity on T1-weighted sequence and a bright signal intensity on FLAIR/T2-weighted sequence in the corresponding area.
[image:4.585.53.375.40.518.2]versus 91%). The rather subtle ADC decrease seen in revers-ible lesions may correspond to a mild ischemia that does not cause advanced bioenergetic failure and subsequent perma-nent tissue injury.2Similar ADC changes have also been re-ported in association with reversal of DWI hyperintensities after extremely rapid reperfusion in acute stroke.22,23 Also
consistent with this are the experimental data showing that adenosine triphosphate depletion with subsequent neuronal death occurs only in association with an ADC reduction of more than 10%.20,22
A larger volume on initial DWI was also predictive of sub-sequent tissue injury. However, care should be taken before concluding that small DWI lesions are fully reversible. It is not known whether there are histopathologic changes corre-sponding to these reversible DWI lesions in patients with tran-sient deficit. We thus cannot exclude the possibility that pa-tients with normal follow-up imaging results may in fact have permanent injury that is too small to be detected by MR im-aging.24At the acute stage, the detection of punctate lesions
benefits from the high lesion-to-background signal intensity ratio on DWI. This is no longer true at the chronic stage, when signal intensity changes on T2-weighted or T1-weighted se-quences are mild or absent, especially when lesions are in the vicinity of the CSF. When mainly atrophic and lacking T2-signal intensity changes, some infarcts may hardly be visible,14
even if comparison with the initial DWI is available for analy-sis.10The high rate of permanent injury that we found was the
result of a complete follow-up MR pro-cedure that included T2-weighted se-quences and 3D T1-weighted sese-quences with a millimeter resolution. Follow-up CT or T2-weighted sequences may thus be insufficient to be able to rule out small infarctions; this methodologic point could partly explain the higher rate of TIA patients with fully reversible DWI lesions previously reported.4
Us-ing high-field MR units to increase spa-tial resolution or measuring the cortical thickness on 3D inversion-recovery pulse sequence may improve the detec-tion of focal atrophy.
Our study is subject to some limitations. First, although this is the largest series of consecutive patients with TIA with long-term MR follow-up, the relatively small size of the study group may explain why we did not find a significant associa-tion between the duraassocia-tion of TIA symptoms and the risk of permanent injury. Second, in some patients with TIA with initial negative DWI, we might have missed rapidly reversible DWI abnormalities. Indeed, cases studies have previously shown the reversibility of TIA-associated DWI lesion in pa-tients imaged soon after onset.13,14By selecting patients based on a positive initial DWI, some of which were obtained 1 day or longer after onset, we might have introduced a selection bias, which could result in a study group of patients who are more likely to have irreversible lesions. However, we did not find a significant difference in the delay from onset-to-initial DWI between our TIA patients with reversible and irreversible lesions. Moreover, the rate of irreversible lesions over the whole population and the rate computed on lesions initially imaged within the first 12 or 24 hours were remarkably simi-lar. This suggests that the timing of initial MR imaging is not a key parameter to predict subsequent tissue outcome. Third, the study design resulted in variations in the timing of fol-low-up imaging with respect to initial symptoms. Given the fact that the signal intensity of ischemic lesion evolves with time, one could argue that MR examinations obtained at dif-ferent points in the time course do not have the same sensitiv-ity for identifying permanent tissue injury. However, there was no significant difference for this parameter between pa-tients with and papa-tients without permanent injury. Last, the ADC values in small DWI lesions are likely to be contaminated by partial volume effects with the adjacent normal paren-chyma. This confound could partially account for the higher ADC values associated with small DWI lesions.
Conclusions
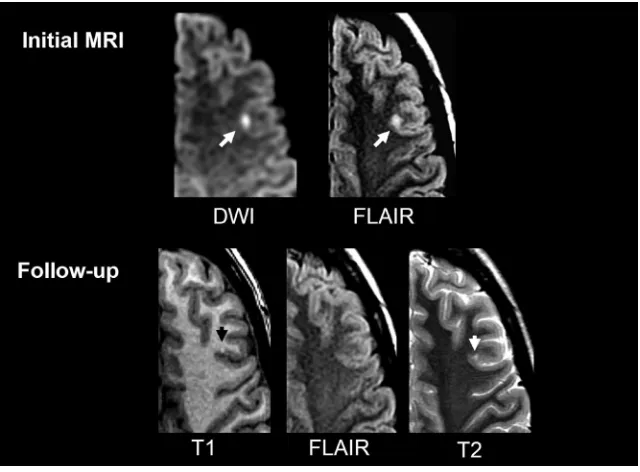
[image:5.585.53.373.42.278.2]The long-term MR follow-up of 33 consecutive DWI-positive TIA patients suggests that initial signal intensity changes most Fig 4.A 21-year-old woman with a right sensory-motor deficit and aphasia for 60 minutes. Initial MR imaging (4 days after onset) shows a punctate cortical DWI/FLAIR hyperintensity in the left superficial middle cerebral artery (MCA) territory. On follow-up MR imaging (15 months after onset), a small permanent injury can be seen as a bright cortical dot on T1-weighted sequence with mild atrophy on T2-weighted sequence. Note that no signal intensity change is seen on FLAIR.
Table 2: Quantitative diffusion-weighted MR imaging (DWI)– derived variables of the 59 transient ischemic attack (TIA) lesions according to imaging outcome
Reversible (n⫽14)
Infarction (n⫽45)
P Value
DWI volume, cm3(mean⫾SD) 0.21⫾0.21 0.91⫾1.7 .003
Absolute ADC, 10⫺6mm2/s
(mean⫾SD)
722⫾118 631⫾135 .022
rADC (mean⫾SD) 91⫾9% 79⫾15% .001
[image:5.585.52.285.325.391.2]often reflect permanent tissue injury. The extent and severity of ischemia, as reflected by initial DWI volume or ADC de-crease, seem to be the underlying physiologic factors that are most relevant for predicting evolution toward infarction. By showing that most DWI-positive TIAs share the same imaging outcome as stroke patients, our data provide additional sup-port for the redefinition of TIA, which considers that all cases of transient deficit with characteristic neuroimaging abnor-malities should be diagnosed as a stroke.3
References
1. Gass A, Ay H, Szabo K, et al.Diffusion-weighted MRI for the “small stuff”: the details of acute cerebral ischaemia.Lancet Neurol2004;3:39 – 45
2. Saver JL, Kidwell C.Neuroimaging in TIAs.Neurology2004;62:S22–25 3. Albers GW, Caplan LR, Easton JD, et al.Transient ischemic attack-proposal for
a new definition.N Engl J Med2002;347:1713–16
4. Kidwell CS, Alger JR, Di Salle F, et al.Diffusion MRI in patients with transient ischemic attacks.Stroke1999;30:1174 – 80
5. Schulz UG, Briley D, Meagher T, et al.Abnormalities on diffusion weighted magnetic resonance imaging performed several weeks after a minor stroke or transient ischaemic attack.J Neurol Neurosurg Psychiatry2003;74:734 –38 6. Winbeck K, Bruckmaier K, Etgen T, et al.Transient ischemic attack and stroke
can be differentiated by analyzing early diffusion-weighted imaging signal intensity changes.Stroke2004;35:1095–99
7. Ay H, Oliveira-Filho J, Buonanno FS, et al.‘Footprints’ of transient ischemic attacks: a diffusion-weighted MRI study.Cerebrovasc Dis2002;14:177– 86 8. Inatomi Y, Kimura K, Yonehara T, et al.DWI abnormalities and clinical
char-acteristics in TIA patients.Neurology2004;62:376 – 80
9. Engelter ST, Provenzale JM, Petrella JR, et al.Diffusion MR imaging and tran-sient ischemic attacks.Stroke1999;30:2762– 63
10. Rovira A, Rovira-Gols A, Pedraza S, et al.Diffusion-weighted MR imaging in the acute phase of transient ischemic attacks.AJNR Am J Neuroradiol2002;23: 77– 83
11. Crisostomo RA, Garcia MM, Tong DC.Detection of diffusion-weighted MRI
abnormalities in patients with transient ischemic attack: correlation with clinical characteristics.Stroke2003;34:932–37
12. Ay H, Koroshetz WJ, Benner T, et al.Transient ischemic attack with infarction: a unique syndrome?Ann Neurol2005;57:679 – 86
13. Lecouvet FE, Duprez TP, Raymackers JM, et al.Resolution of early diffusion-weighted and FLAIR MRI abnormalities in a patient with TIA.Neurology1999; 52:1085– 87
14. Neumann-Haefelin T, Wittsack HJ, Wenserski F, et al.Diffusion- and perfu-sion-weighted MRI in a patient with a prolonged reversible ischaemic neuro-logical deficit.Neuroradiology2000;42:444 – 47
15. Inatomi Y, Kimura K, Yonehara T, et al.Hyperacute diffusion-weighted imag-ing abnormalities in transient ischemic attack patients signify irreversible ischemic infarction.Cerebrovasc Dis2005;19:362– 68
16. Adams H, Bendixen B, Kappelle L, et al.Classification of subtypes of acute ischemic stroke. Definition for use in multicenter clinical trial.Stroke1993;24: 35– 41
17. Bogousslavsky J, Regli F.Cerebral infarct in apparent transient ischemic at-tack.Neurology1985;35:1501– 03
18. Awad I, Modic M, Little JR, et al.Focal parenchymal lesions in transient isch-emic attacks: correlation of computed tomography and magnetic resonance imaging.Stroke1986;17:399 – 403
19. Oppenheim C, Grandin C, Samson Y, et al.Is there an apparent diffusion coefficient threshold in predicting tissue viability in hyperacute stroke?Stroke
2001;32:2486 –91
20. Back T, Hoehn-Berlage M, Kohno K, et al.Diffusion nuclear magnetic reso-nance imaging in experimental stroke: correlation with cerebral metabolites.
Stroke1994;25:494 –500
21. Kamal AK, Segal AZ, Ulug AM.Quantitative diffusion-weighted MR imaging in transient ischemic attacks.AJNR Am J Neuroradiol2002;23:1533–38 22. Rother J, de Crespigny AJ, D’Arceuil H, et al.Recovery of apparent diffusion
coefficient after ischemia-induced spreading depression relates to cerebral perfusion gradient.Stroke1996;27:980 – 86; discussion 986 – 87
23. Fiehler J, Kucinski T, Knudsen K, et al.Are time-dependent differences in diffusion and perfusion within the first 6 hours after stroke onset?Stroke2004; 35:2099 –104