Analytical Models of Calcium Binding in a Calcium Channel
Jinn-Liang LiuDepartment of Applied Mathematics, National Hsinchu University of Education, Hsinchu 300, Taiwan.
Bob Eisenberg
Department of Molecular Biophysics and Physiology, Rush University, Chicago, IL 60612 USA.
(Dated: July 25, 2014)
The anomalous mole fraction effect of L-type calcium channels is analyzed using a Fermi like distribution with the experimental data of Almers and McCleskey [J. Physiol. 353, 585 (1984)] and the atomic resolution model of Lipkind and Fozzard [Biochem. 40, 6786 (2001)] of the selectivity filter of the channel. Much of the analysis is algebraic, independent of differential equations. The Fermi distribution is derived from the configuration entropy of ions and water molecules with different sizes, different valences, and interstitial voids between particles. It allows us to calculate potentials and distances (between the binding ion and the oxygen ions of the glutamate side chains) directly from the experimental data using algebraic formulas. The spatial resolution of these results is comparable with those of molecular models, but of course the accuracy is no better than that implied by the experimental data. The glutamate side chains in our model are flexible enough to accommodate different types of binding ions in different bath conditions. The binding curves of Na+and Ca2+ for [CaCl
landscape is not constant.
1. INTRODUCTION
The ‘all-spheres’ model of voltage-gated calcium (CaV) channels introduced by Nonner
and Eisenberg [1—4] has stimulated many papers on primitive models of selectivity in bio-logical channels (some thirty papers reviewed in [5]; see more recent work cited in [6—16]). Calcium selective channels [17, 18] and electrochemical diodes [19] have actually been built, inspired by the model, as the critical role of the interactions of crowded protein side chains and permeating ions came to be understood [20, 21]. The literature is described towards the end of the paper.
The all-spheres model has been analyzed in the literature with methods that use inter-atomic forces to enforce steric discipline and prevent overlap. Steric forces of this sort can be expensive to compute [6] and introduce certain mathematical difficulties because they are nearly singular.
A different way to prevent two ions from occupying the same space is to compute en-ergies and forces from an adaptation of the Fermi distribution that automatically prevents overlap. Thomas and Fermi used this approach [22] early in the history of quantum mechan-ics (in place of the Pauli exclusion principle) to enforce Fermi-Dirac statistmechan-ics for particles that do not overlap. A formal derivation of a Fermi like distribution of ions with different sizes and valences in general electrolyte solutions has been developed in [15] by deriving the configuration entropy of hard spheres. Important historical antecedents of steric effects are discussed in [23—25]. Advances in numerical methods [25] allow three dimensional calcula-tions of calcium channels using the Poisson-Fermi differential equation with results quite similar to experiments and Monte Carlo simulations [15, 25].
where divalents, concentrated bulk solutions, and mixtures are nearly always present [12]. The Fermi distribution provides a natural description of the saturation of concentration produced by the crowding of ions [5] near ‘working’ electrodes of electrochemical cells, and in and near ion channels, nucleic acids, and active sites of enzymes [28]. Here we emphasize the biological application but we are quite aware that the Fermi like distribution and the Poisson-Fermi equation imply a reasonably general ‘all spheres’ theory of electrolyte solutions and mixtures.
Here we show that important binding properties of the calcium channel can be calculated by algebra alone using the Fermi like distribution that takes into account ions of any size and water molecules and satisfies the saturation condition of ionic concentrations in mean field theory. In a certain sense, the Fermi distribution allows analysis much as classical statisti-cal mechanics allows analysis using the Boltzmann distribution. Neither needs differential equations or boundary conditions to describe many important (e.g., integral) properties of binding systems. Partial differential equations are needed to probe spatial profiles–and we use them here–and will be needed to explore time dependence and dissipation [6, 11, 29—31]. This paper is organized with an introduction to the all-spheres model and a general discussion of the Fermi approach to ions and water in solutions and channels in Section 2. The anomalous mole fraction effect and the Lipkind-Fozzard molecular model are presented in Section 2.1. Section 2.2 contains all algebraic formulas derived from the Fermi distribution and all numerical results of binding phenomena obtained directly from the experimental data and these formulas. The Poisson-Fermi differential equation [15, 25] is given Section 2.3 and then used to look into the channel with more resolution. The energy and concentration profiles are outputs of both algebraic Fermi and Poisson-Fermi differential equations. They are shown in Section 2.3, including the effects of a 106-fold variation of the Ca2+ bath
concentrations. The variable profile of dielectric coefficient is another output of the Poisson-Fermi equation and is an important determinant of selectivity in DEKA sodium channels (Figs. 8-10 in [20])–closely related to L-type CaV channels. A literature survey to deal with
2. MODEL AND RESULTS
2.1. CaV Channel and Mole Fraction Effect
A signature property of CaV channels is the anomalous mole fraction effect. Trace
con-centrations of Ca2+ ions effectively block the flow of abundant monovalent cations [33—38].
A variety of experimental results show that the EEEE locus (four glutamate side chains) is a high-affinity Ca2+ binding structure in the pore of Ca
V channels and is essential to
Ca2+ selectivity and blockage [39—49]. Each glutamate has a terminal carboxylate COO−
group so the pore has a charge of -4e [41], where e is the proton charge. The EEEE struc-ture is quite flexible in simulations [50, 51] and the glutamates are accessible to ions and reagents from the surrounding baths [52—56]. The glutamates mix with permeating ions [7, 13, 20, 21] over a wide range of concentrations in the solutions surrounding the channel and so the selectivity filter is a mixture of Ca2+ and Na+ ions and carboxylates COO−
from the glutamate side chains of the channel protein. Physiological Ca2+
levels vary from 10−8 M in resting cytoplasm, to 10−6 M in activated contractile tissue, to 10−3 M in typical
extracellular solutions, to > 1 M, probably >10 M, in and near ion channels, active sites of enzymes, binding proteins, and nucleic acids. The binding mechanism in the L-type CaV
channel operates over a 108-fold range of experimental Ca2+ concentration [33] and so poses
a serious challenge to all atom simulations as well as theoretical models [57].
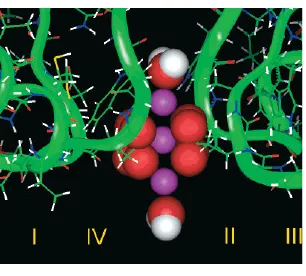
We illustrate the use of the Fermi distribution with an analysis of a particular calcium selective structure proposed by Lipkind and Fozzard [50] and outline how the Fermi distri-bution can be applied to a real channel structure recently published [32]. Fig. 1 illustrates the binding site, the filter, and the EEEE locus, where 3 Ca2+ are shown in violet, 8 O1/2−
in red, 2 H2O in white and red. If a Ca
2+ occupies the binding site, this molecular model
shows that there is no room for other particles in the filter as the 8 oxygen ions are tightly attracted toward the Ca2+ ion. On the other hand, if a Na+ is located at the site, the pore
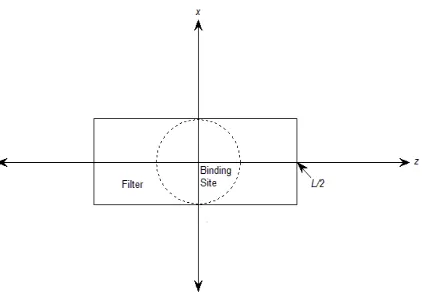
radius of the filter is enlarged by the strong repulsion of the oxygen ions making sufficient room for other particles. Fig. 2 is a cross section of a simplified three-dimensional chan-nel geometry of Fig. 1. The solvent region Ωs consists of two baths and the channel pore
including the filter region.
FIG. 1: The Lipkind-Fozzard pore model, where 3 Ca2+ are shown in violet, 8 O1/2−in red, 2 H 2O in white and red. Reprinted with permission from (G. M. Lipkind and H. A. Fozzard, Biochem.
40, 6786 (2001)). Copyright (2001) American Chemical Society.
FIG. 2: A simplified Ca channel geometry with baths, pore, filter, and binding site. The channel is placed in a cubic box with the length of each side being 40 Å.
are analyzed by the Fermi distribution function using the experimental result of Almers and McCleskey [33] that the Na+ current is halved in an L-type calcium channel at the ‘midpoint
of the binding curve’ (see below), namely when
CNaB+ =C1B = 32 mM, CCaB 2+ =C2B= 0.9µM,
Experimental Data
(1)
where CNaB+ and CCaB 2+ are the (bulk) concentrations of the salts NaCl and CaCl2 in baths,
respectively. A trace concentration of calcium [Ca2+], 36,000
× smaller than the concentra-tion of sodium ion [Na+], is enough to bring the channel to the midpoint of the binding
[image:5.595.206.414.313.450.2]particle species are indexed by 1, 2, 3, and 4 for Na+, Ca2+, Cl−, and H
2O with radii a1 =aNa+ = 0.95,a2 =aCa2+ = 0.99,a3 =aCl− = 1.81, anda4 =aH2O = 1.4Å, respectively.
2.2. Algebraic Fermi Model
There is more than one way to introduce the Fermi distribution and none is as well determined as a full field theory model of an ion channel, using the Poisson-Fermi differential equation [15] or other field theories and models [6, 11, 29, 30]. We use a simple approach to explore what can be done with algebra alone. We are motivated by curiosity and also by the realistic knowledge that thousands of experimental biologists studying channels everyday are far more likely to use an approach that depends on algebra than one that depends on differential equations, let alone variational theory. Our goal is to develop methods that experimental scientists can use to analyze the data they measure everyday without depending on theoretical methods and colleagues they have difficulty evaluating or understanding. Since a great deal of useful chemistry has been done using algebraic properties of statistical distributions, before ordinary or partial differential equations could be actually solved, we have some hope of success.
Our first question is the following. Can we find an analytical–not simulation–method that can directly connect the bath condition eq. (1) to the properties (e.g., concentration or location) of binding ions? We avoid all atom simulations because of the difficulties they have in dealing with the biological range of calcium concentrations. Biological concentrations of Ca2+ are often 10−8-10−6 M and all atom simulations are not yet large enough to deal with
the 55 M water that dissolves each calcium ion in a 10−8-10−6 M Ca2+ solution [57]. The
experimental properties we choose as our starting point (the midpoint of a binding curve (1)) are of the type used by experimental biophysicists and biochemists for generations to characterize binding.
At first glance, it seems unlikely that experimental data concerning macroscopic concen-trations could be used to determine atomic scale properties in the channel. After all, the binding ion is millions of Angstroms away from the location where these bath concentrations are measured. But the combination of the all-spheres model and the Fermi distribution do in fact allow one to determine some atomic properties of the binding site, as we shall see.
a connection, where r is a space variable. By including specifically the excluded volume effect of water molecules and interstitial voids between all particles, we extend the Fermi like distribution of [15] to
Ci(r) = CiBexp
−βiφ(r) +Strc(r)
(2)
that describes the concentration of particles of typeiin an electrolyte solution with arbitrary
K species of ions and the last species (K + 1) of water molecules at any location r in the
solvent domain Ωs. The concentration function is determined by the bulk concentrationCiB
(constant), the electrostatic potentialφ(r), and the ‘steric’ potential
Strc(r) = ln1−
K+1
j=1 vjCj(r)
1−Kj=1+1vjCjB
(3)
that in turn depends on all concentration functionsCj(r). Here, βi =qi/(kBT), qi =zie,zi
is the valence of the particle, kB is the Boltzmann constant, T is the absolute temperature,
and vi = 4πa3i/3 is the volume of the particle with radius ai. Note qK+1 = βK+1 = 0 and
the steric potential is a scalar function that corresponds to a steric force field just as the electric potential φ corresponds to the electric force field. The empty space (void) between particles is expressed by the void fraction function Γ(r) = 1−jK=1+1vjCj(r).
The Fermi distribution function is derived from the configuration entropy of hard-sphere ions and water and can be shown [15] to satisfy the saturation conditionCj(r)≤1/vj for all
different sizes of particles, even at infinitely large potentialφ(r)for all pointsrin the domain.
The steric potential (3) approximates the effects of Lennard-Jones potentials between all pairs of particles in a mean-field sense. The zero steric potential Strc(r) = 0 corresponds to the zero Lennard-Jones potential of all particles at the bulk condition, which yields the constant void fraction ΓB = 1−Kj=1+1vjCjB. The classical Boltzmann distribution appears
if all particles are treated as volumeless points, i.e., vi = 0. Then, an infinite concentration
yet spread into the textbook literature, as far as we know, or into the general knowledge of many biologists [12] or mathematicians [61].
Following classical statistical mechanics [26], we use the Fermi distribution (2) to link the probabilistic quantities of ions in the binding site to concentrations CiB in the baths, i.e.,
P1 =vbC1Bexp(−β1φA+Strc)
P2 =vbC2Bexp(−β2φA+Strc)
, (4)
where P1 and P2 are given, vb is an unknown variable volume (due to the unknown void
volume enclosing the ion) of the binding site, φA is an average potential in the binding site, andA is any point on the surface of the site. P1 means that a Na
+
can be found invb with
the probability of P1 when the ion possesses an energy (−β1φA+Strc)kBT = −E1 under a
given bath condition C1B andC2B, whereE1 is a state energy, for example, the energy well in
[62]. By (3), the steric potential in the binding site
Strc = lnvb−v1P1−v2P2
vbΓB
(5)
establishes a relation between Strc and vb. Note that the energy well E1 consists of not
only the electrostatic energy β1φAkBT but also the steric energy −StrckBT. The steric
energy is related to the vacancy diffusion mechanism [63] that results from the fluctuations of protein side chains caused by thermal agitation and polarization forces from the binding ion. The steric energy was not included in the classical rate theory used to study ion channel selectivity and permeation [62, 63]. The changes in structure and steric energy that occur when ion composition or concentrations are changed in the baths are also not included in classical rate theories, with unfortunate consequences [2, 7].
The properties of binding sites in channels are typically summarized by the conditions necessary to produce half block [63] following the age old practice of enzymologists [65]. For the half-blockage experimental condition C1B = 32 mM and C2B = 0.9 µM, we follow
convention and assume relative occupancies of a filled channel, P1 = 0.5 andP2 = 0.5, and
thereby obtainφA =−10.478 kBT /e, Strc =−1.8, andvb = 4.3 Å3. The valueStrc =−1.8
is dimensionless leading to the water densityC4 =C4Bexp (−1.8) = 5 M with C4B= 55.5M
and the probability P4 = 0.06in the binding site.
FIG. 3: Definition of the cylindrical filter contained in the solvent domain Ωs with length L and
radius of the binding site.
volume both to make our treatment fully consistent and to deal with the possibility that the void volume might vary with conditions. Remember the volume is an output of models like these [3]. These results were obtained by eqs. (4) and (5) with the binding volumevb. From
Fig. 1, the filter region is larger than the binding volume. Fig. 3 is a simplified 2D sketch of a cylindrical filter with radius of the binding site and lengthL= 4.47Å, which contains the binding site. We investigate the half blockage conditions in the whole filter (not just the binding site) by setting φA =−10.478 kBT /e, P1 = 0.5, and P2 = 0.5 in the filter and
changing the binding volumevb to the filter volumevf in (4). In that case, the steric energy
is Strc =−3 and the Na+ and Ca2+ concentrations
C1 =C2 = 59 M in the filter.
The selectivity filter is crowded. It is nearly filled by the large concentration of ions– 59 M–but these do not overfill the space available. In this treatment using a Fermi like distribution, the filter does not suffer from the unbounded error found in treatments using the classical Boltzmann distribution. Both ionic species satisfy the saturation condition (e.g., C2 ≤ C2Max =
1
v2 = 408.6 M) while they embody the strong binding and selectivity that allow the real L-type calcium channel to function selectively in the heart.
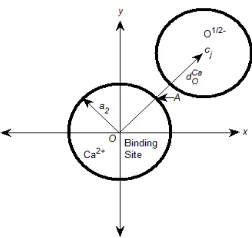
The model and procedure used here allow estimation of the distance between the binding ion and structural oxygens (i.e., half charged oxygen atoms of the glutamate side chains) of the all-spheres model. If a Ca2+ is located at the binding site, the binding distance
[image:9.595.203.414.79.226.2]FIG. 4: A 2D sketch of the binding site with radius a2 and a neighboring O1/2−. The distance between the centers of the binding site and any O1/2− ion is denoted byDCa
O .
between any pair of Ca2+ and O1/2− is estimated by the binding formula
e
4πf0 8
j=1
zO1/2− |cj −A|
+P1zNa+
aNa+
+ P2zCa2+
aCa2+
=φA, (6)
with P1 = 0, P2 = 1, and φA = −10.478, where 0 is the vacuum permittivity, f is a
dielectric constant in the filter that is called the relative permittivity in physical chemistry [64], zO1/2− =−1/2,zCa2+ = 2, and|cj−A|is the distance betweenA and the center of the jth O1/2− as shown in Fig. 4. The distance
|cj−A| depends only on dCaO which is unknown
and unique due to symmetry.
Solving (6) exactly with f = 1 yields dCaO = 2.24 Å. Again, this number is only as
precise as the experimental data cited in (1) and so estimates of distances directly reflect uncertainties in measurement, as well as uncertainties in our theory. We present these results to show that the model and method easily allow the determination of locations. We do not believe that these are the actual locations of ions, because we do not have evidence that the Lipkind-Fozzard model describes a real channel. It is striking to us that the Fermi distribution allows us to map macroscopic binding data directly into spacing of binding sites in the all-spheres model using minimal structural information. When the binding site is occupied by a Na+, i.e.
P1 = 1and P2 = 0, the binding distance should be changed todNaO
and we get dNa
O = 4.527 Å. The location of O
1/2− is very different from that when calcium
occupies the filter. The charge (valence) difference between Ca2+ and Na+ dramatically
changes the binding distance from dN a
diameter of calcium and sodium are nearly the same). This change in distance goes along with and is, in some sense, the cause of (part of) the 36,000-fold selectivity of the filter and the steric effect.
This change in structure reflects the flexibility of four glutamate side chains that allows and reflects a change of pore radius of about 2.3 Å. Our figure of 2.3 Å is surprisingly (and gratifyingly) close to the value of 2 Å found by Barreiro et al. [51] using molecular dynamics simulations. We identify the radius of O1/2− as the covalent radius
aO1/2− = 0.7 Å so that
the distance dCa
O = 2.24Å is slightly larger than aCa2+ +a
O1/2− = 1.69 Å (see Fig. 4). The
effects of changes in structure with concentrations in the bath were considered as soon as the all-spheres model was introduced [3].
We choose the filter dielectric constant f = 1 for this simple molecular model. For a
real protein structure, the chelating ions and molecules forming the binding site are charged and move in response to changes in the (local) electric field. They are polarization charges. Moreover, the number of charged atoms in and around the selectivity filter of the real protein is certainly more than eight. These charges all interact. That is to say, the movement of any one charge is changed by the charges and movement of the other charges. Thus, it is difficult if not impossible to compute the polarization and the (effective) dielectric response in this model, starting with a real structure. Rather, we must choose a value of the effective dielectric constant and view it as a measure of the (effective, more or less) ‘Born solvation energy’ needed to move a permeating or binding ion from the bulk to the binding site. Consequently, the filter dielectric constant in this mean-field model can only be chosen empirically to reflect the Born solvation energy.
The binding experiments [33] used a fixed CNaB + =C1B = 32 mM and various Ca
2+ bath
concentrations CCaB 2+ = C2B that imply different probabilities P1 and P2 of Na+ or Ca2+
occupying the filter. The probabilities P1 andP2 are determined by the following equation
P1 P2
= 1−P2
P2
= exp(φA)C
B 1 C2B
, (7)
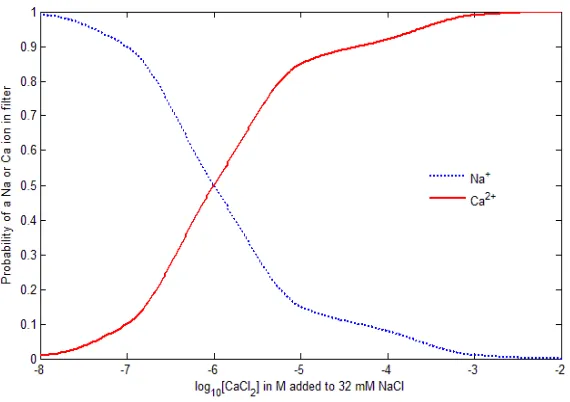
where φA=−10.478 was obtained from the case of equal probability. The probability ratio thus deviates from unity as CCaB2+ is varied along the horizontal axis of the binding curve from its midpoint value CCaB2+ = 0.9 µM as shown in Fig. 5, where the concentration of CaCl2 is changed from 10−8 to 10−2 M while the concentration of NaCl is maintained at 32
FIG. 5: Binding Curves. The Na+ and Ca2+ binding curves are comparable with Monte Carlo
results [21] and show the probability change of a Na+or Ca2+ ion in the filter as the concentration
of CaCl2 from 10−8 M to 10−2 M is added to the fixed [NaCl] = 32 mM in the baths.
filter is nearly zero when [CaCl2] = 10−8 M, the value in the cytoplasm of relaxed muscle
which is not activated for contraction. At [CaCl2] = 10−5 M, the probability of finding a
calcium ion in the filter dramatically increases to 0.85. The probability computed by the Monte Carlo method [21] is 0.84 (estimated from Fig. 6(c) in [21]). The probability of 0.5 for [CaCl2] = 0.9µM also agrees with that of Monte Carlo simulations.
Note that the binding curves are obtained by fixingφAin eqs. (6) and (7) asC2B is varied.
Moreover, the flexibility of glutamate side chains with varying C2B is also deduced from this
fixedφA. From eq. (4), we observe that all P1,P2,vb, andStrc and other physical properties
derived from these variables are changing with varyingC2B. In effect, the changes of protein
locations, binding probabilities, binding volume, binding energies, and others are all lumped into the changing steric energy Strc via eqs. (4) and (5) while the electrostatic potential φA
is fixed in the binding site. Keeping φA fixed is equivalent to assuming that the relation (7) between the probability and bath concentration ratios is linear. More accurate models than this linear model may be needed if it fails to deliver more accurate results for other physical properties or other systems.
C2B since the steric energy is changing. The fixed electrical potential corresponds to the
dissociation constant of a binding Ca2+ ‘bound’ in an energy well in classical rate theory
[62]. In a certain sense, our approach replaces the fixed electrical potential of rate theory with the variable steric potential of a consistent Fermi based theory. As mentioned in [62], the main limitation of the rate theory is that it does not invoke any physical distances, shape of pores, or location of atoms of protein structures, let alone varying bath conditions.
Our Fermi analysis improves the rate theory by showing that (i) Ca2+ energy wells
E2 = (β2φA −Strc)kBT vary with bath concentrations CNaB + and CCaB2+ (via Strc in eqs. (4) and (5)); energy wells are not constant; (ii) the protein structure (eq. (6)) is an ‘evolu-tionary’ consequence of a required potential energyφAto bind a Ca2+ in a site under certain
physiological conditions onCCaB2+ and others; and (iii) the steric energyStrc is used to lump the steric effects of excluded volumes of all ions and water molecules (eq. (3)) and empty spaces between particles created by Lennard-Jones type (the void fraction function Γ(r)) and electrostatic forces (eq. (6)).
2.3. Poisson-Fermi Model
All numerical results obtained so far by algebra alone agree with those of published molecular models [50, 51] or Monte Carlo analysis [21]. The next question is how to extend the potential function from the filter to the bath–from a single ion to numerous particles.
It is impractical (and unwise [57]) to treat all ions explicitly in the bath because they are numerous and their crowding effect is much less intense than that in the filter region. In the bulk solvent region, we compute the potential function φ(r) by solving the Poisson-Fermi equation [15, 25, 66, 67]
s
l2 c∇
2
−1∇2
φ(r) =
K+1
i=1
qiCi(r) =ρ(r) (8)
together with eqs. (2) and (3), where lc is a correlation length [66, 67], s = w0 in the
bath or f0 in the filter, w = 78.5 is the relative permittivity of water, and ρ is the
charge density. The fourth-order Fermi equation reduces to the classical Poisson-Boltzmann equation whenlc=Strc(r) = 0. Iflc= 0 , the dielectric operator=s(1−l2c∇
2
)
by transforming (8) to two second-order equations
sl2c∇ 2
−1Ψ(r) =ρ(r)
∇2φ(r) = Ψ(r) (9)
and introducing a density like variable Ψ that yields a polarization charge density η =
−sΨ− ρ using Maxwell’s first equation [15, 25]. The binding potential φA is used as a
Dirichlet type condition for the potential function φ(r) in the filter domain while φ(r) = 0
on the extracellular and intracellular sides of the boundary and∇φ(r)·n= 0 on the other sides and on the remaining solvent boundary ∂Ωs, where n is an outward unit vector. An
iterative process of solving equations in (9) and evaluating (2) and (3) is repeated until self-consistent φ(r) andCi(r) are reached within a tolerable error bound [25].
The electrostatic potentialφ(r)depends on all species of ions in (8) (via the concentration functions Ci(r)) and the screening effect of water molecules (via the correlation length lc
and the fourth order differential operator∇2 ∇2
). The concentration functionsCi(r)in turn
computes the steric potentialStrc(r)via (3) that includes all sizes and valences of ions and
water. The concentration functions Ci(r) are then re-evaluated via (2) for solving (9) in
the next iteration. ‘Everything’ interacts with everything else in crowded systems like this. Interactions are produced by crowding of the ions themselves, water molecules, and side chains of the protein, as well as by allosteric properties and conformation of the surrounding protein.
We do not need to solve the Poisson equation in the protein region that contains the singular charges of 8 O1/2− since the effect of these charges on potentials has been included
in eq. (6). Analysis is simplified significantly from our previous work [25]. We do not have to deal with the delta functions; we do not have any potential jump conditions on the interface (a molecular surface) between the bulk solvent and molecular regions. The absence of jump conditions facilitates a more accurate approximation of (9) by, for instance, the finite difference method because numerical methods for handling the jump conditions across molecular surfaces with cusps or with a singular Poisson equation are subtle, complex, and thus prone to error [25, 68].
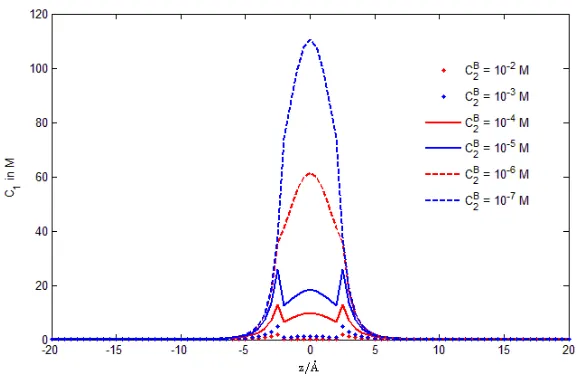
Figs. 6, 7, 8, and 9 are the profiles of Na+concentration
C1(r), Ca2+concentrationC2(r),
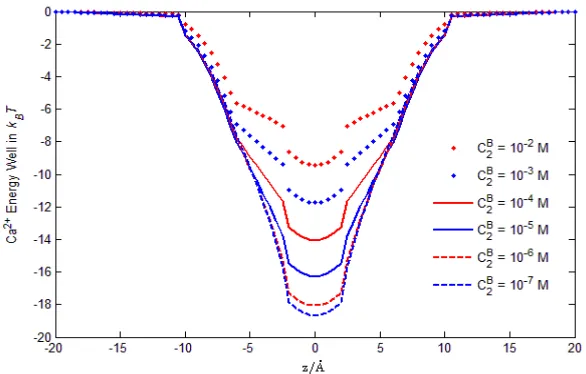
Ca2+ energy well
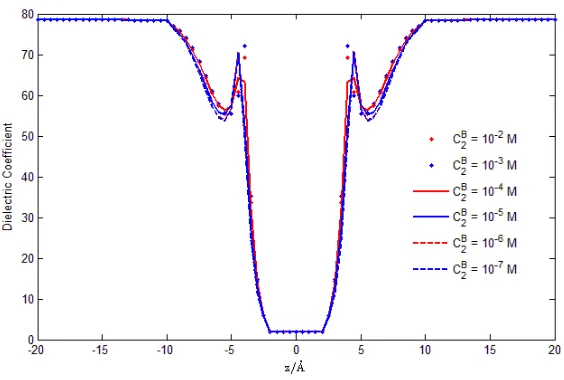
E2(r) = (β2φ(r)−Strc(r))kBT, and dielectric function(r), respectively,
FIG. 6: The averaged concenration C1(r) profiles at each cross section along the pore axis for variousC2B ranging from 10−
7 M to 10−2 M. All the following figures are obtained with the same
averaging method and the same range ofC2B.
ranging from 10−7 to 10−2 M and the fixed
CNaB+ = C1B = 32 mM. Note that the most sensitive range is 10−7 to 10−5 M, where Na+ and Ca2+ probabilities vary steeply as shown
in Fig. 5 so asC1(r)andC2(r)profiles shown in Figs. 6 and 7. From Fig. 8, we observe that
Ca2+ energy wells change rapidly in the range 10−6 to 10−2 M, where the depth of the energy
well is significantly decreased by increasing Ca2+ ions and the conductance of the channel
changes dramatically from allowing Na+ to flow, to blocking Ca2+, and to allowing Ca2+ to
flow as shown in the experiments (Fig. 11 in [33]). The change of Ca2+ energy wells with
varyingC2Bis due mainly to the change of the steric potentialStrckBT, which is equivalent to
the change of the binding distance fromdNa
O to dCaO in eq. (6). In the filter region, the steric
potential StrckBT = −2.4, −3, −4.8, −7, −9.3, and −11.6 kBT for CCaB2+ = 10−
7, 10−6,
10−5, 10−4, 10−3, and 10−2 M, respectively. Although the electrostatic and steric potentials
are intimately connected to each other and to the bath condition via eqs. (4) and (6), our analysis shows that channel selectivity and permeation are in fact critically determined by the steric effect that is not included in the classical rate theory of energy profiles [62, 63].
The theoretical selectivity of Ca2+ ions in the L-type calcium channel is very sensitive
to bath concentrations of Ca2+ in the micro-molar range, just as is seen experimentally in
FIG. 7: The averaged concenrationC2(r) profiles.
FIG. 8: Ionic Energy Wells. The averaged Ca2+ energy wells
E2(r) =β2φ(r)−Strc(r)show the importance of the steric energy functionStrc(r). Our analysis is the first to include a steric energy function, as far as we know.
Poisson-Fermi analysis of the all-spheres model. Trace concentrations of Ca2+ ions produce
a sensitive midpoint block even in the presence of 36,000× more Na+ ions.
The dielectric coefficient(r) is found to vary from w = 78.5 in the baths to f = 2 in
[image:16.595.154.447.345.532.2]FIG. 9: Dielectric Function. The averaged dielectric coefficient(r) profiles represent the com-bined effects of the dielectric response of protein atoms, the screening effect of water molecules, and
the correlation effect of crowded ions. Our analysis is the first to compute the dielectric function as an output, as far as we know. Few if any other analyses include the screening effects of water
molecules, the correlation of crowded ions, and the dielectric properties of the channel protein.
distribution analysis (4) and the Poisson-Fermi differential equation (8) when the correlation length is chosen to belc= 2a2 = 1.98Å [67]. We see that the polarization of water molecules
depends essentially on the divergence of the electric field, i.e., on∇ ·E(r) =−∇ · ∇φ(r) =
−Ψ(r). By inspecting Figs. 8 and 9, we observe that the dielectric coefficient changes
dramatically in the pore region near the filter (see Fig. 2), where the water molecules are strongly polarized by the large electric field.
3. DISCUSSION
3.1. Discussion of Literature
The literature on the all-spheres model is large enough to be confusing so a discussion seems appropriate and hopefully helpful.
co-workers [37, 69, 70]. They concatenated [69]–the density functional theory (DFT) of liquids [71]–and PNP equations–a useful nickname [72] for Poisson-Nernst-Planck [73— 76], emphasizing the analogy with the drift diffusion equations of semiconductors and PNP bipolar transistors–and found that the concatenation describes the ryanodine RyR channel very well [70]. They use an all-spheres model of the RyR and are able to predict detailed experimental results before the measurements were made. (It is important to consult the supplementary material of [69].)
Unfortunately, DFT-PNP does not naturally encompass the classical theory [77—79] of conductance of bulk solutions because the ionic atmosphere in DFT-PNP does not change with gradients of potentials, or flow. The ‘ionic atmosphere’ of a channel is not likely to vary as much as that of a bulk solution, as long as the structure and distribution of permanent charge in the channel is unchanged. Hence, DFT-PNP is more likely to be a good description of a channel than bulk solution.
A number of effects discussed at length in the classical literature of ionic conductance [78] are not included in DFT-PNP: (i) electrophoretic and (ii) relaxation components of conductance; (iii) the spatial variation in dielectric coefficient [15]; (iv) dielectric friction [80, 81]; and (v) dielectrophoresis [82]. In channels, dielectrophoresis is likely to be the most important of these five neglected effects because it depends on the second (spatial) derivative of potential. The complex charge distributions in and near ion channels are likely to produce large second derivatives of potential [83] as shown in Fig. 9. These effects arise automatically (with little need for physical discussion) in a mathematically consistent treatment of flow based on variational principles [6, 11, 29—31] and the Poisson-Fermi theory [15].
Zhang et al. [84] have proposed a simple 1D model of all-spheres in a cylindrical channel. Their primary parameters for investigation were channel length, the concentration of protein charges (called ‘doping’ in their papers), and salt concentrations. They show that the barrier energies decrease when the doping charge increases. We show a related phenomenon here. Barrier energies–the energy wells in Fig. 8–decrease when the Ca2+ bath concentration
increases. Another important feature of their work is the phase transitions seen under some conditions–e.g., for long enough channels–as ions of different valence exchange places in the open channel. The exchange is equivalent to the classical blockage of the Na+ current by
increasing Ca2+ bath concentration discussed extensively in the literature and in our papers.
[63] to describe two state systems that are always filled with something or other. There it is called the ‘Boltzmann equation’ (starting we think with p. 144 of [85] and p. 503 of [86], also see [87]). In particular, channologists universally use the ‘Boltzmann equation’ to describe saturating phenomena in voltage dependence of ionic conductance, whether macroscopic or of single channels. In modern ‘single channel’ language this is called the voltage dependence of the number of open channels [87—89]. We hope readers from biophysics and physiology are not confused by the different usage of the term here. Our systems of (always) open channels are quite different from sometimes open, sometimes closed channels. We use ‘Boltzmann distribution’ as it is used in statistical mechanics [26, 90] to describe phenomena that do not saturate.
3.2. Application to a Known Structure
We make a final remark on how to use the simple algebraic model (4)-(7) for real protein structures. This model has been applied to study the binding mechanism of one Ca2+ and
three Na+ binding sites in the sodium/calcium exchanger (NCX) crystallized by Liao et al.
in [32]. Detailed analysis and results of modeling the NCX transporter will be reported elsewhere. Here we outline our approach starting with the structure of NCX provided in the Protein Data Bank [91] (PDB ID: 3v5u) that contains 4591 atoms and four binding ions, namely, one Ca2+ ion and three Na+ ions (denoted by HETATM in the PDB file) for which
the occupancy numbers ranging from 0.54 to 1 are given in the file.
(O1) The occupancy number is taken as the probability P1 or P2 for each one of the four
binding sites with the specific bath condition CNaB+ and CCaB2+ given in [32] for the PDB file.
(O2) The upper limit of the summation in eq. (6) is N = 4591 and the filter dielectric constant is chosen asf = 30as an initial estimate of the combined dielectric screening
effect of so many protein atoms. This is a fitting parameter that may be adjusted as analysis proceeds to fit data. Of course, only one value should be used for a whole set of experiments. The value should not be adjusted as concentrations, potentials, or compositions change.
the corresponding atomic chargeszj are provided by the PDB2PQR software [92]. At
each binding site, the binding potential φA is calculated by eq. (6) (not by eq. (4) or (7)) by taking the averaged value at six different pointsAon the surface of the binding site with fixed binding distances dNa
O anddCaO as provided by the PDB file. Changes,
i.e., flexibility, in the structure, as bath concentrations change is described by forces, not by locations. That is to say, changes with concentration and so on are the result of the steric energy computed (as an output) by our model, not by explicit changes in the location, at least in this first iteration of our approach.
(O4) We must deal with conditions in which occupancy numbers are not available from the PDB file. We think it is most robust to initially assume that the four different values ofφAfrom eq. (6) at the four binding sites are fixed when the bath conditionsC1B and
C2B in (7) are varied to obtain different probabilities P1 and P2. Of course, in later
iterations of our approach this initial assumption may be improved.
4. CONCLUSION
A molecular-continuum model of the Poisson-Fermi theory is proposed to study the bind-ing mechanism in an L-type calcium channel. Usbind-ing the explicit molecular data of the bindbind-ing ion and the oxygen ions in the glutamate side chains of the channel protein, we present ana-lytical formulas for constructing the potential and concentration functions that connect the experimental data measured in the bath to the very far away binding site. The flexibility of the glutamate side chains and the Na+ and Ca2+ binding curves obtained by the proposed
Fermi-like distribution over a 106-fold range of Ca2+ concentrations have been shown to
improves the classical rate theory in describing the energy landscape of ions in the channel. The flexibility of protein structures is described by the steric energy which is an output of our model. The electrostatic potential of the model seems to be the evolutionary phenotype, responsible for the main physical property of the channel, the binding of calcium ions. Some guidelines of using the algebraic formulas proposed in this paper for modeling real protein structures are also briefly addressed.
Acknowledgments
This work was support in part by National Science Council of Taiwan under Grant No. 102-2115-M-134-005 to J.L.L. and by the Bard Endowed Chair of Rush University Medical Center, held by B.E.
[1] W. Nonner and B. Eisenberg, Biophys. J.75, 1287 (1998).
[2] W. Nonner, L. Catacuzzeno, and B. Eisenberg, Biophys. J.79, 1976 (2000).
[3] W. Nonner, D. Gillespie, D. Henderson, and B. Eisenberg, J. Phys. Chem. B105, 6427 (2001).
[4] B. Eisenberg, Biophys. Chem.100, 507 (2003).
[5] B. Eisenberg, in Advances in Chemical Physics, edited by S. A. Rice (John Wiley & Sons,
2011), p. 77.
[6] B. Eisenberg, Y. Hyon, and C. Liu, J. Chem. Phys. 133, 104104 (2010).
[7] J. Giri, J. E. Fonseca, D. Boda, D. Henderson, and B. Eisenberg, Phys. Biol.8, 026004 (2011).
[8] Y. K. Hyon, B. Eisenberg, and C. Liu, Commun. Math. Sci.9, 459 (2011).
[9] E. Csanyi, D. Boda, D. Gillespie, and T. Kristof, Biochim. Biophys. Acta1818, 592 (2012).
[10] Z. Hato, D. Boda, and T. Kristof, J. Chem. Phys. 137, 054109 (2012).
[11] T.-L. Horng, T.-C. Lin, C. Liu, and B. Eisenberg, J. Phys. Chem. B 116, 11422 (2012). [12] B. Eisenberg, Biophys. J.104, 1849 (2013).
[13] D. Boda, D. Henderson, and D. Gillespie, J. Chem. Phys. 139, 055103 (2013). [14] B. Eisenberg, T.-L. Horng, T.-C. Lin, and C. Liu, Biophys. J.104, 509a (2013).
[17] H. Miedema, M. Vrouenraets, J. Wierenga, D. Gillespie, B. Eisenberg, W. Meijberg, and W.
Nonner, Biophys. J. 91, 4392 (2006).
[18] M. Vrouenraets, J. Wierenga, W. Meijberg, and H. Miedema, Biophys. J. 90, 1202 (2006).
[19] H. Miedema, M. Vrouenraets, J. Wierenga, W. Meijberg, G. Robillard, and B. Eisenberg, Nano Lett. 7, 2886 (2007).
[20] D. Boda, W. Nonner, M. Valiskó, D. Henderson, B. Eisenberg, and D. Gillespie, Biophys. J.
93, 1960 (2007).
[21] A. Malasics, D. Gillespie, W. Nonner, D. Henderson, B. Eisenberg, and D. Boda, Biochim.
Biophys. Acta 1788, 2471 (2009).
[22] E. H. Lieband and B. Simon, Adv. Math.23, 22 (1977).
[23] A. A. Kornyshev, J. Phys. Chem. B111, 5545 (2007).
[24] M. Z. Bazant, M. S. Kilic, B. D. Storey, and A. Ajdari, Adv. Coll. Interf. Sci.152, 48 (2009).
[25] J.-L. Liu, J. Comp. Phys.247, 88 (2013).
[26] D. A. McQuarrie,Statistical Mechanics (Harper and Row, New York, 1976).
[27] G. D. Mahan,Many-Particle Physics (Plenum, New York, 1993).
[28] D. Jimenez-Morales, J. Liang, and B. Eisenberg, Euro. Biophys. J. 41, 449 (2012).
[29] Y. Mori, C.Liu, and R. S. Eisenberg, Phys. D: Nonlin. Phenom. 240, 1835 (2011). [30] G.-W. Wei, Q. Zheng, Z. Chen, and K. Xia, SIAM Rev.54, 699 (2012).
[31] Y. Qiao, B. Tu, and B. Lu, J. Chem. Phys.140, 174102 (2014).
[32] J. Liao, ..., Y. Jiang, Science 335, 686 (2012).
[33] W. Almers and E. W. McCleskey, J. Physiol. 353, 585 (1984).
[34] D. D. Friel and R. W. Tsien, Proc. Natl. Acad. Sci.86, 5207 (1989).
[35] W. Nonner, D. P.Chen, and B. Eisenberg, Biophys. J.74, 2327 (1998).
[36] A. Rodriguez-Contreras, W. Nonner, and E. N. Yamoah, J. Physiol.538, 729 (2002).
[37] D. Gillespie and D. Boda, Biophys. J. 95, 2658 (2008). [38] D. Gillespie, J. Giri, and M. Fill, Biophys. J.97, 2212 (2009).
[39] T. Tanabe, . . . , S. Numa, Nature328, 313 (1987).
[40] S. H. Heinemann, H.Terlau, W. Stuhmer, K. Imoto, and S. Numa, Nature 356, 441 (1992).
[41] J. Yang, P.T. Ellinor,W. A. Sather, J. F. Zhang, and R. W. Tsien, Nature366, 158 (1993). [42] S. Tang, G. Mikala, A. Bahinski, A. Yatani, G. Varadi, and A. Schwartz, J. Biol. Chem.268,
[43] M. S. Kim, T. Morii, L. X. Sun, K. Imoto, and Y. Mori, FEBS Lett.318, 145 (1993).
[44] G. Mikala, A. Bahinski, A.Yatani, S. Tang, and A. Schwartz, FEBS Lett.335, 265 (1993).
[45] W. A. Sather, J. Yang, and R. W. Tsien, Curr. Opin. Neurobiol.4, 313 (1994).
[46] A. Yatani, A. Bahinski, G. Mikala, S.Yamamoto, and A. Schwartz, Circ. Res.75, 315 (1994).
[47] P. T. Ellinor, J. Yang, W. A. Sather, J. F. Zhang, and R. W. Tsien, Neuron15, 1121 (1995).
[48] A. Bahinski, A.Yatani, G. Mikala, S. Tang, S. Yamamoto, and A. Schwartz, Mol. Cell. Biochem. 166, 125 (1997).
[49] S. M. Cibulsky and W. A. Sather, J. Gen. Physiol. 116, 349 (2000).
[50] G. M. Lipkind and H. A. Fozzard, Biochem. 40, 6786 (2001).
[51] G. Barreiro, C. R. Guimaraes, and R. B. de Alencastro, Protein Eng. 15, 109 (2002).
[52] X. H. Chen, I. Bezprozvanny, and R. W. Tsien, J. Gen. Physiol. 108, 363 (1996). [53] U. Klockner, G. Mikala, A. Schwartz, and G. Varadi, J. Biol. Chem.271, 22293 (1996).
[54] X. H. Chen and R. W. Tsien, J. Biol. Chem. 272, 30002 (1997).
[55] X. S. Wu, H. D. Edwards, and W. A.Sather, J. Biol. Chem. 275, 31778 (2000).
[56] X. Wang, T. A.Ponoran, R. L. Rasmusson, D. S. Ragsdale, and B. Z. Peterson, Biophys. J.
89, 1731 (2005).
[57] B. Eisenberg, J. Phys. Chem. C114, 20719 (2010). [58] V. Vlachy, Annu. Rev. Phys. Chem.50, 145 (1999).
[59] R. R. Netz and H. Orland, Eur. Phys. J. E 1, 203 (2000).
[60] P. Grochowski and J. Trylska, Biopolymers 89, 93 (2008).
[61] B. Eisenberg, SIAM News 45 (2012) 11-12.
[62] W. A. Sather and E. W. McCleskey, Annu. Rev. Physiol.65, 133 (2003).
[63] B. Hille, Ionic Channels of Excitable Membranes, (Sinauer Associates Inc., Sunderland, MA 2001).
[64] E. R. Cohen, T. Cvitas, J. Frey, B. Holmstrom, K. Kuchitsu, R. Marquardt, I. Mills, F. Pavese, M. Quack, J. Stohner, H. L. Strauss, M. Takami and A. J. Thor, Quantities, Units
and Symbols in Physical Chemistry (Royal Society of Chemistry Publishing, Cambridge, UK 2007).
[65] R. S. Eisenberg, J. Membr. Biol.115, 1 (1990). [66] C. D. Santangelo, Phys. Rev. E73, 041512 (2006).
[68] W. Geng, S. Yu, and G. Wei, J. Chem. Phys. 127, 114106 (2007).
[69] D. Gillespie, W. Nonner, and R. S. Eisenberg, J. Phys. Condens. Matter 14, 12129 (2002).
[70] D. Gillespie, Biophys. J.94, 1169 (2008).
[71] Y. Rosenfeld, M. Schmidt, H. Loewen, and P. Tarazona, Phys. Rev. E55, 4245 (1997).
[72] R. Eisenberg and D. Chen, Biophys. J.64, A22 (1993).
[73] M. Z. Bazant, K. Thornton, and A. Ajdari, Phys. Rev. E70, 021506 (2004).
[74] B. Eisenberg, Trans. Faraday Soc.160, 279 (2013).
[75] R. S. Eisenberg,in New Developments and Theoretical Studies of Proteins, edited by R. Elber
(World Scientific, Philadelphia, 1996) p. 269.
[76] R. D. Coalson and M. G. Kurnikova, IEEE Trans. Nanobio.4, 81 (2005).
[77] R. M. Fuoss and L. Onsager, J. Phys. Chem. 62, 1339 (1958).
[78] J.-C. Justice, in Comprehensive Treatise of Electrochemistry Volume 5 Thermodynamic and
Transport Properties of Aqueous and Molten Electrolytes, edited by B. E. Conway, J. O. M. Bockris, and E. Yaeger (Plenum, New York, 1983), p. 223.
[79] K. J. Laidler, J. H. Meiser, and B. C. Sanctuary,Physical Chemistry (Brooks Cole, Belmont, CA, 2003).
[80] J. Hubbard and L. Onsager, J. Chem. Phys. 67, 4850 (1977).
[81] R. P. Matthews, G. A. Venter, and K. J. Naidoo, J. Phys. Chem. B 115, 1045 (2011).
[82] H. A. Pohl,Dielectrophoresis: The Behavior of Neutral Matter in Nonuniform Electric Fields
(Cambridge University Press, New York, 1978). [83] R. S. Eisenberg, J. Membr. Biol.150, 1 (1996).
[84] J. Zhang, A. Kamenev, and B. I. Shklovskii, Phys. Rev. Lett. 95, 148101 (2005).
[85] A. L. Hodgkin, A. F. Huxley, and B. Katz, Arch. Sci. Physiol. 3, 129 (1949). [86] A. L. Hodgkin and A. F. Huxley, J. Physiol.117, 500 (1952).
[87] A. F. Huxley, Trends Neurosci.25, 553 (2002). [88] F. J. Sigworth, Q. Rev. Biophys.27, 1 (1994).
[89] E. Neher,in Nobel Lectures, Physiology or Medicine 1991-1995, edited by N. Ringertz (World Scientific, Singapore, 1997), p. 10.
[90] J. Lebowitz, Physics Today46, 32 (1993).
[91] H. M. Berman et. al., Acta Cryst. D58 (2002) 899-907.