Jinn-Liang Liu and Bob Eisenberg
Citation: The Journal of Chemical Physics 141, 075102 (2014); doi: 10.1063/1.4892839
View online: http://dx.doi.org/10.1063/1.4892839
View Table of Contents: http://scitation.aip.org/content/aip/journal/jcp/141/7?ver=pdfcov
Published by the AIP Publishing
Articles you may be interested in
The role of solvation in the binding selectivity of the L-type calcium channel J. Chem. Phys. 139, 055103 (2013); 10.1063/1.4817205
Chaotic model and memory in single calcium-activated potassium channel kinetics Chaos 18, 033136 (2008); 10.1063/1.2944980
Analytical theory of hysteresis in ion channels: Two-state model J. Chem. Phys. 125, 194907 (2006); 10.1063/1.2364898
Applied-field molecular dynamics study of a model calcium channel selectivity filter J. Chem. Phys. 118, 4213 (2003); 10.1063/1.1536957
Effect of binding on particle number fluctuations in a membrane channel J. Chem. Phys. 116, 6216 (2002); 10.1063/1.1458935
Analytical models of calcium binding in a calcium channel
Jinn-Liang Liu1and Bob Eisenberg2
1Department of Applied Mathematics, National Hsinchu University of Education, Hsinchu 300, Taiwan 2Department of Molecular Biophysics and Physiology, Rush University, Chicago, Illinois 60612, USA
(Received 4 June 2014; accepted 30 July 2014; published online 19 August 2014)
The anomalous mole fraction effect of L-type calcium channels is analyzed using a Fermi like dis-tribution with the experimental data of Almers and McCleskey [J. Physiol. 353, 585 (1984)] and the atomic resolution model of Lipkind and Fozzard [Biochemistry40, 6786 (2001)] of the selec-tivity filter of the channel. Much of the analysis is algebraic, independent of differential equations. The Fermi distribution is derived from the configuration entropy of ions and water molecules with different sizes, different valences, and interstitial voids between particles. It allows us to calculate potentials and distances (between the binding ion and the oxygen ions of the glutamate side chains) directly from the experimental data using algebraic formulas. The spatial resolution of these results is comparable with those of molecular models, but of course the accuracy is no better than that implied by the experimental data. The glutamate side chains in our model are flexible enough to accommodate different types of binding ions in different bath conditions. The binding curves of Na+ and Ca2+ for [CaCl
2] ranging from 10−8 to 10−2 M with a fixed 32 mM background [NaCl] are
shown to agree with published Monte Carlo simulations. The Poisson-Fermi differential equation— that includes both steric and correlation effects—is then used to obtain the spatial profiles of energy, concentration, and dielectric coefficient from the solvent region to the filter. The energy profiles of ions are shown to depend sensitively on the steric energy that is not taken into account in the clas-sical rate theory. We improve the rate theory by introducing a steric energy that lumps the effects of excluded volumes of all ions and water molecules and empty spaces between particles created by Lennard-Jones type and electrostatic forces. We show that the energy landscape varies signifi-cantly with bath concentrations. The energy landscape is not constant.© 2014 AIP Publishing LLC. [http://dx.doi.org/10.1063/1.4892839]
I. INTRODUCTION
The “all-spheres” model of voltage-gated calcium (CaV) channels introduced by Nonner and Eisenberg1–4 has stimu-lated many papers on primitive models of selectivity in bi-ological channels (some 30 papers reviewed in Ref. 5; see more recent work cited in Refs. 6–16). Calcium selective channels17,18and electrochemical diodes19have actually been
built, inspired by the model, as the critical role of the inter-actions of crowded protein side chains and permeating ions came to be understood.20,21The literature is described toward
the end of the paper.
The all-spheres model has been analyzed in the litera-ture with methods that use interatomic forces to enforce steric discipline and prevent overlap. Steric forces of this sort can be expensive to compute6and introduce certain mathematical
difficulties because they are nearly singular.
A different way to prevent two ions from occupying the same space is to compute energies and forces from an adapta-tion of the Fermi distribuadapta-tion that automatically prevents over-lap. Thomas and Fermi used this approach22early in the
his-tory of quantum mechanics (in place of the Pauli exclusion principle) to enforce Fermi-Dirac statistics for particles that do not overlap. A formal derivation of a Fermi like distribu-tion of ions with different sizes and valences in general elec-trolyte solutions has been developed in Ref. 15by deriving the configuration entropy of hard spheres. Important historical
antecedents of steric effects are discussed in Refs.23–25. Ad-vances in numerical methods25 allow three-dimensional cal-culations of calcium channels using the Poisson-Fermi differ-ential equation with results quite similar to experiments and Monte Carlo simulations.15,25
A great deal of chemistry has been deduced from the equilibrium properties of statistical distributions without us-ing the field theories found in most of physics. Differential equations are noticeable by their absence in classical text-books of statistical mechanics26compared to those of
multi-particle physics.27 We imagine that using the Fermi
distri-bution instead of the Boltzmann distridistri-bution in analysis of ions and water molecules in solutions and channels is likely to help deal with the nonideal properties of bulk solutions that arise from the finite volume of particles. Nonideal prop-erties are particularly important in biology where divalents, concentrated bulk solutions, and mixtures are nearly always present.12 The Fermi distribution provides a natural descrip-tion of the saturadescrip-tion of concentradescrip-tion produced by the crowd-ing of ions5 near “working” electrodes of electrochemical
cells, and in and near ion channels, nucleic acids, and ac-tive sites of enzymes.28 Here, we emphasize the biological
application but we are quite aware that the Fermi like dis-tribution and the Poisson-Fermi equation imply a reason-ably general “all spheres” theory of electrolyte solutions and mixtures.
We show that important binding properties of the calcium channel can be calculated by algebra alone using the Fermi like distribution that takes into account ions of any size and water molecules and satisfies the saturation condition of ionic concentrations in mean field theory. In a certain sense, the Fermi distribution allows analysis much as classical statistical mechanics allows analysis using the Boltzmann distribution. Neither needs differential equations or boundary conditions to describe many important (e.g., integral) properties of bind-ing systems. Partial differential equations are needed to probe spatial profiles—and we use them here—and will be needed to explore time dependence and dissipation.6,11,29–31
This paper is organized with an introduction to the all-spheres model and a general discussion of the Fermi ap-proach to ions and water in solutions and channels in Sec.II. The anomalous mole fraction effect and the Lipkind-Fozzard molecular model are presented in Sec.II A. SectionII B con-tains all algebraic formulas derived from the Fermi distribu-tion and all numerical results of binding phenomena obtained directly from the experimental data and these formulas. The Poisson-Fermi differential equation15,25is given in Sec.II C
and then used to look into the channel with more resolution. The energy and concentration profiles are outputs of both al-gebraic Fermi and Poisson-Fermi differential equations. They are shown in Sec. II C including the effects of a 106-fold
variation of the Ca2+bath concentrations. The variable
pro-file of dielectric coefficient is another output of the Poisson-Fermi equation and is an important determinant of selectivity in DEKA sodium channels (Figs. 8–10 in Ref.20)—closely related to L-type CaV channels. A literature survey to deal with the various treatments of the all-spheres model is given in Sec. III ADetailed structures of channels are being pub-lished every week. We outline an algebraic Fermi approach in Sec.III Bto the structure of a calcium/sodium exchanger recently published by Liaoet al.32 We think it is more
help-ful to provide an outline to a specific problem than to discuss generalities. Some concluding remarks are given in Sec.IV.
II. MODEL AND RESULTS
A. CaVchannel and mole fraction effect
A signature property of CaVchannels is the anomalous mole fraction effect. Trace concentrations of Ca2+ ions
ef-fectively block the flow of abundant monovalent cations.33–38
A variety of experimental results show that the EEEE locus (four glutamate side chains) is a high-affinity Ca2+ binding
structure in the pore of CaVchannels and is essential to Ca2+
selectivity and blockage.39–49 Each glutamate has a terminal
carboxylate COO−group so the pore has a charge of−4e,41
whereeis the proton charge. The EEEE structure is quite flex-ible in simulations50,51 and the glutamates are accessible to ions and reagents from the surrounding baths.52–56The gluta-mates mix with permeating ions7,13,20,21over a wide range of concentrations in the solutions surrounding the channel and so the selectivity filter is a mixture of Ca2+ and Na+ ions
and carboxylates COO−from the glutamate side chains of the channel protein. Physiological Ca2+levels vary from 10−8M
in resting cytoplasm, to 10−6 M in activated contractile
[image:3.612.317.559.49.248.2]tis-sue, to 10−3 M in typical extracellular solutions, to>1 M,
FIG. 1. The Lipkind-Fozzard pore model, where 3 Ca2+are shown in violet, 8 O1/2− in red, 2 H2O in white and red. Reprinted with permission from G. M. Lipkind and H. A. Fozzard, Biochemistry40, 6786 (2001). Copyright (2001) American Chemical Society.
probably >10 M, in and near ion channels, active sites of enzymes, binding proteins, and nucleic acids. The binding mechanism in the L-type CaV channel operates over a 108
-fold range of experimental Ca2+concentration33and so poses
a serious challenge to all atom simulations as well as theoret-ical models.57
We illustrate the use of the Fermi distribution with an analysis of a particular calcium selective structure proposed by Lipkind and Fozzard50 and outline how the Fermi
dis-tribution can be applied to a real channel structure recently published.32 Fig.1illustrates the binding site, the filter, and
the EEEE locus, where 3 Ca2+ are shown in violet, 8 O1/2− in red, 2 H2O in white and red. If a Ca2+ occupies the bind-ing site, this molecular model shows that there is no room for other particles in the filter as the 8 oxygen ions are tightly at-tracted toward the Ca2+ion. On the other hand, if a Na+is
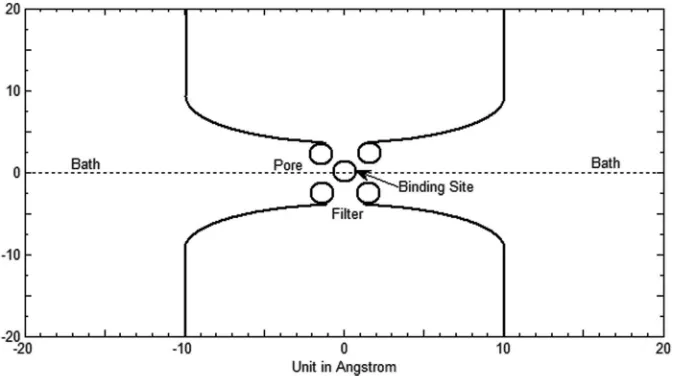
lo-cated at the site, the pore radius of the filter is enlarged by the strong repulsion of the oxygen ions making sufficient room for other particles. The EEEE binding site can be filled by two calcium ions or four sodium ions. The volume of the extra two sodium ions produces a substantial energy penalty that is an important determinant of selectivity in this calcium chan-nel. Fig.2is a cross section of a simplified three-dimensional channel geometry of Fig.1. The solvent regionsconsists of two baths and the channel pore including the filter region.
The flexibility of the EEEE (Glu–Glu–Glu–Glu) struc-ture and the binding mechanism3 are analyzed by the Fermi distribution function using the experimental result of Almers and McCleskey33 that the Na+current is halved in a L-type calcium channel at the “midpoint of the binding curve” (see below), namely, when
CNaB+ =C1B=32 mM,CCaB2+ =C2B=0.9μM
Experimental Data
, (1)
where CB
Na+ and C B
Ca2+ are the (bulk) concentrations of
the salts NaCl and CaCl2 in baths, respectively. A trace
FIG. 2. A simplified Ca channel geometry with baths, pore, filter, and binding site. The channel is placed in a cubic box with the length of each side being 40 Å.
concentration of calcium [Ca2+], 36,000×smaller than the
concentration of sodium ion [Na+], is enough to bring the channel to the midpoint of the binding curve. The channel has a binding selectivity 36,000×higher for Ca2+ than Na+
ions. The particle species are indexed by 1, 2, 3, and 4 for Na+, Ca2+, Cl−, and H
2O with radiia1=aNa+=0.95,a2= aCa2+ =0.99,a3=aCl−=1.81, anda4=aH
2O=1.4 Å, re-spectively.
B. Algebraic Fermi model
There is more than one way to introduce the Fermi dis-tribution and none is as well determined as a full field theory model of an ion channel, using the Poisson-Fermi differential equation15or other field theories and models.6,11,29,30We use a simple approach to explore what can be done with algebra alone. We are motivated by curiosity and also by the realistic knowledge that thousands of experimental biologists study-ing channels everyday are far more likely to use an approach that depends on algebra than one that depends on differential equations, let alone variational theory. Our goal is to develop methods that experimental scientists can use to analyze the data they measure everyday without depending on theoretical methods and colleagues they have difficulty evaluating or un-derstanding. Since a great deal of useful chemistry has been done using algebraic properties of statistical distributions, be-fore ordinary or partial differential equations could be actually solved, we have some hope of success.
Our first question is the following. Can we find an analytical—not simulation—method that can directly connect the bath condition Eq.(1)to the properties (e.g., concentration or location) of binding ions? We avoid all atom simulations because of the difficulties they have in dealing with the bio-logical range of calcium concentrations. Biobio-logical concen-trations of Ca2+are often 10−8-10−6M and all atom
simula-tions are not yet large enough to deal with the 55 M water that dissolves each calcium ion in a 10−8-10−6M Ca2+solution.57
The experimental properties we choose as our starting point (the midpoint of a binding curve (1)) are of the type used by
experimental biophysicists and biochemists for generations to characterize binding.
At first glance, it seems unlikely that experimental data concerning macroscopic concentrations could be used to de-termine atomic scale properties in the channel. After all, the binding ion is millions of Angstroms away from the location where these bath concentrations are measured. But the com-bination of the all-spheres model and the Fermi distribution does in fact allow one to determine some atomic properties of the binding site, as we shall see.
The potential functionφ(r) for ions in or near a channel provides a tool to establish such a connection, where ris a space variable. By including specifically the excluded volume effect of water molecules and interstitial voids between all particles, we extend the Fermi like distribution of Ref.15to
Ci(r)=CiBexp(−βiφ(r)+Strc(r)) (2)
that describes the concentration of particles of type i in an electrolyte solution with arbitraryK species of ions and the last species (K+1) of water molecules at any locationrin the solvent domains. The concentration function is determined by the bulk concentrationCB
i (constant), the electrostatic
po-tentialφ(r), and the “steric” potential
Strc(r)=ln1−
K+1 j=1 vjCj(r)
1−Kj=+11vjCjB
(3)
that in turn depends on all concentration functions Cj(r). Here,βi=qi/(kBT),qi=zie,ziis the valence of the particle,
kB is the Boltzmann constant,Tis the absolute temperature, andvi =4π ai3/3 is the volume of the particle with radiusai. NoteqK+1=βK+1=0 and the steric potential is a scalar func-tion that corresponds to a steric force field just as the electric potentialφcorresponds to the electric force field. The empty space (void) between particles is expressed by the void frac-tion funcfrac-tion(r)=1−Kj=+11vjCj(r).
The Fermi distribution function is derived from the con-figuration entropy of hard-sphere ions and water and can be shown15 to satisfy the saturation conditionC
all different sizes of particles, for all pointsrin the domain, even at infinitely large potential φ(r). The steric potential (3) approximates the effects of Lennard-Jones potentials be-tween all pairs of particles in a mean-field sense. The zero steric potentialStrc(r)=0 corresponds to the zero Lennard-Jones potential of all particles at the bulk condition, which yields the constant void fraction B=1−K+1
j=1 vjCjB.
The classical Boltzmann distribution appears if all particles are treated as volumeless points, i.e., vi =0. Then, an infi-nite concentration occurs in some crowded conditions—e.g., close to charged surfaces—an impossible result. This result represents an unbounded flaw in the classical Boltzmann ap-proach when applied to ionic solutions in crowded condi-tions. It should be emphasized that ionic solutions are often crowded where they are most important, near working elec-trodes, and in and near ionic channels, binding proteins, en-zyme active sites, and nucleic acids. The unbounded flaw is documented in a large literature5,15,23–25,58–60even though the flaw has not yet spread into the textbook literature, as far as we know, or into the general knowledge of many biologists12
or mathematicians.61
Following classical statistical mechanics,26 we use the
Fermi distribution (2) to link the probabilistic quantities of ions in the binding site to concentrationsCB
i in the baths, i.e.,
P1=vbC1Bexp(−β1φA+Strc)
P2=vbC2Bexp(−β2φA+Strc)
, (4)
whereP1andP2are given,vbis an unknown variable volume (due to the unknown void volume enclosing the ion) of the binding site, φA is an average potential in the binding site, andAis any point on the surface of the site.P1means that a Na+can be found in vb with the probability ofP1when the ion possesses an energy (−β1φA+Strc)k
BT = −E1 under a
given bath conditionCB
1 andC2B, whereE1 is a state energy,
for example, the energy well in Ref. 62. By (3), the steric potential in the binding site
Strc=lnvb−v1P1−v2P2
vbB (5)
establishes a relation between Strc andv
b. Note that the
en-ergy well E1 consists of not only the electrostatic energy
β1φAkBTbut also the steric energy−StrckBT. The steric
en-ergy is related to the vacancy diffusion mechanism63that re-sults from the fluctuations of protein side chains caused by thermal agitation and polarization forces from the binding ion. The steric energy was not included in the classical rate theory used to study ion channel selectivity and permeation.62,63The
changes in structure and steric energy that occur when ion composition or concentrations are changed in the baths are also not included in classical rate theories, with unfortunate consequences.2,7
The properties of binding sites in channels are typi-cally summarized by the conditions necessary to produce half block63 following the age old practice of enzymologists.65
For the half-blockage experimental condition C1B=32 mM and C2B=0.9 μM, we follow convention and assume rela-tive occupancies of a filled channel,P1 =0.5 andP2 =0.5, and thereby obtainφA= −10.478kBT/e,Strc= −1.8, andvb
=4.3 Å3. The value Strc= −1.8 is dimensionless leading to the water density C4 =C4Bexp (−1.8)=5 M with C4B
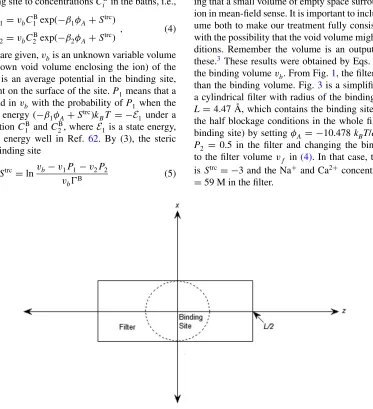
=55.5 M and the probabilityP4=0.06 in the binding site. The void fraction in the binding site is=0.04 indicat-ing that a small volume of empty space surrounds the bindindicat-ing ion in mean-field sense. It is important to include the void vol-ume both to make our treatment fully consistent and to deal with the possibility that the void volume might vary with con-ditions. Remember the volume is an output of models like these.3 These results were obtained by Eqs.(4)and(5)with
the binding volumevb. From Fig.1, the filter region is larger than the binding volume. Fig. 3is a simplified 2D sketch of a cylindrical filter with radius of the binding site and length
L =4.47 Å, which contains the binding site. We investigate the half blockage conditions in the whole filter (not just the binding site) by settingφA = −10.478kBT/e,P1 =0.5, and P2 = 0.5 in the filter and changing the binding volume vb
to the filter volumevf in(4). In that case, the steric energy isStrc= −3 and the Na+ and Ca2+ concentrationsC1=C2
=59 M in the filter.
FIG. 3. Definition of the cylindrical filter contained in the solvent domainswith lengthLand radius of the binding site.
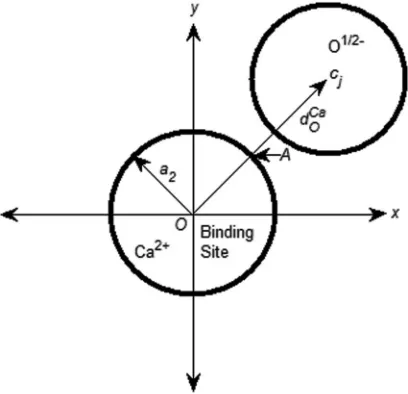
[image:5.612.121.494.328.737.2]FIG. 4. A 2D sketch of the binding site with radiusa2 and a neighboring O1/2−. The distance between the centers of the binding site and any O1/2−
ion is denoted byDCa O .
The selectivity filter is crowded. It is nearly filled by the large concentration of ions—59 M—but these do not overfill the space available. In this treatment using a Fermi like dis-tribution, the filter does not suffer from the unbounded error found in treatments using the classical Boltzmann distribu-tion. Both ionic species satisfy the saturation condition (e.g.,
C2≤C2Max=v1
2 =408
.6 M) while they embody the strong binding and selectivity that allow the real L-type calcium channel to function selectively in the heart.
The model and procedure used here allow estimation of the distance between the binding ion and structural oxygens (i.e., half charged oxygen atoms of the glutamate side chains) of the all-spheres model. If a Ca2+ is located at the binding
site, the binding distance dCa
O between any pair of Ca2+ and
O1/2−is estimated by the binding formula
e
4π f0 8
j=1
zO1/2−
|cj−A| + P1zNa+
aNa+ +
P2zCa2+
aCa2+
=φA, (6)
with P1 = 0, P2 = 1, and φA = −10.478, where 0 is the vacuum permittivity, f is a dielectric constant in the filter that is called the relative permittivity in physical chemistry,64 zO1/2−= −1/2,zCa2+ =2, and|cj−A|is the distance between
Aand the center of the jth O1/2−as shown in Fig.4. The
dis-tance|cj −A| depends only ond
Ca
O which is unknown and
unique due to symmetry.
Solving (6) exactly with f = 1 yields dOCa=2.24 Å. Again, this number is only as precise as the experimental data cited in(1)and so estimates of distances directly reflect uncer-tainties in measurement, as well as unceruncer-tainties in our theory. We present these results to show that the model and method easily allow the determination of locations. We do not believe that these are the actual locations of ions, because we do not have evidence that the Lipkind-Fozzard model describes a real channel. It is striking to us that the Fermi distribution allows us to map macroscopic binding data directly into spacing of binding sites in the all-spheres model using minimal structural
information. When the binding site is occupied by a Na+, i.e.,
P1 =1 and P2 = 0, the binding distance changes name to
dON a and we get dON a =4.527 Å. The location of O 1/2− is
very different from that when calcium occupies the filter. The charge (valence) difference between Ca2+ and Na+ dramat-ically changes the binding distance from dON a =4.527 Å to
dOCa =2.24 Å (remember that the diameter of calcium and sodium are nearly the same). This change in distance goes along with and is, in some sense, the cause of (part of) the 36,000-fold selectivity of the filter and the steric effect.
This change in structure reflects the flexibility of four glu-tamate side chains that allows and reflects a change of pore radius of about 2.3 Å. Our figure of 2.3 Å is surprisingly (and gratifyingly) close to the value of 2 Å found by Bar-reiroet al.51using molecular dynamics simulations. We
iden-tify the radius of O1/2−as the covalent radiusa
O1/2− =0.7 Å
so that the distance dOCa =2.24 Å is slightly larger than
aCa2++aO1/2−=1.69 Å (see Fig.4). The effects of changes
in structure with concentrations in the bath were considered as soon as the all-spheres model was introduced.3
We choose the filter dielectric constant f = 1 for this simple molecular model. For a real protein structure, the chelating ions and molecules forming the binding site are charged and move in response to changes in the (local) elec-tric field. They are polarization charges. Moreover, the num-ber of charged atoms in and around the selectivity filter of the real protein is certainly more than eight. These charges all interact. That is to say, the movement of any one charge is changed by the charges and movement of the other charges. Thus, it is difficult if not impossible to compute the polariza-tion and the (effective) dielectric response in this model, start-ing with a real structure. Rather, we must choose a value of the effective dielectric constant and view it as a measure of the (effective, more or less) “Born solvation energy” needed to move a permeating or binding ion from the bulk to the binding site. Consequently, the filter dielectric constant in this mean-field model can only be chosen empirically to reflect the Born solvation energy.
The binding experiments33used a fixedCB Na+ =C
B 1 =32
mM and various Ca2+ bath concentrations CB
Ca2+=C2B that
imply different probabilitiesP1andP2of Na+or Ca2+ occu-pying the filter. The probabilitiesP1andP2are determined by the following equation:
P1 P2 =
1−P2
P2 =exp(φA) C1B
CB 2
, (7)
where φA = −10.478 was obtained from the case of equal probability. The probability ratio thus deviates from unity as
CB
Ca2+ is varied along the horizontal axis of the binding curve
from its midpoint valueCB
Ca2+=0.9μM as shown in Fig.5,
where the concentration of CaCl2 is changed from 10−8 to 10−2 M while the concentration of NaCl is maintained at 32 mM in the baths. This figure clearly indicates that the probability of finding a Ca2+in the filter is nearly zero when
[CaCl2] = 10−8 M, the value in the cytoplasm of relaxed
muscle which is not activated for contraction. At [CaCl2] =10−5M, the probability of finding a calcium ion in the filter
FIG. 5. Binding curves. The Na+and Ca2+binding curves are comparable with Monte Carlo results21and show the probability change of a Na+or Ca2+ion in the filter as the concentration of CaCl2from 10−8M to 10−2M is added to the fixed [NaCl]=32 mM in the baths.
the Monte Carlo method21 is 0.84 (estimated from Fig. 6(c) in Ref.21). The probability of 0.5 for [CaCl2]=0.9μM also agrees with that of Monte Carlo simulations.
Note that the binding curves are obtained by fixingφAin Eqs.(6)and(7)asC2Bis varied. Moreover, the flexibility of glutamate side chains with varyingC2Bis also deduced from this fixedφA. From Eq.(4), we observe that allP1,P2,vb, and
Strcand other physical properties derived from these variables
change with varyingCB
2. In effect, the changes of protein
lo-cations, binding probabilities, binding volume, binding ener-gies, and others are all lumped into the changing steric energy
Strcvia Eqs.(4)and(5)while the electrostatic potentialφ
Ais fixed in the binding site. KeepingφAfixed is equivalent to as-suming that the relation(7)between the probability and bath concentration ratios is linear. More accurate models than this linear model may be needed if it fails to give accurate results for other physical properties or other systems.
It is important to note that the total energy of each ion also changes with varyingC2Bsince the steric energy changes. The fixed electrical potential corresponds to the dissociation constant of a Ca2+“bound” in an energy well in classical rate
theory.62 In a certain sense, our approach replaces the fixed
electrical potential of rate theory with the variable steric po-tential of a consistent Fermi based theory. As mentioned in Ref.62, the main limitation of the rate theory is that it does not invoke any physical distances, shape of pores, or location of atoms of protein structures, let alone varying bath condi-tions.
Our Fermi analysis improves the rate theory by showing that (i) Ca2+ energy wellsE
2=(β2φA−Strc)kBT vary with
bath concentrationsCNaB+ andCCaB 2+ (viaStrcin Eqs.(4)and
(5)); energy wells are not constant; (ii) the protein structure (Eq.(6)) is an “evolutionary” consequence of a required po-tential energyφAto bind a Ca2+in a site under certain phys-iological conditions on CB
Ca2+ and others; and (iii) the steric
energyStrcis used to lump the steric effects of excluded
vol-umes of all ions and water molecules (Eq. (3)) and empty spaces between particles created by Lennard-Jones type (the void fraction function(r)) and electrostatic forces (Eq.(6)).
C. Poisson-Fermi model
All numerical results obtained so far by algebra alone agree with those of published molecular models50,51or Monte
Carlo analysis.21 The next question is how to extend the
po-tential function from the filter to the bath—from a single ion to numerous particles.
It is impractical (and unwise57) to treat all ions explicitly
in the bath because they are numerous and their crowding ef-fect is much less intense than that in the filter region. In the bulk solvent region, we compute the potential function φ(r) by solving the Poisson-Fermi equation15,25,66,67
slc2∇2−1
∇2φ(r)= K+1
i=1
qiCi(r)=ρ(r) (8)
together with Eqs. (2) and (3), where lc is a correlation length,66,67
s =w0 in the bath or f0 in the filter, w
=78.5 is the relative permittivity of water, and ρ is the charge density. The fourth-order Poisson-Fermi equation re-duces to the classical Poisson-Boltzmann equation when lc
=Strc(r)=0. If lc =0, the dielectric operator=s(1− l2c∇2) approximates the permittivity of the bulk solvent and
the linear response of correlated ions.67 The dielectric
func-tion(r)=s/(1+η/ρ) is a further approximation ofand is found by transforming (8) to two second-order equations
sl2
c∇2−1
(r)=ρ(r)
∇2φ(r)=(r) (9)
and introducing a density like variable that yields a polar-ization charge densityη= −s −ρusing Maxwell’s first equation.15,25 The binding potentialφ
Ais used as a Dirichlet
type condition for the potential functionφ(r) in the filter do-main while φ(r)=0 on the extracellular and intracellular sides of the boundary and ∇φ(r)·n=0 on the other sides and on the remaining solvent boundary ∂s, wheren is an outward unit vector. An iterative process of solving equa-tions in(9)and evaluating(2) and(3)is repeated until self-consistentφ(r) andCi(r) are reached within a tolerable error bound.25
The electrostatic potential φ(r) depends on all species of ions in(8)(via the concentration functionsCi(r)) and the screening effect of water molecules (via the correlation length
lcand the fourth order differential operator∇2∇2). The con-centration functionsCi(r) in turn computes the steric potential
Strc(r) via (3) that includes all sizes and valences of ions and
water. The concentration functionsCi(r) are then re-evaluated via (2) for solving (9) in the next iteration. “Everything” in-teracts with everything else in crowded systems like this. In-teractions are produced by crowding of the ions themselves, water molecules, and side chains of the protein, as well as by allosteric properties and conformation of the surrounding protein.
We do not need to solve the Poisson equation in the pro-tein region that contains the singular charges of 8 O1/2−since
the effect of these charges on potentials has been included in Eq.(6). Analysis is simplified significantly from our previous work.25 We do not have to deal with the delta functions; we
do not have any potential jump conditions on the interface (a molecular surface) between the bulk solvent and molecular re-gions. The absence of jump conditions facilitates a more accu-rate approximation of (9) by, for instance, the finite difference method because numerical methods for handling the jump conditions across molecular surfaces with cusps or with a sin-gular Poisson equation are subtle, complex, and thus prone to error.25,68
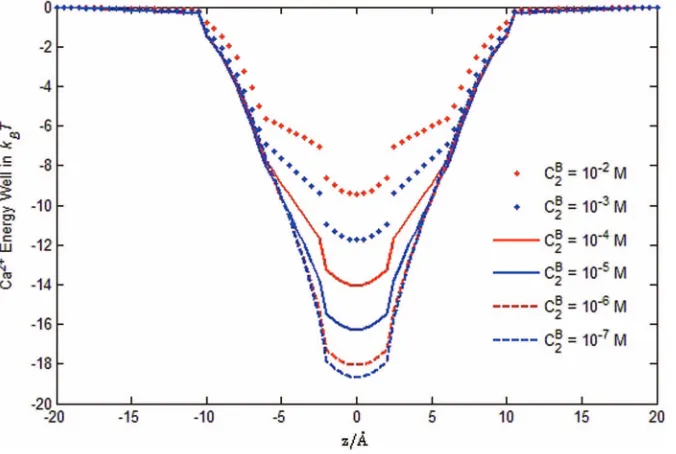
Figs. 6–9 are the profiles of Na+ concentration
C1(r), Ca2+ concentration C
2(r), Ca2+ energy well E2(r)
=(β2φ(r)−Strc(r))k
BT, and dielectric function(r),
respec-tively, obtained by (9) using numerical methods developed in Ref.25for various Ca2+bath conditions ranging from 10−7 to 10−2M and the fixedCNaB+=C1B=32 mM. Note that the
most sensitive range is 10−7-10−5 M, where Na+ and Ca2+
probabilities vary steeply as shown in Fig.5so asC1(r) and
C2(r) profiles shown in Figs.6and7. From Fig.8, we observe that Ca2+energy wells change rapidly in the range 10−6-10−2
M, where the depth of the energy well is significantly de-creased by increasing Ca2+ ions and the conductance of the
channel changes dramatically from allowing Na+ to flow, to blocking Ca2+, and then to allowing Ca2+ to flow as shown
in the experiments (Fig. 11 in Ref.33). The change of Ca2+ energy wells with varyingC2Bis due mainly to the change of the steric potentialStrckBT, which is equivalent to the change of the binding distance from dON a todOCa in Eq.(6). In the filter region, the steric potentialStrckBT = −2.4,−3,−4.8 , −7,−9.3, and−11.6kBTforCB
Ca2+ =10−7, 10−6, 10−5, 10−4,
10−3, and 10−2M, respectively. Although the electrostatic and
steric potentials are intimately connected to each other and to the bath condition via Eqs.(4)and(6), our analysis shows that channel selectivity and permeation are in fact critically deter-mined by the steric effect that is not included in the classical rate theory of energy profiles.62,63
The theoretical selectivity of Ca2+ions in the L-type cal-cium channel is very sensitive to bath concentrations of Ca2+ in the micro-molar range, just as is seen experimentally in Ref.33. The signature phenomenon of L-type calcium chan-nels emerges naturally from the Poisson-Fermi analysis of the all-spheres model. Trace concentrations of Ca2+ions produce
a sensitive midpoint block even in the presence of 36,000× more Na+ions.
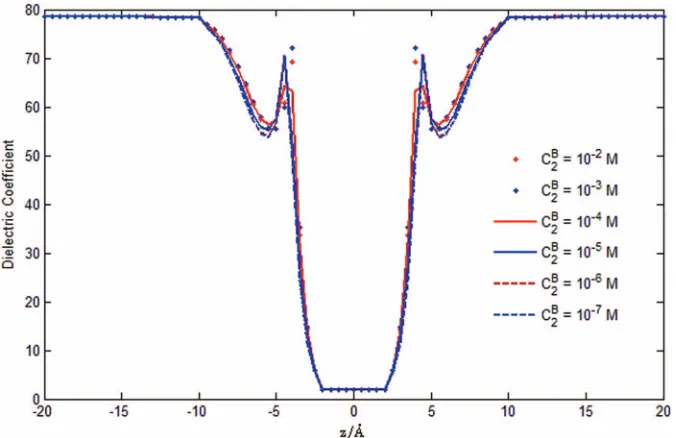
The dielectric coefficient (r) is found to vary from
w=78.5 in the baths tof=2 in the filter as shown in Fig.9. This variation of is a by-product—an output—of the Fermi distribution analysis (4) and the Poisson-Fermi differential
FIG. 6. The averaged concentrationC1(r) profiles at each cross section along the pore axis for variousCB
2 ranging from 10−7M to 10−2M. All the following
FIG. 7. The averaged concentrationC2(r) profiles.
equation (8) when the correlation length is chosen to be lc
= 2a2 = 1.98 Å.67 We see that the polarization of water
molecules depends essentially on the divergence of the elec-tric field, i.e., on ∇ ·E(r)= −∇ · ∇φ(r)= −(r). By in-specting Figs. 8 and9, we observe that the dielectric coef-ficient changes dramatically in the pore region near the filter (see Fig.2), where the water molecules are strongly polarized by the large electric field.
III. DISCUSSION
A. Discussion of literature
The literature on the all-spheres model is large enough to be confusing so a discussion seems appropriate and hopefully helpful.
The all-spheres model has been mostly analyzed at equi-librium by Monte Carlo simulations, with the important ex-ception of work on the RyR receptor by Gillespie and his co-workers.37,69,70 They concatenated69—the density
func-tional theory (DFT) of liquids71—and PNP equations—a
useful nickname72for Poisson-Nernst-Planck,73–76,83
empha-sizing the analogy with the drift diffusion equations of semi-conductors and PNP bipolar transistors—and found that the concatenation describes the ryanodine RyR channel very well.70They use an all-spheres model of the RyR and are able to predict detailed experimental results before the measure-ments were made. (It is important to consult the supplemen-tary material of Ref.70.)
Unfortunately, DFT-PNP does not naturally encompass the classical theory77–79 of conductance of bulk solutions
FIG. 8. Ionic energy wells. The averaged Ca2+energy wellsE
2(r)=β2φ(r)−Strc(r) show the importance of the steric energy functionStrc(r). Our analysis
is the first to include a steric energy function, as far as we know.
[image:9.612.141.479.497.724.2]FIG. 9. Dielectric function. The averaged dielectric coefficient(r) profiles represent the combined effects of the dielectric response of protein atoms, the screening effect of water molecules, and the correlation effect of crowded ions. Our analysis is the first to compute the dielectric function as an output, as far as we know. Few if any other analyses include the screening effects of water molecules, the correlation of crowded ions, and the dielectric properties of the channel protein.
because the ionic atmosphere in DFT-PNP does not change with gradients of potentials, or flow. The “ionic atmosphere” of a channel is not likely to vary as much as that of a bulk so-lution, as long as the structure and distribution of permanent charge in the channel is unchanged. Hence, DFT-PNP is more likely to be a good description of a channel than bulk solution. A number of effects discussed at length in the clas-sical literature of ionic conductance78 are not included
in DFT-PNP: (i) electrophoretic and (ii) relaxation com-ponents of conductance; (iii) the spatial variation in di-electric coefficient;15 (iv) dielectric friction;80,81 and (v)
dielectrophoresis.82In channels, dielectrophoresis is likely to
be the most important of these five neglected effects because it depends on the second (spatial) derivative of potential. The complex charge distributions in and near ion channels are likely to produce large second derivatives of potential83 as
shown in Fig.9. These effects arise automatically (with little need for physical discussion) in a mathematically consistent treatment of flow based on variational principles6,11,29–31and the Poisson-Fermi theory.15
Zhang et al.84 have proposed a simple 1D model of
all-spheres in a cylindrical channel. Their primary param-eters for investigation were channel length, the concentra-tion of protein charges (called “doping” in their papers), and salt concentrations. They show that the barrier energies de-crease when the doping charge inde-creases. We show a re-lated phenomenon here. Barrier energies—the energy wells in Fig.8—decrease when the Ca2+bath concentration increases.
Another important feature of their work is the phase tran-sitions seen under some conditions—e.g., for long enough channels—as ions of different valence exchange places in the open channel. The exchange is equivalent to the classi-cal blockage of the Na+current by increasing Ca2+bath con-centration discussed extensively in the literature and in our papers.
The Fermi distribution is in fact used extensively in the classical physiological literature63 to describe two state
sys-tems that are always filled with something or other. There it is called the “Boltzmann equation” (starting we think with p. 144 of Ref. 85and p. 503 of Ref.86, also see Ref.87). In particular, channologists universally use the “Boltzmann equation” to describe saturating phenomena in voltage depen-dence of ionic conductance, whether macroscopic or of single channels. In modern “single channel” language, this is called the voltage dependence of the number of open channels.87–89
We hope readers from biophysics and physiology are not con-fused by the different usage of the term here. Our systems of (always) open channels are quite different from sometimes open, sometimes closed channels. We use “Boltzmann distri-bution” as it is used in statistical mechanics26,90 to describe
phenomena that do not saturate.
B. Application to a known structure
We make a final remark on how to use the simple alge-braic model (4)-(7) for real protein structures. This model has been applied to study the binding mechanism of one Ca2+
and three Na+binding sites in the sodium/calcium exchanger (NCX) crystallized by Liaoet al.in Ref.32. Detailed analysis and results of modeling the NCX transporter will be reported elsewhere. Here, we outline our approach starting with the structure of NCX provided in the Protein Data Bank91 (PDB ID: 3v5u) that contains 4591 atoms and four binding ions, namely, one Ca2+ion and three Na+ions (denoted by
HET-ATM in the PDB file) for which the occupancy numbers rang-ing from 0.54 to 1 are given in the file.
(1) The occupancy number is taken as the probability P1
or P2 for each one of the four binding sites with the specific bath condition CB
Na+ and C B
Ca2+ given in
(2) The upper limit of the summation in Eq.(6)isN=4591 and the filter dielectric constant is chosen asf=30 as an initial estimate of the combined dielectric screening effect of so many protein atoms. This is a fitting param-eter that may be adjusted as analysis proceeds to fit data. Of course, only one value should be used for a whole set of experiments. The value should not be adjusted as concentrations, potentials, or compositions change. (3) The locationscj,j=1, . . . ,N, of all protein atoms given
in the PDB file are used and the corresponding atomic chargeszjare provided by the PDB2PQR software.92At each binding site, the binding potentialφA is calculated by Eq. (6) (not by Eq. (4) or (7)) by taking the aver-aged value at six different pointsAon the surface of the binding site with fixed binding distancesdON a anddOCa
as provided by the PDB file. Changes, i.e., flexibility, in the structure, as bath concentrations change is described by forces, not by locations. That is to say, changes with concentration and so on are the result of the steric energy computed (as an output) by our model, not by explicit changes in the location, at least in this first iteration of our approach.
(4) We must deal with conditions in which occupancy num-bers are not available from the PDB file. We think it is most robust to initially assume that the four different val-ues ofφAfrom Eq.(6)at the four binding sites are fixed when the bath conditionsCB
1 andC2B in(7) are varied
to obtain different probabilities P1 and P2. Of course, in later iterations of our approach this initial assumption may be improved.
IV. CONCLUSION
A molecular-continuum model of the Poisson-Fermi the-ory is proposed to study the binding mechanism in a L-type calcium channel. Using the explicit molecular data of the binding ion and the oxygen ions in the glutamate side chains of the channel protein, we present analytical formulas for structing the potential and concentration functions that con-nect the experimental data measured in the bath to the very far away binding site. The flexibility of the glutamate side chains and the Na+ and Ca2+ binding curves obtained by the
pro-posed Fermi-like distribution over a 106-fold range of Ca2+
concentrations have been shown to agree with those of molec-ular dynamics or Monte Carlo. The potential, concentration, and dielectric coefficient profiles from the bath to the bind-ing site were then obtained as outputs of the algebraic anal-ysis and the numerical solution of the Poisson-Fermi differ-ential equation that includes correlation and steric effects of all ions and water molecules with different sizes and valences in the channel system. Our analysis seems to be the first that includes voids and water molecules, albeit crudely. This and our earlier work is the first to apply a Fermi distribution to is-sues of permeation and selectivity in calcium channels, as far as we know. Taking into account the effects of the excluded volumes of the atoms of the protein, mobile ions, and water molecules with interstitial voids between particles, the steric energy improves the classical rate theory in describing the en-ergy landscape of ions in the channel. The flexibility of
pro-tein structures is described by the steric energy which is an output of our model. The electrostatic potential of the model seems to be the evolutionary phenotype, responsible for the main physical property of the channel, the binding of calcium ions. Some guidelines of using the algebraic formulas pro-posed in this paper for modeling real protein structures are also briefly addressed.
ACKNOWLEDGMENTS
This work was support in part by National Science Coun-cil of Taiwan (NSCT) under Grant No. 102-2115-M-134-005 to J.L.L. and by the Bard Endowed Chair of Rush University Medical Center, held by B.E.
1W. Nonner and B. Eisenberg,Biophys. J.75, 1287 (1998).
2W. Nonner, L. Catacuzzeno, and B. Eisenberg,Biophys. J.79, 1976 (2000). 3W. Nonner, D. Gillespie, D. Henderson, and B. Eisenberg,J. Phys. Chem.
B105, 6427 (2001).
4B. Eisenberg,Biophys. Chem.100, 507 (2003).
5B. Eisenberg, inAdvances in Chemical Physics, edited by S. A. Rice (John
Wiley and Sons, 2011), p. 77.
6B. Eisenberg, Y. Hyon, and C. Liu,J. Chem. Phys.133, 104104 (2010). 7J. Giri, J. E. Fonseca, D. Boda, D. Henderson, and B. Eisenberg,Phys. Biol.
8, 026004 (2011).
8Y. K. Hyon, B. Eisenberg, and C. Liu,Commun. Math. Sci.9, 459 (2011). 9E. Csanyi, D. Boda, D. Gillespie, and T. Kristof,Biochim. Biophys. Acta
1818, 592 (2012).
10Z. Hato, D. Boda, and T. Kristof,J. Chem. Phys.137, 054109 (2012). 11T.-L. Horng, T.-C. Lin, C. Liu, and B. Eisenberg,J. Phys. Chem. B116,
11422 (2012).
12B. Eisenberg,Biophys. J.104, 1849 (2013).
13D. Boda, D. Henderson, and D. Gillespie,J. Chem. Phys.139, 055103
(2013).
14B. Eisenberg, T.-L. Horng, T.-C. Lin, and C. Liu,Biophys. J.104, 509a
(2013).
15J.-L. Liu and B. Eisenberg,J. Phys. Chem. B117, 12051 (2013). 16T. C. Lin and B. Eisenberg,Commun. Math. Sci.12, 149 (2014). 17H. Miedema, M. Vrouenraets, J. Wierenga, D. Gillespie, B. Eisenberg, W.
Meijberg, and W. Nonner,Biophys. J.91, 4392 (2006).
18M. Vrouenraets, J. Wierenga, W. Meijberg, and H. Miedema,Biophys. J.
90, 1202 (2006).
19H. Miedema, M. Vrouenraets, J. Wierenga, W. Meijberg, G. Robillard, and
B. Eisenberg,Nano Lett.7, 2886 (2007).
20D. Boda, W. Nonner, M. Valiskó, D. Henderson, B. Eisenberg, and D.
Gille-spie,Biophys. J.93, 1960 (2007).
21A. Malasics, D. Gillespie, W. Nonner, D. Henderson, B. Eisenberg, and D.
Boda,Biochim. Biophys. Acta1788, 2471 (2009).
22E. H. Lieband and B. Simon,Adv. Math.23, 22 (1977). 23A. A. Kornyshev,J. Phys. Chem. B111, 5545 (2007).
24M. Z. Bazant, M. S. Kilic, B. D. Storey, and A. Ajdari,Adv. Colloid
Inter-face Sci.152, 48 (2009).
25J.-L. Liu,J. Comput. Phys.247, 88 (2013).
26D. A. McQuarrie, Statistical Mechanics(Harper and Row, New York,
1976).
27G. D. Mahan,Many-Particle Physics(Plenum, New York, 1993). 28D. Jimenez-Morales, J. Liang, and B. Eisenberg,Eur. Biophys. J.41, 449
(2012).
29Y. Mori, C. Liu, and R. S. Eisenberg,Physica D240, 1835 (2011). 30G.-W. Wei, Q. Zheng, Z. Chen, and K. Xia,SIAM Rev.54, 699 (2012). 31Y. Qiao, B. Tu, and B. Lu,J. Chem. Phys.140, 174102 (2014).
32J. Liao, H. Li, W. Zeng, D. B. Sauer, R. Belmares, and Y. Jiang,Science
335, 686 (2012).
33W. Almers and E. W. McCleskey, J. Physiol.353, 585 (1984).
34D. D. Friel and R. W. Tsien,Proc. Natl. Acad. Sci. U.S.A.86, 5207 (1989). 35W. Nonner, D. P. Chen, and B. Eisenberg,Biophys. J.74, 2327 (1998). 36A. Rodriguez-Contreras, W. Nonner, and E. N. Yamoah,J. Physiol.538,
729 (2002).
37D. Gillespie and D. Boda,Biophys. J.95, 2658 (2008). 38D. Gillespie, J. Giri, and M. Fill,Biophys. J.97, 2212 (2009).
39T. Tanabe, H. Takeshima, A. Mikami, V. Flockerzi, H. Takahashi, K.
Kan-gawa, M. Kojima, H. Matsuo, T. Hirose, and S. Numa,Nature (London)
328, 313 (1987).
40S. H. Heinemann, H. Terlau, W. Stuhmer, K. Imoto, and S. Numa,Nature
(London)356, 441 (1992).
41J. Yang, P. T. Ellinor, W. A. Sather, J. F. Zhang, and R. W. Tsien,Nature
(London)366, 158 (1993).
42S. Tang, G. Mikala, A. Bahinski, A. Yatani, G. Varadi, and A. Schwartz, J.
Biol. Chem.268, 13026 (1993).
43M. S. Kim, T. Morii, L. X. Sun, K. Imoto, and Y. Mori,FEBS Lett.318,
145 (1993).
44G. Mikala, A. Bahinski, A. Yatani, S. Tang, and A. Schwartz,FEBS Lett.
335, 265 (1993).
45W. A. Sather, J. Yang, and R. W. Tsien,Curr. Opin. Neurobiol.4, 313
(1994).
46A. Yatani, A. Bahinski, G. Mikala, S. Yamamoto, and A. Schwartz,Circ.
Res.75, 315 (1994).
47P. T. Ellinor, J. Yang, W. A. Sather, J. F. Zhang, and R. W. Tsien,Neuron
15, 1121 (1995).
48A. Bahinski, A. Yatani, G. Mikala, S. Tang, S. Yamamoto, and A. Schwartz,
Mol. Cell. Biochem.166, 125 (1997).
49S. M. Cibulsky and W. A. Sather,J. Gen. Physiol.116, 349 (2000). 50G. M. Lipkind and H. A. Fozzard,Biochemistry40, 6786 (2001). 51G. Barreiro, C. R. Guimaraes, and R. B. de Alencastro,Protein Eng.15,
109 (2002).
52X. H. Chen, I. Bezprozvanny, and R. W. Tsien,J. Gen. Physiol.108, 363
(1996).
53U. Klockner, G. Mikala, A. Schwartz, and G. Varadi,J. Biol. Chem.271,
22293 (1996).
54X. H. Chen and R. W. Tsien,J. Biol. Chem.272, 30002 (1997).
55X. S. Wu, H. D. Edwards, and W. A. Sather,J. Biol. Chem.275, 31778
(2000).
56X. Wang, T. A. Ponoran, R. L. Rasmusson, D. S. Ragsdale, and B. Z.
Peterson,Biophys. J.89, 1731 (2005).
57B. Eisenberg,J. Phys. Chem. C114, 20719 (2010). 58V. Vlachy,Annu. Rev. Phys. Chem.50, 145 (1999). 59R. R. Netz and H. Orland,Eur. Phys. J. E1, 203 (2000). 60P. Grochowski and J. Trylska,Biopolymers89, 93 (2008). 61B. Eisenberg,SIAM News45, 11–12 (2012).
62W. A. Sather and E. W. McCleskey,Annu. Rev. Physiol.65, 133 (2003). 63B. Hille,Ionic Channels of Excitable Membranes(Sinauer Associates, Inc.,
Sunderland, MA, 2001).
64E. R. Cohen, T. Cvitas, J. Frey, B. Holmstrom, K. Kuchitsu, R. Marquardt,
I. Mills, F. Pavese, M. Quack, J. Stohner, H. L. Strauss, M. Takami, and
A. J. Thor,Quantities, Units and Symbols in Physical Chemistry(Royal Society of Chemistry Publishing, Cambridge, UK, 2007).
65R. S. Eisenberg,J. Membr. Biol.115, 1 (1990). 66C. D. Santangelo,Phys. Rev. E73, 041512 (2006).
67M. Z. Bazant, B. D. Storey, and A. A. Kornyshev,Phys. Rev. Lett.106,
046102 (2011).
68W. Geng, S. Yu, and G. Wei,J. Chem. Phys.127, 114106 (2007). 69D. Gillespie, W. Nonner, and R. S. Eisenberg,J. Phys. Condens. Matter14,
12129 (2002).
70D. Gillespie,Biophys. J.94, 1169 (2008).
71Y. Rosenfeld, M. Schmidt, H. Loewen, and P. Tarazona,Phys. Rev. E55,
4245 (1997).
72R. Eisenberg and D. Chen, Biophys. J.64, A22 (1993).
73M. Z. Bazant, K. Thornton, and A. Ajdari,Phys. Rev. E70, 021506 (2004). 74B. Eisenberg,Trans. Faraday Soc.160, 279 (2013).
75R. S. Eisenberg inNew Developments and Theoretical Studies of Proteins,
edited by R. Elber (World Scientific, Philadelphia, 1996), p. 269.
76R. D. Coalson and M. G. Kurnikova, IEEE Trans. Nanobiol. 4, 81
(2005).
77R. M. Fuoss and L. Onsager,J. Phys. Chem.62, 1339 (1958).
78J.-C. Justice, inComprehensive Treatise of Electrochemistry. Volume 5: Thermodynamic and Transport Properties of Aqueous and Molten Elec-trolytes, edited by B. E. Conway, J. O. M. Bockris, and E. Yaeger (Plenum, New York, 1983), p. 223.
79K. J. Laidler, J. H. Meiser, and B. C. Sanctuary, Physical Chemistry
(Brooks Cole, Belmont, CA, 2003).
80J. Hubbard and L. Onsager,J. Chem. Phys.67, 4850 (1977).
81R. P. Matthews, G. A. Venter, and K. J. Naidoo,J. Phys. Chem. B115, 1045
(2011).
82H. A. Pohl,Dielectrophoresis: The Behavior of Neutral Matter in Nonuni-form Electric Fields(Cambridge University Press, New York, 1978).
83R. S. Eisenberg,J. Membr. Biol.150, 1 (1996).
84J. Zhang, A. Kamenev, and B. I. Shklovskii,Phys. Rev. Lett.95, 148101
(2005).
85A. L. Hodgkin, A. F. Huxley, and B. Katz, Arch. Sci. Physiol.3, 129 (1949). 86A. L. Hodgkin and A. F. Huxley, J. Physiol.117, 500 (1952).
87A. F. Huxley,Trends Neurosci.25, 553 (2002). 88F. J. Sigworth,Q. Rev. Biophys.27, 1 (1994).
89E. Neher inNobel Lectures, Physiology or Medicine 1991-1995, edited by
N. Ringertz (World Scientific, Singapore, 1997), p. 10.
90J. Lebowitz,Phys. Today46(9), 32 (1993).
91H. M. Bermanet al.,Acta Crystallogr. D58, 899–907 (2002).
92T. J. Dolinsky, P. Czodrowski, H. Li, J. E. Nielsen, J. H. Jensen, G. Klebe,

![FIG. 5. Binding curves. The Na+ and Ca2+ binding curves are comparable with Monte Carlo results21 and show the probability change of a Na+ or Ca2+ ionin the filter as the concentration of CaCl2 from 10−8 M to 10−2 M is added to the fixed [NaCl] = 32 mM in the baths.](https://thumb-us.123doks.com/thumbv2/123dok_us/8110972.236334/7.612.139.478.51.270/binding-binding-comparable-carlo-results-probability-lter-concentration.webp)