Statistics on Race and the
Criminal Justice System - 2004
A Home Office publication under section 95 of the Criminal Justice Act 1991
Criminal Justice Act 1991
Section 95
(1) The Secretary of State shall in each year publish such information, as he
considers expedient for the purpose of:
(a) enabling persons engaged in the administration of justice to become aware
of the financial implications of their decisions; or
(b) facilitating the performance of such persons of their duty to avoid
discriminating against any persons on the ground of race or sex or any other
improper ground.
(2) Publication under subsection (1) above shall be effected in such a manner, as
the Secretary of State considers appropriate for the purpose of bringing the
information to the attention of the persons concerned.
© Crown copyright 2005
ISBN 1-84473-508-7
ISSN 1473-1967
This publication is available on the RDS website:
Contents
Page
Contents
iii
List of tables
iv
Summary of main points
vii
Chapter 1
Introduction
1
Chapter 2
Developments in ethnic monitoring
3
Chapter
3
Victims
and
homicide
7
Chapter 4
Police and Criminal Evidence Act ‘stop and searches’
23
Chapter
5
Arrests
and
cautions
36
Chapter 6
Prosecutions and sentencing
53
Chapter
7
Youth
offending
65
Chapter
8
Probation
84
Chapter
9
Prisons 87
Chapter 10
Police and other complaints
94
Chapter 11
Deaths in custody
98
Chapter 12
Practitioners in the Criminal Justice System
101
Appendices
108
Useful references
112
Contact points
116
List of tables
Page
Table A
Proportion of Black and Minority Ethnic groups at different
stages of the criminal justice process, England and Wales,
2003/4
ix
Table 3.1
Racist incidents for all police force areas 1996/7 to 2003/4
10
Table 3.2
Racially or religiously aggravated offences recorded by police
forces by offence type, 2002/3 and 2003/4, with clear-up rates
for England and Wales
11
Table 3.3
Number of persons cautioned and prosecuted at magistrates’
courts and the Crown Court for racially aggravated offences,
by age group and result, 2002
12
Table 3.4
Number of persons cautioned and prosecuted at magistrates’
courts and the Crown Court for racially aggravated offences,
by age group and result, 2003
16
Table 3.5
Homicides currently recorded by ethnic appearance of victim,
combined data for 2001/2, 2002/3 and 2003/4
21
Table 3.6
Ethnic appearance of currently recorded homicide victims by
ethnicity of principal suspect, combined data for 2001/2,
2002/3 and 2003/4
22
Table
3.7
Relationship of currently recorded homicide victims to
principal suspect, by ethnic appearance of victim, combined
data for 2001/2, 2002/3 and 2003/4
22
Table 3.8
Apparent method of killing of currently recorded homicide
victims, by ethnic appearance of victim, combined data for
2001/2, 2002/3 and 2003/4
22
Table 4.1
‘Stop and searches’ of persons under s1 of the Police and
Criminal Evidence Act 1984, and other legislation, by ethnic
appearance, 2003/4
26
Table 4.2
‘Stop and searches’ of persons under s1 of the Police and
Criminal Evidence Act 1984, and other legislation, per 1000
population, by police force area and ethnic appearance,
2002/3 and 2003/4
27
Table 4.3
Percentage of ‘stop and searches’ under s1 of the Police and
Criminal Evidence Act 1984, and other legislation by reason
for search and ethnic appearance, for selected police force
area, 2002/3 and 2003/4
28
Table 4.4
Percentage of ‘stop and searches’ under s1 of the Police and
Criminal Evidence Act 1984 and other legislation resulting in
an arrest, by police force area and ethnicity, 2002/3 and
2003/4
31
Table 4.5
‘Stop and searches’ of persons under s60 of the Crime Justice
and Public Order Act 1994, by police force and ethnic
appearance, 2003/4
32
Table 4.6
Total ‘stop and searches’ under s44 (1&2) of the Terrorism
Act 2000 by police force area and ethnicity, 2002/3 and
2003/4
33
Table 4.7
‘Stop and searches’ of vehicle occupants under s44(1) of the
Terrorism Act 2000 and resultant arrests by ethnicity, selected
areas, 2003/4
34
Table
4.8
‘Stop and searches’ of pedestrians under s44(2) of the
Terrorism Act 2000 and resultant arrests by ethnicity, selected
areas, 2003/4
Table 5.1
Total arrests for notifiable offences, by police force and ethnic
appearance, 2003/4
38
Table 5.2
Total arrests for notifiable offences per 1,000 population aged
10 and over, by police force and ethnicity, 2002/3 and 2003/4
39
Table 5.3
Arrests resulting from a ‘stop and search’ under s1 of the
Police and Criminal Evidence Act 1984, as a percentage of
total arrests for notifiable offences, by police force area and
ethnic appearance, 2003/4
40
Table 5.4
Percentage breakdown by ethnic appearance for age groups
of those arrested for notifiable offences, selected areas and
England and Wales, 2003/4
41
Table
5.5
Percentage breakdown by ethnic appearance of those
arrested for notifiable offences by offence group, selected
areas and England and Wales, 2003/4
43
Table 5.6
Number of persons cautioned for notifiable offences, by police
force area and ethnic appearance, 2003
46
Table 5.7
Percentage of arrest which resulted in a caution for notifiable
offences, by police force area and ethnic appearance, 2003/4
47
Table 5.8
Percentage breakdown by ethnic appearance for age groups
of persons cautioned for notifiable offences, selected areas
and England and Wales, 2003
48
Table
5.9
Percentage breakdown by ethnic appearance of persons
cautioned for notifiable offences, by offence group, selected
areas and England and Wales, 2003
50
Table 6.1
Prosecutions for indictable offences at magistrates' courts by
outcome and ethnic appearance of defendant, selected areas,
2003
55
Table
6.2
Persons sentenced for indictable offences at magistrates'
courts by outcome and ethnic appearance of defendant,
selected areas, 2003
57
Table 6.3
Persons sentenced at magistrates' courts by type of sentence
and ethnic group, for selected offence groups and areas, 2003
59
Table 6.4
Persons tried for indictable offences at the Crown Court by
outcome and ethnic appearance, selected areas and England
and Wales, 2003
61
Table 6.5
Persons sentenced for indictable offences at the Crown Court
by outcome and ethnic appearance, selected areas, 2003
62
Table 6.6
Persons sentenced for indictable offences at the Crown Court
by outcome, offence type and ethnic appearance, England
and Wales, 2003
63
Table 7.1
Percentage of offences dealt with by Youth Offending Teams
by offence group and self-defined ethnicity, selected areas
and England and Wales, 2003
67
Table 7.2
Pre-court decisions for offences where defendants aged 10-17
by decision and self-defined ethnicity, selected areas and
England and Wales, 2003
71
Table 7.3
Remand decisions and episodes offences where defendants
aged 10-17 by self-defined ethnicity, selected areas and
England and Wales, 2003
74
Table 7.4
Sentencing for offences committed by 10-17 year olds by
self-defined ethnicity, selected areas and England and Wales,
2003
78
Table 8.1
Percentage of persons starting court order supervision by the
Probation Service, by ethnic group and area, January to
March 2004
Table
8.2
Percentage of persons starting pre- or post-release
supervision by the Probation Service, by ethnic group and
area, January to March 2004
86
Table
9.1
Proportion of prison population by ethnic appearance for
males of all nationalities, 1995-2003
88
Table
9.2
Proportion of prison population by ethnic appearance for
males of British nationality, 1995-2003
88
Table
9.3
Proportion of prison population by ethnic appearance for
females of all nationalities, 1995-2003
89
Table
9.4
Proportion of prison population by ethnic appearance for
females of British nationality, 1995-2003
89
Table 9.5
Prison population by ethnic group, type of prisoner, age group,
offence group and the sentence length, 28 February 2003
91
Table 9.6
Sentenced prisoners by court sentencing area, received into
prison establishments, by ethnicity, July 2003 - June 2004
92
Table 9.7
Sentenced prison receptions by offence type and ethnicity,
July 2003 - June 2004
93
Table 10.1
Police complaints received, by police force area and ethnic
appearance of complainant, 2003/4
95
Table 10.2
Outcome of completed complaints of racially discriminatory
behaviour, by police force area, 2003/4
96
Table 11.1
Deaths with or following contact with the police by
self-identified ethnicity, gender, age and cause of death, England
and Wales, 2003/4
99
Table
11.2
Self-inflicted deaths in prison by self-identified ethnicity,
gender, age and cause of death, England and Wales, 2003/4
99
Table 11.3
Deaths in prison resulting from natural and other causes by
self-identified ethnicity, gender, age and cause of death,
England and Wales, 2003/4
100
Table 12.1
Police Service by ethnicity, England and Wales, 2003/4
102
Table 12.2
Prison Service by ethnicity, England and Wales, 2003/4
103
Table 12.3
Probation Service by ethnicity, England and Wales, 2003/4
104
Table 12.4
Crown Prosecution Service by ethnicity, England and Wales,
2003/4
104
Table 12.5
Employment in the Criminal Justice System, England and
Wales, 2003/4
105
Appendix A1 Estimated population aged 10 and over by ethnic origin and
police force area, mid-2003
109
Appendix A2
Estimated population aged 10 and over, percentage by ethnic
origin and police force area, mid-2001
110
Summary of main points
In 2003/4:
During 2003/4, racist incidents
recorded by the police rose by 7% to
52,694, following a 10% fall the
previous year. There were 35,022
racially or religiously aggravated
offences recorded by the police in
2003/4 (31,034 in 2002/3). Over half
of these were offences of
harassment. One third of racially or
religiously aggravated offences were
cleared up. Of the 5,629 defendants
who were prosecuted for racially
aggravated offences in 2003, 2,440
were convicted at magistrates’
courts and 457 at the Crown Court.
The number of persons cautioned by
the police for such offences was
681.
The police recorded 2,605
homicides in the three-year period
ending 2003/4. Ten per cent of
these were of Black people, 6%
Asian and 4% ‘Other’ minority ethnic
groups. (These figures included the
172 originally recorded as homicide
victims in the Shipman case.) Black
victims (31%) were more likely to be
shot compared with Asian (12%) and
White (6%). During this period, 22
homicides were recorded as being
racially motivated.
Around 738,000 ‘stop and searches’
were recorded by the police under a
range of legislation (including the
Police and Criminal Evidence Act).
Of these, 15% were of Black people,
7% of Asian people and 1% of
‘Other’ ethnic origin. The overall total
was a reduction of 15% on the
previous year. Police forces varied
widely in their rates for recorded
‘stop and searches’. Research
published by the Home Office has
indicated that resident population
figures are not indicative of the
population present in public places
when and where police carry out
searches; therefore, they do not
provide a good basis for assessing
ethnic biases in ‘stop and search’
practices. Despite this, these
statistics remain important in
providing an overall picture of ‘stop
and search’ incidents. Relative to
the general (i.e. resident) population,
in 2003/4 Black people were 6.4
times more likely to be stopped and
searched than White people, slightly
higher than the proportion in the
previous year. Asian people were
twice as likely to be stopped and
searched than White people were;
again, a slightly higher rate than in
the previous year.
In 2003/4 in England & Wales as a
whole, there was a fall in the number
of ‘stop and searches’ of about 18%
for White people, 9% for Black
people and 8% for Asian people
compared to the previous year. In
the Metropolitan Police Service
(MPS), the number of ‘stop and
searches’ fell by 14% for White
people, 9% for Black people and
15% for Asian people. In the MPS
the reasons for ‘stop and searches’
were very similar in both years. In
England and Wales the main reason
across all ethnic groups was for
drugs. The proportion of people
undergoing ‘stops and searches’ for
stolen property declined in most
ethnic groups. In practice, there
were wide variations in the levels of
‘stop and searches’ between police
forces
.
people rose by 1.7% and those of
people in the ‘Other’ category by
10.7%. Relative to the general
population, Black people were over
3 times more likely to be arrested
than White people were, similar to
the previous year. There were
variations across forces in the
proportions of individuals from
different ethnic groups being
arrested for specific types of offence.
The police cautioned nearly 220,000
persons for notifiable offences in
2003/4. Of these, 7% were recorded
as Black people, 5% Asian and 1%
of ‘Other’ ethnic origin. Following
arrest, 17% of White, 16% of Asian
people, and 12% of Black people
were cautioned. An offender’s
eligibility for a caution depends upon
a number of factors (e.g. admission
of guilt).
Combining information collected
from 8 police force areas on
magistrates’ court decisions in 2003
shows that, excluding those
defendants committed to the Crown
Court for trial, 55% of White
defendants, 45% of Black and 44%
of Asian defendants were convicted.
Combining data from five police
force areas, a greater proportion of
White defendants (78%) were found
guilty in the Crown Court in 2003
than Black (73%) or Asian (72%)
defendants.
Practice varied throughout England
and Wales for those dealt with by
the Youth Justice Board. Of all
remand decisions, 57% of White and
55% of Asian youths were given
unconditional bail, compared with
47% for those of mixed origin and
46% of Black youths. Also, 8% of
Black and those of Mixed origin were
remanded in custody, compared to
5% of both Asian and White youths.
For those 37 police force areas
where information was available,
combined data for the period
January to March 2004, shows that
Asian and Black offenders each
accounted for about 3% of those
under court orders and supervised
by the National Probation Service.
In February 2003, Black and
Minority Ethnic groups accounted for
about 24% of the male prison
population (16% Black, 3% Asian
and 5% ‘Other’) and about 31% of
the female prison population (25%
Black, 1% Asian and 5% ‘Other’).
These figures included foreign
nationals who made up just under
12% of the male and 21% of the
female prison population. There was
variation in the types of offences
between each ethnic group.
Eight per cent of complaints made
against the police in 2003/4 were
from Black people, 5% from Asian
people and 2% from ‘Other’ minority
ethnic groups.
In most criminal justice agencies
there have been increases in the
employment of Black and Minority
Ethnic groups over recent years.
However, Black and Minority Ethnic
groups are still under-represented in
all police officer, prison officer and
prison governor grades, as well as in
various posts in criminal justice
agencies.
people experience a greater
likelihood of being stopped and
searched in comparison to later
stages in the process. Black
defendants are more prominent in
the Crown Court caseload, partly
because they tend to elect for jury
trial more often than other ethnic
groups including White. (However, it
should be noted that these particular
results are based on data for only
65% of those tried.) Their
significantly higher presence within
the prison population may be
caused, in part, by the longer
average sentences imposed on
them.
Table A: Proportion (%) of ethnic groups at different stages of the
criminal justice process, England and Wales, 2003/4
Ethnicity
White Black Asian Other Unknown/
not recorded
Total
General population (aged 10 & over) @ 2001 Census
91.3 2.8 4.7 1.2 0.0 100
Stops and searches(1) 74.3 14.7 7.3 1.5 2.3 100
Arrests(2) 84.3 8.8 4.8 1.4 0.7 100
Cautions(2) 84.2 6.7 4.7 1.2 3.2 100
Youth offences 83.5 6.3 3.1 2.9 4.3 100
Crown Court (3) 76.8 12.2 7.4 3.6 * 100
Prison receptions(4) (5) 80.5 9.7 4.8 2.9 2.1 100
Prison population(5) 77.1 15.5 3.1 4.1 0.1 100
Note: Figures may not add to 100% due to rounding.
(1) Stops and searches recorded by the police under section 1 of the Police and Criminal Evidence Act 1984 and other legislation.
(2) Notifiable offences.
(3) Information on ethnicity is missing in 35% of cases; therefore, percentages are based on known ethnicity. (4) ‘Other’ includes those prisoners who classified their ethnicity as ‘Mixed’.
Chapter 1
Introduction
Section 95 of the Criminal Justice Act
1991 requires the Secretary of State to
publish such information as he
considers expedient in order to enable
those involved in the Criminal Justice
System (CJS) to become aware of the
financial implications of their decisions,
or to avoid discrimination on grounds of
race, sex or any other improper
grounds. The Home Office has
published a series of documents since
1992 on the issue of race within the
Criminal Justice System under these
requirements. This report continues the
series. These documents brought
together both points relating to the
Government’s policy on race as well as
statistical information on the
representation of Black and Minority
Ethnic groups as suspects, offenders
and victims within the criminal justice
system and on employees within the
criminal justice agencies.
The basic statistical information in this
document should be considered in
conjunction with research reports that
are now available on related issues.
Some information is presented where
relevant.
Information in this publication is
presented in several ways:
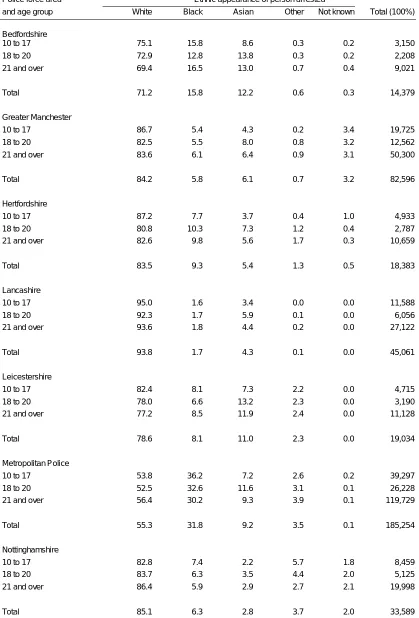
a) Tables covering all police force areas
or equivalents for courts and prisons
b)
Detailed tables for the ten police
force areas with the highest
percentage of Black and Minority
Ethnic population (Bedfordshire,
Greater Manchester, Hertfordshire,
Lancashire, Leicestershire,
Metropolitan, Nottinghamshire,
Thames Valley, West Midlands and
West Yorkshire).
Around four-fifths
(81%) of the Black and Minority
Ethnic population of England &
Wales live in these police force
areas.
c) Where data collection is still being
developed, the tables cover those
areas able to supply information (e.g.
courts).
d) Some summary tables for England &
Wales as a whole (e.g. courts and
personnel).
Wherever possible, information is
presented on the way in which the data
are generated and collected. Where
there are concerns about data provision
and/or quality, these issues are briefly
described.
This document has a companion
document,
Race and the Criminal
Justice System: an overview to the
complete statistics 2003-4,
which
presents an overview of the information
presented here, as well as how it relates
to other social indicators. Both the
overview report and the current
document are available on the following
website:
www.homeoffice.gov.uk/rds/section951.
html
The population figures used in this
report were derived from the 2001
Census which showed that nationally
2.8% of the general population were
Black, 4.7% Asian and 1.2% of ‘Other’
minority ethnic group. The Census also
provided statistics on the ethnic
populations for each police force area.
These population estimates replaced
those used in earlier reports, which
were based upon the 1991 Census and
the annual Labour Force Survey.
Absolute populations for each ethnic
group were calculated using these
proportions and the annual mid-year
estimates for each police force area
produced by the Office for National
Statistics.
except those for ‘stop and search’ and
homicide which include all ages.
Data are presented in terms of both
calendar and financial years and
others, e.g. prison receptions. This
reflects the reporting cycles of the
agencies contributing information for
this publication.
The following conventions have been
used throughout this publication.
0
= nil or less than 0.5%
..
= not available
Chapter 2
Developments in ethnic monitoring
Introduction
This Chapter outlines developments in
ethnic monitoring within the Criminal
Justice System. Some further detail is
contained in subsequent chapters.
For 30 years, those concerned with
improving race relations have stressed
the need to collect accurate information
about the ethnicity of people in contact
with the criminal justice system as well
as the need to supplement such data by
more detailed research. Although the
principle of ethnic monitoring is now
accepted by all parts of the criminal
justice system in England & Wales,
recent progress has been slow. This has
been mainly due to the constraints
caused by the lack of national IT
systems in some agencies.
Furthermore, some agencies have been
slow in disseminating information
regarding changes in requirements for
ethnic monitoring to the relevant people
in their organisations.
Prisons
The first comprehensive criminal justice
monitoring system introduced was for
the Prison population. This resulted from
a major review of what were the
information needs of the Prison Service.
After some initial problems the first data
was published in 1986 which analysed
in detail these findings. Although it
indicated that the proportion of Black
and Minority Ethnic population in prison
was lower than commentators
suggested, it still showed a level of
representation well above the general
population levels. The data collected
was determined by a combination of
self-assessment by the prisoner and
observation by a prison officer. The
categories used were similar to those in
official surveys such as the EC Labour
Force Survey.
From 1992 to February 2003 the 9-point
1991 Census classification system was
used to collect information on the
ethnicity of prisoners. Information based
on this ethnic breakdown of the prison
population has been published annually
since 1993. More recently the nationality
of the prisoner has also been collected.
Since March 2003 all prisoners received
into a penal establishment for the first
time, and existing prisoners transferred
to another establishment, have been
asked to self-classify their ethnicity
using the 2001 Census 16 + 1
categories (the 16 ethnic categories
plus the ‘Not stated’ category). The
Prison Service plans to record the
ethnicity of all prisoners using this
classification system.
Probation
The Probation Service was the second
criminal justice agency to introduce
systematic monitoring in October 1992.
Probation committee members,
probation service staff and persons
subject to the supervision of the service
were all included. Offenders were
required to tick a box (Black, White,
‘Other’ (please specify) or Refused) and
answer the question, “Where would you
say your ethnic group comes from?’’
selecting from the list of countries
provided. The results were mapped to
the 1991 Census groupings or the
4-point Home Office system. However,
after an initial good start, the proportion
of ethnic data missing rose substantially
from the mid-1990s. Figures were
consequently omitted from the 1999 and
subsequent statistical publications on
race and the criminal justice system.
The transition to the use of the 2001
Census categories led to more technical
problems, with many probation areas
unable to supply ethnic data because of
changes required to IT systems. These
problems have been resolved, but the
proportion of ethnic data missing in a
number of areas is still too high for
national figures to be included in
national statistical publications.
Probation Circular 60/2004, issued on
30 December 2004, asks all Probation
Boards to examine their ethnicity
monitoring data and have an action plan
in place to improve their performance in
this respect. Information has been
published for those areas with
sufficiently complete data.
National Offenders Management
Service (NOMS)
On 1 June 2004, the Prison and
Probation Services and most of the work
carried out by the central units in
correctional services were brought
together under the new National
Offenders Management Service
(NOMS).
Police
Section 95 of the Criminal Justice Act
1991 led to new measures to establish
consistent ethnic monitoring within the
police service.
Following discussions with the
Association of Chief Police Officers
(ACPO) and Her Majesty’s Inspector of
Constabulary (HMIC) the Home Office
wrote to all Chief Constables in England
& Wales in March 1995 confirming April
1996 as the start date for mandatory
ethnic monitoring in all police force
areas. In fact, thirty-nine forces were
able fully or partially to begin the data
collection during 1995-96. The areas of
police activity monitored initially were:
‘stop and searches’, arrests, cautions
and homicides. The classification was
based upon the police officer’s visual
perception of the ethnic appearance of
the suspect/victim, using four categories
(White, Black, Asian and ‘Other’). This
was compatible with the fuller
classification used in the 1991 Census
and elsewhere. Asian in this context
covers those of Indian, Pakistani or
Bangladeshi origin. The Home Office’s
consultations revealed it would not be
practical at that time to use a wider
classification system or for the police
officers to ask suspects or victims to
classify themselves. It was also agreed
that police forces should undertake
ethnic monitoring of all deaths in police
custody from 1 April 1996 (Cotton and
Povey, 1997).
Crown Prosecution Service (CPS)
The CPS has agreed to introduce
ethnicity monitoring of all their casework
decisions. This is dependent upon
successful implementation of new IT
systems, which began in 2004. Since
CPS staff do not normally have direct
contact with defendants, they would rely
on ethnicity data collected by the police.
Courts
It is not practical for court staff to collect
ethnic data whilst a case is in progress.
If a case is discontinued or withdrawn,
court staff may not have visual contact
with the suspect. An alternative
approach was adopted based upon the
transfer of data on the ethnic
classification of suspects from the police
to the magistrates’ court and in turn for
this information to be passed by
magistrates’ court staff to the Crown
Court.
For magistrates’ courts, data on all court
appearances is sent to the Home Office
either through direct data transfer from
the court's computer or through returns
completed by police forces. Because of
the variety of IT systems used in courts
the Home Office initially only received
data with an ethnic marker from courts
using the ICL system (and Equis in
Northamptonshire). Data were first
published for 1999 for 4 police force
areas; 8 areas are included for 2003.
Ethnicity was recorded in 19% of the
magistrate’s court data for England and
Wales supplied to the Home Office for
2003. Further expansion will depend
upon the introduction of the LIBRA
system; a single magistrates’ court IT
system which will include the ability to
record both the visual and
self-assessment ethnicity of the defendant.
At the Crown Court the presence of a
national IT system (CREST) has made
monitoring easier. All Crown Courts
were asked to include information on
ethnic origin on all new cases received
from October 2001 based upon
information supplied by the police
included in case papers. The CREST
system has been amended to accept
both 4 and 16-point classifications.
Currently data is received on the
ethnicity of 65% of all persons tried at
the Crown Court in 2003, and
information from 5 Crown Courts is
sufficiently complete to allow publication
for the first time.
Youth Justice Board
This agency uses the 16-point census
categories to monitor the ethnicity of
defendants/offenders dealt with. These
have been amalgamated into 5
categories for presentation in this report.
Racist incidents/crimes
Information on racist incidents is
collected annually by HMIC from all
police forces on the basis of a common
definition. This is now accepted to be:
“A racist incident is any incident which is
perceived to be racist by the victim or
any other person”
(as recommended by
The Stephen Lawrence Inquiry in 1999).
However, this provides no information
on the victim's ethnicity. A new RDS
return, which is currently voluntary,
provides data on the ethnicity of victims
of racist crimes, as well as the type of
offence committed. Because of the
necessary IT changes, currently only
data from a limited number of forces is
being collected (see Chapter 3).
On 30 September 1998, the Crime and
Disorder Act 1998 introduced new
racially aggravated offences covering
assault/wounding, criminal damage and
harassment. These offences are
monitored as part of the standard
criminal statistics returns.
also monitored racially aggravated
offences and since December 2001 has
included religiously aggravated
offences.
Since 1988 the British Crime Survey
(BCS) has included a question on the
ethnicity of respondents. Ethnic boosts
have been used to increase the
accuracy of findings for Black and
Minority Ethnic groups. The BCS is the
main measure of racist crimes. The
16-point classification was first used for the
2001/2 sweep of the Survey.
Human resources
Monitoring of staff resources has
gradually been introduced by all criminal
justice agencies. The data presented in
this report are a mixture of both visual
and self-assessment, but increasingly
the latter. There are some issues
regarding the correct interpretation of
the 16-point classification and its
implementation, particularly as regards
IT systems. Some agencies still have a
considerable way to go in terms of
reducing the amount of information
recorded as unknown.
Census 2001 classification
The Stephen Lawrence Inquiry, the
Race Relations (Amendment) Act 2000
and the 2001 Census have all been a
stimulus for wider and improved
monitoring of Black and Minority Ethnic
groups. Ministers agreed that this
should be based throughout the criminal
justice system upon self-assessment
and the 16-point census categories. The
date for implementation was set as 1
April 2003. The aim of this was to
provide a single common system for
collecting ethnic data in all agencies,
consistent with the demographic
information available from the Census.
Chapter 3
Victims and homicide
Introduction
This chapter looks at victims of crime
including racist incidents
and homicide.
Victimisation
The most recent results from the British
Crime Survey (BCS) for 2003/4 show
that over the last 12 months Asian
people (31%) face significantly higher
risks of crime than other ethnic groups
and those of mixed race (39%) the
highest risks. White and Black people
had a similar level of risk (26%). People
from ‘Chinese or other’ ethnic (21%)
backgrounds had the lowest level of risk.
The levels of risk for White people and
people from ‘Chinese or other’ ethnic
backgrounds fell significantly between
2002/3 and 2003/4.
Findings from the 2002/3 BCS showed
that people from Black and Minority
Ethnic groups had a significantly higher
risk of personal crime compared to
White people. Those of Mixed ethnic
background had overall a higher risk of
victimisation than all other groups
(Salisbury and Upson, 2004).
The 2002/3 BCS also showed that after
allowing for age the difference between
Asian and White people disappeared.
However, people of mixed race
continued to have higher risks of
victimisation than all the other ethnic
groups after controlling for age and the
type of area they lived in. The higher risk
of the Mixed group, therefore, is not
explained by these factors (Salisbury
and Upson, 2004).
Racist incidents and crimes
All police forces have collected
information on racist incidents since
1986 on the basis of a common
definition that covered:
‘Any incident in which it appears to the
reporting or investigating officer that the
complaint involves an element of racial
motivation; or any incident which
includes an allegation of racial
motivation made by any person (ACPO
1985)’
This definition compares with that
proposed in the report of the Stephen
Lawrence Inquiry which was adopted by
the police in 1999:
‘A racist incident is any incident which is
perceived to be racist by the victim or
any other person' (MacPherson 1999).
It should be noted that incidents
included here are wider than the normal
definition of a crime in the published
crime statistics and include general
threatening behaviour.
Sections 28 to 32 of the Crime and
Disorder Act 1998 introduced into law
the concept of specific racially
aggravated offences. The provisions
came into effect on 30 September 1998.
They were further extended to include
religiously aggravated offences by
section 39 of the Anti-terrorism, Crime
and Security Act 2001, with effect from
14 December 2001.
An offence may be defined as racially or
religiously aggravated if
victim's membership (or presumed
membership) of a racial or religious
group; or
(b) the offence is motivated (wholly or
partly) by hostility towards members
of a racial or religious group based
on their membership of that group.
"Membership", in relation to a racial
or religious group, includes
association with
members of that
group. "Presumed" means
presumed by the offender.
Main findings
Racist incidents
Tables 3.1 – 3.4
The overall number of racist incidents
recorded by the police rose by 7% from
49,078 in 2002/3 to 52,694 in 2003/4
(Table 3.1). A majority of forces showed
an increase in the number of incidents,
but the Metropolitan Police showed a
slight decline.
Research from across the UK indicates
that the majority of racist incidents
recorded are either damage to property
or verbal harassment (Maynard and
Read, 1997; Clark and Moody, 2002;
Jarman, 2002).
The British Crime Survey (BCS) records
people's experience and perception of
crime including whether a victim of crime
perceived it to be racially motivated. The
2000 sweep of the BCS indicated that
56% of racially motivated incidents
against Black people and 53% against
Asian people occurred in the home. The
figure for White people was much lower
(36%). In addition, Black victims
identified 74% of offenders as White,
22% as Black, and 2% each as Asian or
Mixed. For Asian victims the figures
were 67% White, 14% Mixed, 13%
Black and 4% Asian; and for White
people the equivalent figures were 37%
Black, 34% Asian, 18% White and 6%
Mixed (Clancy
et al
, 2001).
The number of racially motivated
incidents in 2003/4 estimated from BCS
data was around 206,000, similar to
2002/3. The 2002/3 BCS showed that
nearly two-thirds (135,000) of incidents
involved personal crime and the rest
(71,000) were crimes against
households. There are differences
between these types of crime in the
exposure of the various ethnic groups to
them.
Results from the 2002/3 BCS show that
less than 1% of White people had
experienced a crime that they thought
was racially motivated. This compares
to 2% for Black, 2% for those in the
Chinese and ‘other’ minority ethnic
group, 3% for Asian respondents and
4% for Mixed. With regard to reporting
crimes, those of Mixed ethnicity were
less likely to report crimes to the police
(31%) than Black/Black British people
(37%), the Chinese or ‘Other’ minority
ethnic groups (41%) or the Asian group
(42%).
The 2003/4 BCS shows that people in
all BME groups were significantly more
likely than White people to be worried
about burglary, car crime and violent
crime. There were some differences in
levels of worry between people in the
individual BME groups. Black people
(32%) had significantly higher levels of
worry about car crime compared to
those in other BME groups (Asian 27%,
Chinese or other 22%, and Mixed 20%).
Black (33%) and Asian (36%) people
had higher levels of worry about violent
crime compared to people from a Mixed
(24%) or ‘Chinese or other’ (28%)
background. There were falls in worry
about all three types of crime between
2002/3 and 2003/4 for all ethnic groups.
Racially aggravated offences
common assault; this is a similar pattern
to that in the previous year (Table 3.2).
Police forces varied widely in the
number and type of offences recorded.
Whilst the overall number of aggravated
offences of harassment, other wounding
and criminal damage rose, there was a
fall for those of common assault. When
compared with the total number of
similar non-racially aggravated offences,
11.9% of harassment offences were
recorded as racially aggravated, 1.7% of
common assaults, 1.1% of other
wounding and 0.5% of criminal damage
offences, an almost identical pattern to
that in the previous year.
Overall, about one-third of both racially
and non-racially aggravated offences
were cleared-up. The rate varied widely
between offence types. 50% of
non-racially aggravated offences of ‘other
wounding’ were cleared up compared to
only 41% of racially aggravated offences
of the same type, and 58% of
non-racially aggravated harassment cases
were cleared up compared to only 37%
of racially aggravated offences of the
same type.
A total of 6,310 persons were cautioned
or prosecuted at courts for racially
aggravated offences in 2003, a rise of
17% over the previous year. Of these,
23% were aged under 18 years (Table
3.4). Of the 5,629 persons prosecuted at
magistrates’ courts in 2003, 2,440 (43%)
were convicted and 41% were either
acquitted or their case was terminated
early. A total of 893 (16%) persons were
committed to Crown Court for trial.
Figures for 2002 for this table have
been included again this year (see
Table 3.3), as the table given in the
previous Section 95 publication related
to offences, rather than individuals.
Crown Court centres in England &
Wales dealt with 784 offenders charged
with racially aggravated offences in
2003. Of these, 457 were convicted
(58%); 42% were either not tried or
were acquitted.
The Crown Prosecution Service (CPS)
monitors prosecution decisions and
outcomes in all cases identified by the
police or CPS as arising from a racial
incident. The CPS scheme which
adopts the MacPherson definition of a
racist incident, includes information
about the specific racially aggravated
offences charged under the Crime and
Disorder Act 1998 as well as offences
that could fall within Section 153 of the
Powers of Criminal Courts (Sentencing)
Act 2000.
Table 3.1 Racist incidents for all police force areas 1996/7 to 2003/4
Police force area 1996/7 1997/8 1998/9 1999/00 2000/1 2001/2 2002/3 2003/4 Change %
2002/3 to 2003/4
Avon & Somerset 310 409 626 887 956 940 1,125 1,472 31
Bedfordshire 77 75 134 300 301 289 293 279 -5
Cambridgeshire 141 147 205 519 691 736 878 773 -12
Cheshire 92 78 158 421 399 405 184 289 57
Cleveland 68 76 147 204 307 399 444 507 14
Cumbria 37 46 45 85 97 155 162 197 22
Derbyshire 208 174 208 383 504 678 678 481 -29
Devon & Cornwall 82 90 116 538 776 874 781 942 21
Dorset 67 86 145 185 212 69 260 52 -80
Durham 24 37 75 178 247 275 224 234 4
Essex 116 160 229 431 679 813 452 626 38
Gloucestershire 34 32 83 258 389 432 380 314 -17
Greater Manchester 595 624 1,197 2,324 2,663 3,955 2,642 2,824 7
Hampshire 178 219 271 654 845 888 864 1,409 63
Hertfordshire 295 288 325 703 984 1,237 1312 1,463 12
Humberside 55 72 111 215 422 100 350 391 12
Kent 256 276 273 914 1,278 888 986 862 -13
Lancashire 337 311 450 917 1,274 2,178 1,521 1,923 26
Leicestershire 299 237 367 878 908 1,132 1,181 1,284 9
Lincolnshire 7 6 14 19 42 150 149 230 54
London, City of 10 6 28 55 91 72 103 32 -69
Merseyside 162 241 324 822 761 690 763 951 25
Metropolitan Police 5,621 5,862 11,050 23,346 20,628 16,711 15,453 15,319 -1
Norfolk 56 89 94 253 259 287 363 356 -2
Northamptonshire 195 318 282 597 591 663 619 768 24
Northumbria 488 444 623 1,159 1,626 1,747 1,552 1,655 7
North Yorkshire 43 41 64 96 128 228 58 22 -62
Nottinghamshire 330 391 475 714 914 1,097 1,090 1,184 9
South Yorkshire(1) 169 213 293 557 698 698 754 787 4
Staffordshire 225 214 220 202 500 1,138 466 595 28
Suffolk 74 54 150 234 291 375 345 409 19
Surrey 55 45 126 338 573 607 648 853 32
Sussex 260 298 399 934 1,526 1,120 1,106 1,214 10
Thames Valley 233 279 486 999 1,088 1,470 1,445 1,772 23
Warwickshire 66 107 111 150 175 314 310 310 0
West Mercia 64 57 83 464 871 978 864 948 10
West Midlands 725 632 988 1,548 3,321 4,058 3,009 3,256 8
West Yorkshire 623 644 1,068 2,118 2,534 2,919 2,602 2,879 11
Wiltshire 35 59 101 221 356 121 332 419 26
Dyfed-Powys 18 17 37 99 142 167 135 172 27
Gwent 60 45 98 213 269 191 232 248 7
North Wales 4 12 36 80 248 301 369 337 -9
South Wales 357 367 734 1,602 1,528 1,825 1,594 1,656 4
England & Wales 13,151 13,878 23,049 47,814 53,092 54,370 49,078 52,694 7
Table 3.2 Racially or religiously aggravated offences recorded by police forces
by offence type, 2002/3
(1)and 2003/4, with clear-up rates for England and Wales
Police force area Harassment Other wounding Criminal
Damage
Common assault
Total
2002/3 2003/4 2002/3 2003/4 2002/3 2003/4 2002/3 2003/4 2002/3 2003/4
Avon & Somerset 580 868 100 128 117 178 103 82 900 1,256
Bedfordshire 83 127 50 42 17 18 19 20 169 207
Cambridgeshire 263 248 63 90 31 17 53 29 410 384
Cheshire 255 273 20 22 71 71 30 34 376 400
Cleveland 46 129 11 23 67 58 21 41 145 251
Cumbria 48 93 9 11 8 7 5 5 69 116
Derbyshire 320 354 109 99 109 126 22 21 560 600
Devon & Cornwall 280 350 104 117 49 44 63 77 496 588
Dorset 78 58 23 51 28 28 48 29 177 166
Durham 69 107 3 14 100 5 199 12 371 138
Essex 273 393 113 134 129 161 43 72 558 760
Gloucestershire 154 122 15 19 22 10 19 16 210 167
Greater Manchester 1,176 1,608 423 467 587 618 167 171 2,353 2,864
Hampshire 167 265 45 43 58 67 47 40 317 415
Hertfordshire 115 424 64 77 109 140 55 89 343 730
Humberside 193 293 54 67 33 49 22 29 302 438
Kent 208 206 98 105 122 93 119 76 547 480
Lancashire 405 714 144 138 253 142 58 91 860 1,085
Leicestershire 408 465 98 101 188 133 115 110 809 809
Lincolnshire 79 84 19 41 24 37 14 17 136 179
London, City of 46 40 9 8 2 2 14 10 71 60
Merseyside 310 478 93 101 253 303 78 61 734 943
Metropolitan Police 5,374 5,469 918 782 1,400 1,291 2,161 1,926 9,853 9,468
Norfolk 111 170 31 40 35 32 26 26 203 268
Northamptonshire 169 210 50 82 58 91 26 30 303 413
Northumbria 633 690 54 107 122 106 125 71 934 974
North Yorkshire 55 36 6 6 4 5 15 7 80 54
Nottinghamshire 475 463 61 53 64 62 35 41 635 619
South Yorkshire 122 124 23 43 59 69 38 23 242 259
Staffordshire 191 239 86 146 124 141 65 74 466 600
Suffolk 165 198 32 46 25 24 24 29 246 297
Surrey 239 284 72 71 61 72 35 55 407 482
Sussex 222 266 71 127 44 86 106 73 443 552
Thames Valley 521 647 126 121 189 212 112 124 948 1,104
Warwickshire 85 94 19 26 22 41 33 26 159 187
West Mercia 357 456 50 85 75 83 45 50 527 674
West Midlands 1,146 1,177 697 719 427 449 152 134 2,422 2,479
West Yorkshire 268 1,218 213 298 131 257 95 101 707 1,874
Wiltshire 140 147 22 35 53 36 17 26 232 244
Dyfed-Powys 69 91 12 17 13 11 2 7 96 126
Gwent 139 186 26 25 17 18 11 11 193 240
North Wales 159 144 27 35 86 85 16 14 288 278
South Wales 499 576 90 78 110 103 38 37 737 794
England & Wales 16,695 20,584 4,352 4,840 5,496 5,581 4,491 4,017 31,034 35,022
% racially aggravated 12.1 11.9 1.2 1.1 0.5 0.5 1.9 1.7 1.7 1.8
% cleared-up
Racially-aggravated 39 37 40 41 19 19 30 29 34 34 Non-racially aggravated 64 58 52 50 13 13 41 38 28 28
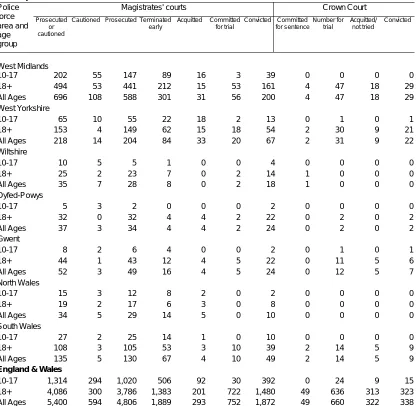
Table 3.3 Number of persons cautioned and prosecuted at magistrates' courts
and the Crown Court for racially aggravated offences, by age group and result,
2002
Magistrates' courts Crown Court
Police force area and age group
Prosecuted or cautioned
Cautioned Prosecuted Terminated early
Acquitted Committed for trial
Convicted Committed for sentence
Number for trial
Acquitted/ not tried
Convicted
Avon & Somerset
10-17 17 1 16 8 3 1 4 0 1 1 0
18+ 101 7 94 32 3 28 31 1 19 10 9
All Ages 118 8 110 40 6 29 35 1 20 11 9
Bedfordshire
10-17 10 6 4 4 0 0 0 0 0 0 0
18+ 49 8 41 17 3 12 9 0 4 1 3
All Ages 59 14 45 21 3 12 9 0 4 1 3
Cambridgeshire
10-17 16 9 7 2 0 0 5 0 1 0 1
18+ 54 9 45 12 8 0 25 1 1 0 1
All Ages 70 18 52 14 8 0 30 1 2 0 2
Cheshire
10-17 22 1 21 13 0 3 5 0 0 0 0
18+ 53 1 52 21 2 8 21 0 5 2 3
All Ages 75 2 73 34 2 11 26 0 5 2 3
Cleveland
10-17 8 0 8 5 0 1 2 0 0 0 0
18+ 16 0 16 7 1 2 6 2 4 3 1
All Ages 24 0 24 12 1 3 8 2 4 3 1
Cumbria
10-17 3 0 3 1 0 1 1 0 2 0 2
18+ 19 0 19 4 1 5 9 0 3 2 1
All Ages 22 0 22 5 1 6 10 0 5 2 3
Derbyshire
10-17 19 6 13 3 1 0 9 0 0 0 0
18+ 56 3 53 14 2 10 27 1 3 0 3
All Ages 75 9 66 17 3 10 36 1 3 0 3
Devon & Cornwall
10-17 11 4 7 5 0 0 2 0 0 0 0
18+ 58 2 56 18 0 16 22 0 6 3 3
All Ages 69 6 63 23 0 16 24 0 6 3 3
Dorset
10-17 5 2 3 0 1 0 2 0 0 0 0
18+ 26 2 24 4 3 10 7 1 6 3 3
All Ages 31 4 27 4 4 10 9 1 6 3 3
Durham
10-17 11 2 9 5 0 1 3 0 0 0 0
18+ 39 4 35 12 0 4 19 1 1 1 0
All Ages 50 6 44 17 0 5 22 1 1 1 0
Essex
10-17 21 5 16 13 0 1 2 0 0 0 0
18+ 59 2 57 35 0 14 8 0 12 3 9
All Ages 80 7 73 48 0 15 10 0 12 3 9
Gloucestershire
10-17 11 5 6 3 0 0 3 0 0 0 0
18+ 39 7 32 12 3 0 17 3 2 0 2
Table 3.3 cont Number of persons cautioned and prosecuted at magistrates'
courts and the Crown Court for racially aggravated offences, by age group and
result, 2002
Magistrates' courts Crown Court
Police force area and age group
Prosecuted or cautioned
Cautioned Prosecuted Terminated early
Acquitted Committed for trial
Convicted Committed for sentence
Number for trial
Acquitted/ not tried
Convicted
Greater Manchester
10-17 120 5 115 45 18 6 46 0 3 1 2
18+ 271 4 267 81 31 53 102 4 59 36 23
All Ages 391 9 382 126 49 59 148 4 62 37 25
Hampshire
10-17 46 4 42 20 3 0 19 0 0 0 0
18+ 117 4 113 30 5 23 55 3 20 9 11
All Ages 163 8 155 50 8 23 74 3 20 9 11
Hertfordshire
10-17 21 7 14 7 2 0 5 0 0 0 0
18+ 52 3 49 17 2 9 21 1 10 4 6
All Ages 73 10 63 24 4 9 26 1 10 4 6
Humberside
10-17 20 2 18 9 2 0 7 0 0 0 0
18+ 48 1 47 18 2 9 18 2 6 4 2
All Ages 68 3 65 27 4 9 25 2 6 4 2
Kent
10-17 10 6 4 2 0 0 2 0 0 0 0
18+ 27 3 24 12 1 5 6 0 9 8 1
All Ages 37 9 28 14 1 5 8 0 9 8 1
Lancashire
10-17 62 13 49 24 3 0 22 0 0 0 0
18+ 174 13 161 66 8 18 69 0 17 5 12
All Ages 236 26 210 90 11 18 91 0 17 5 12
Leicestershire
10-17 33 0 33 15 0 0 18 0 1 1 0
18+ 124 0 124 35 6 31 52 2 11 5 6
All Ages 157 0 157 50 6 31 70 2 12 6 6
Lincolnshire
10-17 5 1 4 4 0 0 0 0 0 0 0
18+ 17 0 17 4 0 1 12 1 1 1 0
All Ages 22 1 21 8 0 1 12 1 1 1 0
London, City of
10-17 3 3 0 0 0 0 0 0 0 0 0
18+ 15 6 9 3 0 3 3 0 2 2 0
All Ages 18 9 9 3 0 3 3 0 2 2 0
Merseyside
10-17 24 3 21 7 4 0 10 0 1 1 0
18+ 71 3 68 23 9 13 23 0 21 7 14
All Ages 95 6 89 30 13 13 33 0 22 8 14
Metropolitan Police
10-17 219 49 170 87 10 4 69 0 10 3 7
18+ 885 70 815 296 25 218 276 6 212 137 75
All Ages 1,104 119 985 383 35 222 345 6 222 140 82
Norfolk
10-17 8 3 5 3 0 0 2 0 0 0 0
18+ 48 5 43 18 1 12 12 1 6 1 5
Table 3.3 cont. Number of persons cautioned and prosecuted at magistrates'
courts and the Crown Court for racially aggravated offences, by age group and
result, 2002
Magistrates' courts Crown Court
Police force area and age group
Prosecuted or cautioned
Cautioned Prosecuted Terminated early
Acquitted Committed for trial
Convicted Committed for sentence
Number for trial
Acquitted/ not tried
Convicted
Northamptonshire
10-17 6 5 1 0 0 1 0 0 0 0 0
18+ 23 10 13 2 1 8 2 1 2 2 0
All Ages 29 15 14 2 1 9 2 1 2 2 0
Northumbria
10-17 74 24 50 31 2 1 16 0 0 0 0
18+ 139 15 124 50 3 16 55 2 12 0 12
All Ages 213 39 174 81 5 17 71 2 12 0 12
North Yorkshire
10-17 5 1 4 1 1 0 2 0 0 0 0
18+ 29 3 26 6 0 10 10 1 1 0 1
All Ages 34 4 30 7 1 10 12 1 1 0 1
Nottinghamshire
10-17 39 6 33 14 0 3 16 0 1 1 0
18+ 125 2 123 50 7 16 50 2 5 1 4
All Ages 164 8 156 64 7 19 66 2 6 2 4
South Yorkshire
10-17 24 4 20 6 1 2 11 0 2 1 1
18+ 74 3 71 22 3 17 29 0 11 2 9
All Ages 98 7 91 28 4 19 40 0 13 3 10
Staffordshire
10-17 20 0 20 10 0 0 10 0 0 0 0
18+ 72 0 72 20 0 15 37 0 13 3 10
All Ages 92 0 92 30 0 15 47 0 13 3 10
Suffolk
10-17 9 3 6 1 2 0 3 0 0 0 0
18+ 38 8 30 9 8 2 11 0 9 3 6
All Ages 47 11 36 10 10 2 14 0 9 3 6
Surrey
10-17 4 4 0 0 0 0 0 0 0 0 0
18+ 13 8 5 0 1 3 1 0 7 3 4
All Ages 17 12 5 0 1 3 1 0 7 3 4
Sussex
10-17 21 7 14 8 1 0 5 0 0 0 0
18+ 72 6 66 20 1 24 21 0 13 6 7
All Ages 93 13 80 28 2 24 26 0 13 6 7
Thames Valley
10-17 21 5 16 6 1 0 9 0 0 0 0
18+ 79 2 77 20 16 7 34 1 9 7 2
All Ages 100 7 93 26 17 7 43 1 9 7 2
Warwickshire
10-17 11 5 6 0 0 0 6 0 0 0 0
18+ 36 5 31 10 0 3 18 1 4 1 3
All Ages 47 10 37 10 0 3 24 1 4 1 3
West Mercia
10-17 23 13 10 6 0 0 4 0 0 0 0
18+ 93 16 77 27 1 7 42 2 6 1 5
Table 3.3 cont Number of persons cautioned and prosecuted at magistrates'
courts and the Crown Court for racially aggravated offences, by age group and
result, 2002
Magistrates' courts Crown Court
Police force area and age group
Prosecuted or cautioned
Cautioned Prosecuted Terminated early
Acquitted Committed for trial
Convicted Committed for sentence
Number for trial
Acquitted/ not tried
Convicted
West Midlands
10-17 202 55 147 89 16 3 39 0 0 0 0
18+ 494 53 441 212 15 53 161 4 47 18 29
All Ages 696 108 588 301 31 56 200 4 47 18 29
West Yorkshire
10-17 65 10 55 22 18 2 13 0 1 0 1
18+ 153 4 149 62 15 18 54 2 30 9 21
All Ages 218 14 204 84 33 20 67 2 31 9 22
Wiltshire
10-17 10 5 5 1 0 0 4 0 0 0 0
18+ 25 2 23 7 0 2 14 1 0 0 0
All Ages 35 7 28 8 0 2 18 1 0 0 0
Dyfed-Powys
10-17 5 3 2 0 0 0 2 0 0 0 0
18+ 32 0 32 4 4 2 22 0 2 0 2
All Ages 37 3 34 4 4 2 24 0 2 0 2
Gwent
10-17 8 2 6 4 0 0 2 0 1 0 1
18+ 44 1 43 12 4 5 22 0 11 5 6
All Ages 52 3 49 16 4 5 24 0 12 5 7
North Wales
10-17 15 3 12 8 2 0 2 0 0 0 0
18+ 19 2 17 6 3 0 8 0 0 0 0
All Ages 34 5 29 14 5 0 10 0 0 0 0
South Wales
10-17 27 2 25 14 1 0 10 0 0 0 0
18+ 108 3 105 53 3 10 39 2 14 5 9
All Ages 135 5 130 67 4 10 49 2 14 5 9
England & Wales
10-17 1,314 294 1,020 506 92 30 392 0 24 9 15
18+ 4,086 300 3,786 1,383 201 722 1,480 49 636 313 323
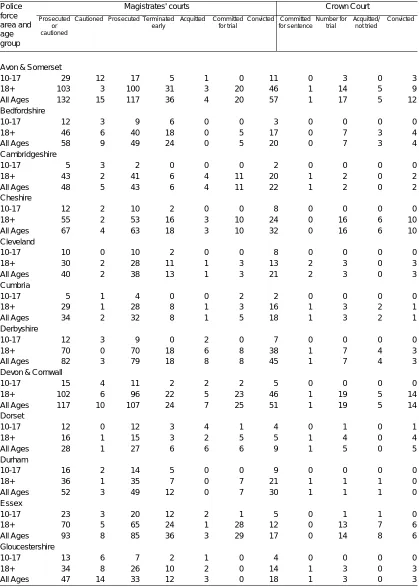
Table 3.4 Number of persons cautioned and prosecuted at magistrates' courts
and the Crown Court for racially aggravated offences, by age group and result,
2003
Magistrates' courts Crown Court
Police force area and age group
Prosecuted or cautioned
Cautioned Prosecuted Terminated early
Acquitted Committed for trial
Convicted Committed for sentence
Number for trial
Acquitted/ not tried
Convicted
Avon & Somerset
10-17 29 12 17 5 1 0 11 0 3 0 3
18+ 103 3 100 31 3 20 46 1 14 5 9
All Ages 132 15 117 36 4 20 57 1 17 5 12
Bedfordshire
10-17 12 3 9 6 0 0 3 0 0 0 0
18+ 46 6 40 18 0 5 17 0 7 3 4
All Ages 58 9 49 24 0 5 20 0 7 3 4
Cambridgeshire
10-17 5 3 2 0 0 0 2 0 0 0 0
18+ 43 2 41 6 4 11 20 1 2 0 2
All Ages 48 5 43 6 4 11 22 1 2 0 2
Cheshire
10-17 12 2 10 2 0 0 8 0 0 0 0
18+ 55 2 53 16 3 10 24 0 16 6 10
All Ages 67 4 63 18 3 10 32 0 16 6 10
Cleveland
10-17 10 0 10 2 0 0 8 0 0 0 0
18+ 30 2 28 11 1 3 13 2 3 0 3
All Ages 40 2 38 13 1 3 21 2 3 0 3
Cumbria
10-17 5 1 4 0 0 2 2 0 0 0 0
18+ 29 1 28 8 1 3 16 1 3 2 1
All Ages 34 2 32 8 1 5 18 1 3 2 1
Derbyshire
10-17 12 3 9 0 2 0 7 0 0 0 0
18+ 70 0 70 18 6 8 38 1 7 4 3
All Ages 82 3 79 18 8 8 45 1 7 4 3
Devon & Cornwall
10-17 15 4 11 2 2 2 5 0 0 0 0
18+ 102 6 96 22 5 23 46 1 19 5 14
All Ages 117 10 107 24 7 25 51 1 19 5 14
Dorset
10-17 12 0 12 3 4 1 4 0 1 0 1
18+ 16 1 15 3 2 5 5 1 4 0 4
All Ages 28 1 27 6 6 6 9 1 5 0 5
Durham
10-17 16 2 14 5 0 0 9 0 0 0 0
18+ 36 1 35 7 0 7 21 1 1 1 0
All Ages 52 3 49 12 0 7 30 1 1 1 0
Essex
10-17 23 3 20 12 2 1 5 0 1 1 0
18+ 70 5 65 24 1 28 12 0 13 7 6
All Ages 93 8 85 36 3 29 17 0 14 8 6
Gloucestershire
10-17 13 6 7 2 1 0 4 0 0 0 0
18+ 34 8 26 10 2 0 14 1 3 0 3
Table 3.4 cont Number of persons cautioned and prosecuted at magistrates'
courts and the Crown Court for racially aggravated offences, by age group and
result, 2003
Magistrates' courts Crown Court
Police force area and age group
Prosecuted or cautioned
Cautioned Prosecuted Terminated early
Acquitted Committed for trial
Convicted Committed for sentence
Number for trial
Acquitted/ not tried
Convicted
Greater Manchester
10-17 109 4 105 44 6 3 52 0 4 3 1
18+ 369 7 362 112 17 59 174 1 55 21 34
All Ages 478 11 467 156 23 62 226 1 59 24 35
Hampshire
10-17 47 0 47 16 3 3 25 0 1 0 1
18+ 139 7 132 34 8 36 54 1 24 8 16
All Ages 186 7 179 50 11 39 79 1 25 8 17
Hertfordshire
10-17 20 6 14 6 1 0 7 0 4 0 4
18+ 66 4 62 25 2 12 23 0 6 3 3
All Ages 86 10 76 31 3 12 30 0 10 3 7
Humberside
10-17 27 1 26 9 1 0 16 0 0 0 0
18+ 74 3 71 23 0 13 35 0 9 2 7
All Ages 101 4 97 32 1 13 51 0 9 2 7
Kent
10-17 11 4 7 4 0 0 3 0 0 0 0
18+ 28 6 22 6 0 7 9 3 8 4 4
All Ages 39 10 29 10 0 7 12 3 8 4 4
Lancashire
10-17 90 15 75 40 4 0 31 0 0 0 0
18+ 213 9 204 75 10 20 99 1 24 11 13
All Ages 303 24 279 115 14 20 130 1 24 11 13
Leicestershire
10-17 59 7 52 25 1 2 24 0 3 1 2
18+ 156 1 155 59 10 25 61 1 28 9 19
All Ages 215 8 207 84 11 27 85 1 31 10 21
Lincolnshire
10-17 9 4 5 2 1 0 2 1 0 0 0
18+ 29 2 27 6 2 7 12 2 8 3 5
All Ages 38 6 32 8 3 7 14 3 8 3 5
London, City of
10-17 2 2 0 0 0 0 0 0 0 0 0
18+ 47 27 20 5 0 7 8 0 4 2 2
All Ages 49 29 20 5 0 7 8 0 4 2 2
Merseyside
10-17 48 3 45 19 7 1 18 0 2 1 1
18+ 109 3 106 29 9 28 40 0 25 12 13
All Ages 157 6 151 48 16 29 58 0 27 13 14
Metropolitan Police
10-17 127 23 104 40 15 8 41 0 4 3 1
18+ 1,011 91 920 263 39 270 348 18 250 137 113
All Ages 1,138 114 1,024 303 54 278 389 18 254 140 114
Norfolk
10-17 10 3 7 1 2 0 4 0 0 0 0
18+ 47 2 45 17 0 12 16 0 14 2 12
Table 3.4 cont. Number of persons cautioned and prosecuted at magistrates'
courts and the Crown Court for racially aggravated offences, by age group and
result, 2003
Magistrates' courts Crown Court
Police force area and age group
Prosecuted or cautioned
Cautioned Prosecuted Terminated early
Acquitted Committed for trial
Convicted Committed for sentence
Number for trial
Acquitted/ not tried
Convicted
Northamptonshire
10-17 5 3 2 2 0 0 0 0 0 0 0
18+ 21 10 11 2 0 7 2 3 3 0 3
All Ages 26 13 13 4 0 7 2 3 3 0 3
Northumbria
10-17 91 29 62 35 3 0 24 0 0 0 0
18+ 179 15 164 68 7 18 71 1 12 1 11
All Ages 270 44 226 103 10 18 95 1 12 1 11
North Yorkshire
10-17 5 4 1 1 0 0 0 0 0 0 0
18+ 29 6 23 6 1 2 14 1 7 5 2
All Ages 34 10 24 7 1 2 14 1 7 5 2
Nottinghamshire
10-17 43 9 34 15 6 1 12 0 1 0 1
18+ 148 5 143 50 9 25 59 1 17 7 10
All Ages 191 14 177 65 15 26 71 1 18 7 11
South Yorkshire
10-17 28 4 24 15 1 0 8 0 1 1 0
18+ 75 1 74 21 2 13 38 0 9 1 8
All Ages 103 5 98 36 3 13 46 0 10 2 8
Staffordshire
10-17 35 0 35 11 1 1 22 0 0 0 0
18+ 80 0 80 37 1 13 29 0 13 2 11
All Ages 115 0 115 48 2 14 51 0 13 2 11
Suffolk
10-17 34 20 14 4 4 0 6 0 0 0 0
18+ 52 9 43 7 13 5 18 1 3 3 0
All Ages 86 29 57 11 17 5 24 1 3 3 0
Surrey
10-17 20 16 4 3 0 0 1 0 1 0 1
18+ 38 12 26 13 1 5 7 0 9 4 5
All Ages 58 28 30 16 1 5 8 0 10 4 6
Sussex
10-17 26 3 23 7 0 1 15 0 2 2 0
18+ 81 4 77 18 2 27 30 1 20 8 12
All Ages 107 7 100 25 2 28 45 1 22 10 12
Thames Valley
10-17 19 5 14 4 2 0 8 0 0 0 0
18+ 119 2 117 31 14 14 58 3 6 3 3
All Ages 138 7 131 35 16 14 66 3 6 3 3
Warwickshire
10-17 6 4 2 2 0 0 0 0 0 0 0 18+ 23 2 21 4 0 1 16 1 0 0 0 All Ages 29 6 23 6 0 1 16 1 0 0 0 West Mercia
10-17 46 18 28 16 0 1 11 0 0 0 0
18+ 112 9 103 31 4 12 56 3 11 3 8
Table 3.4 cont Number of persons cautioned and prosecuted at magistrates'
courts and the Crown Court for racially aggravated offences, by age group and
result, 2003
Magistrates' courts Crown Court
Police force area and age group
Prosecuted or cautioned
Cautioned Prosecuted Terminated early
Acquitted Committed for trial
Convicted Committed for sentence
Number for trial
Acquitted/ not tried
Convicted
West Midlands
10-17 208 61 147 85 18 2 42 0 2 1 1
18+ 531 48 483 216 24 47 196 5 31 13 18
All Ages 739 109 630 301 42 49 238 5 33 14 19
West Yorkshire
10-17 80 25 55 26 6 1 22 0 4 3 1
18+ 176 16 160 63 12 22 63 3 29 6 23
All Ages 256 41 215 89 18 23 85 3 33 9 24
Wiltshire
10-17 20 8 12 5 0 0 7 0 0 0 0
18+ 35 3 32 5 0 7 20 1 2 1 1
All Ages 55 11 44 10 0 7 27 1 2 1 1
Dyfed-Powys
10-17 5 1 4 1 0 0 3 0 0 0 0
18+ 39 2 37 5 4 4 24 2 2 0 2
All Ages 44 3 41 6 4 4 27 2 2 0 2
Gwent
10-17 12 2 10 5 3 1 1 0 0 0 0
18+ 31 1 30 2 5 3 20 0 6 2 4
All Ages 43 3 40 7 8 4 21 0 6 2 4
North Wales
10-17 16 4 12 2 0 0 10 0 0 0 0
18+ 30 2 28 2 2 2 22 0 2 0 2
All Ages 46 6 40 4 2 2 32 0 2 0 2
South Wales
10-17 22 6 16 7 1 1 7 0 1 0 1
18+ 145 2 143 61 11 15 56 3 20 5 15
All Ages 167 8 159 68 12 16 63 3 21 5 16
England & Wales
10-17 1,444 333 1,111 491 98 32 490 1 35 16 19
18+ 4,866 348 4,518 1,470 237 861 1,950 66 749 311 438
Homicide
Introduction
The information presented in this
section on homicide in England &
Wales comes from two principal
sources: the Home Office Homicide
Index (which contains records of the
details of all offences reported as
homicides) and summary information
provided by the police in aggregate
form as part of the routine quarterly
returns on all offences recorded by the
police.
Main findings
Tables 3.5 - 3.8
Due to the small number of homicides
recorded each year, the tables
included in this report combine data for
2001/2, 2002/3 and 2003/4. Figures
shown cover those cases currently
recorded as homicide (i.e. murder,
manslaughter and infanticide) and
exclude those cases where the
offence has been reclassified following
subsequent investigation or a court
decision.
In total, 2,605 homicides were
recorded by the police in the three
years 2001/2, 2002/3 and 2003/4.
Three-quarters (75%) of victims were
White, 10% were Black, 6% were
Asian and 4% ‘Other’ (Table 3.5).
The
largest number of victims was
recorded in the Metropolitan Police
District with 565, followed by Greater
Manchester with 350 (including 172
originally recorded as homicide victims
in the Shipman case), West Midlands
with 161 and West Yorkshire with 118.
In West Yorkshire the number of Asian
victims was six times that of Black
people.
Table 3.6 shows