Service supply chain environmental performance evaluation using Grey based
hybrid MCDM approach
P. Chithambaranathan
PSNA College of Engineering and Technology, Dindigul, India - 624 622
Email: [email protected]
Nachiappan Subramanian
Nottingham University Business School China, The University of Nottingham Ningbo China,
199 Taikang East Road, Ningbo, 315 100. Email: [email protected]
AngappaGunasekaran*
Department of Decision and Information Sciences, Charlton College of Business,
University of Massachusetts – Dartmouth,
285 Old Westport Road, North Dartmouth, MA 02747-2300, USA E-mail: [email protected]
* Corresponding Author
PL.K.Palaniappan
Thiagarajar College of Engineering, Madurai – 625015, India
Email: [email protected]
Revised version submitted to the IJPE Special issue on “Strategic supplier selection using multi-stakeholder and multi perspectives approach” edited by William Ho et al.
Service supply chain environmental performance evaluation using Grey based
hybrid MCDM approach
Abstract
Contribution of service supply chains to economic growth is significant and recent climate change issues expect services to be greener. The entire supply chain will be green if their suppliers adopt the requirements of the focal company and customers. Hence, it is essential that every organization constantly analyses and monitors the green performance of different members of the supply chains. Furthermore comprehensive studies have been carried out to identify criteria to evaluate green performance of manufacturing supply chain. However there is lack of studies to identify criteria and evaluate the performance of service supply chain. Service supply chain green performance evaluation necessitates methods to consider both qualitative and quantitative factors. Many conventional multi- criteria decision making (MCDM) methods have drawbacks such as inability to capture realistic fuzziness in decision making (human judgment), inadaptability to different levels of measurement, complexity in calculation and requirement of intricate details, which render them unsuitable for the task of environmental performance evaluation of service supply chains. In this paper, a grey based hybrid framework for evaluating the environmental performance of service supply chains is proposed by integrating grey based method with ELECTRE and VIKOR approaches. Two case studies were carried out to understand the effectiveness of criteria and method to evaluate environmental performance of service supply chains in a developing country context.
Keywords: service supply chain, environmental performance, grey, MCDM,
1. Introduction
material resources, overflowing waste sites, and increasing pollution levels. In recent years, GSCM initiatives are popular and widely used by firms to protect environment and to enhance their green image (Bose and Pal, 2012; Lin, 2013). Institutional pressure is an important motivator for the green adoption of advanced environmental management practices. Focal companies do not act alone but are interconnected which mandates all the members to adopt green practices (Seuring et al., 2008). Through GSCM, firms can select a wide variety of suppliers and leverage resources throughout the firm to eliminate the environmental impacts of supply chain activities (Tseng, 2010).
It is interesting to note that all organizations do not face the same pressure for GSCM adoption (Zhu and Sarkis, 2006). Different industry sectors in different parts of the world face various pressures. Xiao (2006) suggests five environmental pressures from the stakeholder point of view: (a) government as regulatory stakeholder, (b) media, (c) local resident as a community group, (d) contractors and clients, and (e) other stakeholders including related organization which can affect the company financially. Realizing that sustainability can drive the improvement of the company’s bottom line through cost savings, improved market share, and stronger brand images, a growing number of firms have begun to take greening initiatives as their strategic weapons (Min and Kim, 2012).
The traditional end of the pipe approach only transforms pollutants from one form to another and does not eliminate them (Eltayeb et al., 2011). Unlike the traditional environmental management approach, however, the GSCM concept supposes complete responsibility of an organization towards its products and services from the extraction of raw materials up to final use and disposal. It represents the application of sound environmental management principles to all stages of a product’s life cycle, including design, procurement, manufacturing, assembly, packaging, logistics, distribution, usage and final recycling to enhance an organization’s competitive advantage (Handfield et al., 1997; Eltayeb et al., 2011). To improve their environmental performance, individual firms have implemented various kinds of environmental practices such as ISO14000 certification, cleaner production, environmental management systems and ecodesign. Recent studies suggests six GSCM dimensions such as green manufacturing and packaging, environmental participation, green marketing, green suppliers selection, green stock, and green eco design as potential ways to compete against rivals (Shang et al., 2010).
Bhattacharya et al., 2010; Georgiadis and Besiou, 2010; Diabat and Govindan, 2011; Kumaraswamy et al., 2011; Tseng, 2011; Tseng and Huang, 2011; Zarandi et al., 2011; Giminez et al., 2012; Hassini et al., 2012; Pirraglia and Saloni, 2012; Lin, 2013; Tseng and Chiu, 2013; Bhattacharya et al., 2014; Karsak and Dursun, 2014; Rezaei et al., 2014; Yu and Wong, 2014). Few popular criteria used to evaluate green performance of suppliers are environment management system, GSCM capabilities, level of commitment to environment, degree of green supplier assessment, degree of green supplier collaboration and pollution control and prevention (Lee et al., 2009; Grisi et al., 2010; Large and Thomsen, 2011; Govindan et al., 2013). From the above studies it is obvious that criteria used to evaluate manufacturing sector have been discussed well in the literature. However, the criteria suitable to evaluate service supply chains are not well known.
In terms of methods, early studies proposed hybrid methods but most of them are related with fuzzy based method. Few of them are Noci (1997); Zhang et al. (2003); Awasthi et al. (2010). However few other studies used other methods such as DEA (Kumar and Jain, 2010; Wen and Chi, 2010; Kuo and Lin, 2011; Mirhedayatian et al., 2014). In terms of developing country context, few attempts were made to identify the status quo of environmental aspects such as awareness, sharing environment knowledge and recognizing the importance of environmental performance over economic performances of supply chains (Govindan et al., 2014; Min and Kim, 2012). It is clear from the recent review article by Min and Kim (2012) that very few attempts have been made to understand the GSCM nature in the developing countries context. In addition to the above, service sector is becoming the lifeline for the social and economic growth of any country. It is well known that the contribution of the service sector to nation’s progress is substantial. Services contribute twice the economic output compared with manufacturing (Rosenblum et al, 2000). Until today, only few studies have attempted to evaluate the performance of member firms of service supply chains. In particular, the environmental performance of member firms of service supply chains in a specific industry with respect to developing country context remains an unexplored area.
variation, capable to capture holistic aspects, suitability to accommodate different levels of measurements, simple to use and easy to implement which make these two approaches very much suitable for the task of evaluation. The framework proposed comprises of two hybrid approaches, the first developed by the integration of grey system theory and ELECTRE and the second developed by the integration of grey system theory and VIKOR. The framework proposed was applied to a case study available in the literature and the feasibility and practicability of the framework is validated. Two case studies were carried out to understand the evaluation criteria and effectiveness of the proposed framework with the member firms of service supply chains in a developing country context.
The remaining paper is organized as follows: Review of the supply chain environmental performance evaluation criteria is presented in section 2. In Section 3, the fundamentals of the grey system theory, the ELECTRE and the VIKOR approaches are discussed and the detailed procedural steps of the proposed framework for environmental performance evaluation are explained. In Section 4, two case studies on service supply chains were explained. Section 5 discusses the environmental performance evaluation with respect to the industry context. Section 6 validates the proposed framework with a published method and finally Section 7 summaries major findings and highlights the future research directions.
2. Environmental performance evaluation criteria for supply chains
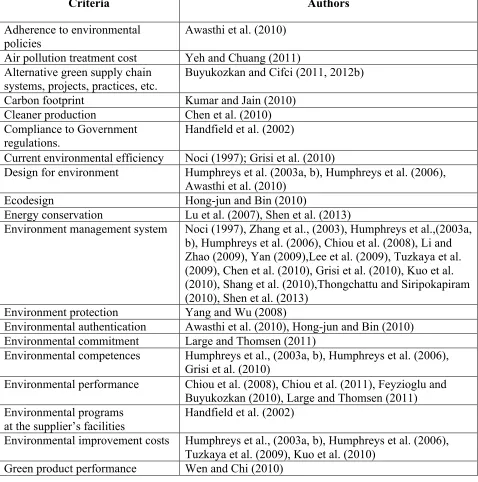
Identification of appropriate criteria based on which the environmental performance evaluation of supply chains can be carried out is an important step in the whole exercise. Many authors have come up with a variety of environmental evaluation criteria for carrying out environmental performance evaluation of supply chains. The dynamic change of environmental criteria adds additional complexities for both practitioners and researchers. Environmental performance evaluation criteria suggested by various authors have been summarized based on the literature in Table 1. The most widely considered criterion is environmental management system. This major criterion is followed by green image, environmental performance, environmental competencies, design for environment, green competencies, corporate and social responsibilities, environmental efficiency, environmental authentication, environmental improvement cost, green logistic dimension, green organization activities, environmental certification, suppliers’ green image, use of environmentally friendly material, use of environmentally friendly technology, waste management, reuse, recycle, green process innovation, green product, green purchasing, green project partnership and green design.
For the purpose of evaluating the environmental performance of supply chain members both qualitative and quantitative factors must be considered (Buyukozkan and Cifri, 2012a). Various factors like the sector of activity, range of products and services, size of the organization, quantum of value addition carried out and outsourcing philosophy of the organization can influence the list of evaluation criteria. Hence, appropriate evaluation criteria need to be identified for every environmental performance evaluation exercise. While carrying out an environmental performance evaluation exercise of service supply chains, the list of evaluation criteria employed should reflect specific aspects of the services in general and the services subsector in which the firms are operating in particular.
3. The proposed framework for environmental performance evaluation 3.1 Grey system theory
Grey system theory (Deng, 1988, 1989 and 2002), is one of the effective methods that are used to solve uncertainty problems under discrete data and incomplete information. The major advantage is that it can generate satisfactory outcomes using a relatively small amount of data or with great variability in factors. In grey system theory, according to the degree of information it accepts partial known information and partial unknown information.
Grey system theory considers the condition of fuzziness and flexibility in dealing with inconsistent information in group decision making situations. Grey system theory has been successfully applied in solving a variety of problems, such as hiring decision (Olson and Wu, 2006), restoration planning for power distribution systems (Chen, 2005), modeling of quality function deployment (Wu, 2002), detection of silicon wafer slicing defects (Lin et al., 2006), supplier selection (Yang, 2006), sustainability evaluation of suppliers (Bai and Sarkis, 2010 a, b; Baskaran et al., 2012), financial performance evaluation (Kung and Wen, 2007), demand forecasting (Wang, 2004) and evaluation of service quality (Kuo and Liang, 2011).
3.2 ELECTRE approach
detect the presence of incomparability. It uses a systematic computational procedure an advantage of which is the absence of strong axiomatic assumptions. Other advantages of ELECTRE include the ability to take purely ordinal scales into account without the necessity of converting the original scales into abstract ones with an arbitrary imposed range (thus maintaining the original concrete verbal meaning), and the ability to take into consideration the decision makers’ indifference and preference thresholds when modeling the imperfect knowledge of data.
The ELECTRE method has been applied in many real world applications like education system (Giannoulas and Ishizaka, 2010), plant location selection (Ozcan et al., 2011), facility layout planning (Aiello et al., 2006), supplier selection (Montazer, 2009; Sevkli, 2010; Liu and Zhang, 2011), optimization of energy systems (Papadopoulos and Karagiannidis, 2008), material suitability (Shanian and Savadogo, 2006), contract selection (De Almeida, 2007) and risk sorting of pipelines (Britto et al., 2010). The proposed framework links ELECTRE approach with grey environment to provide a systematic process to arrive at a ranking list based on the environmental performance of member firms of supply chains.
3.3 VIKOR Approach
VIKOR, the Serbian name: VlseKriterijumska Optimizacija I Kompromisno Resenje, means multi criteria optimization and compromise solution. Opricovic and Tzeng (2002, 2004) developed the VIKOR method for multi criteria optimization of complex systems. VIKOR method focuses on ranking and selecting from a set of alternatives, and determines compromise solutions for a problem with conflicting criteria. Here, the compromise solution is a feasible solution which is the closest to the ideal, and a compromise means an agreement established by mutual concessions. The multi criteria measure for compromise ranking is developed from the Lp– metric that is used as an aggregating function in compromise programming.
The VIKOR method has been applied for many applications like selection of partners (Chen and Wang, 2009), service quality of airlines (Kuo and Liang, 2011; Liou et al., 2011), improving information security risk (Ou Yang et al., 2009), material selection (Jahan et al., 2011), renewable energy planning (San Cristobal, 2011) and water resources planning (Opricovic, 2011). The VIKOR approach is applied in the grey environment to provide a rational and systematic process to arrive at a ranking list based on the environmental performance of member firms of supply chains.
4. Case studies
The framework proposed in this paper comprising of grey based ELECTRE and grey based VIKOR approaches can be employed for evaluating environmental performance of individual member firms of service supply chains. The different member firms of the supply chains are selected. A group of respondents having good expertise and experience in the areas of supply chain management and environmental protection and sufficient exposure to the sector in which the organization is operating, are identified and they are made members of the committee of the decision makers. This committee identifies the list of evaluation criteria based on which the environmental performance of different member firms of supply chains is to be evaluated. The decision makers use the linguistic weighting methodology to assess the importance of the various criteria arrived at. The decision makers then evaluate the different supply chain member firms under analysis based on the criteria arrived at and award linguistic ratings. These linguistic ratings are converted into the corresponding grey numbers. The first approach of the proposed framework i.e. the grey based ELECTRE approach is applied to the evaluation data which is in the form of grey numbers. The outcome of the grey based ELECTRE procedure is a ranking list of the different member firms subjected to the analysis. Similarly the second approach of the proposed framework i.e. the grey based VIKOR approach is also applied to the evaluation data which is in the form of grey numbers. Similar to the grey based ELECTRE procedure, the grey VIKOR procedure also produces a ranking list of the different member firms subjected to the analysis. In addition, the grey based VIKOR procedure also recommends a Compromise Solution in case the best ranked firm does not enjoy acceptable advantage.
An organization can thus carry out an evaluation of environmental performance of different member firms of supply chains employed by it and get a ranking list of the firms using the proposed framework. The framework can also be made use of, for analyzing the environmental performance of new members of supply chains before they are incorporated as part of the supply chains.
4.1 Medical support service providers to hospitals
In the healthcare sector changes take place at a very rapid rate. Continual upgradation in the level of sophistication and the type of technology employed in the equipments, used for diagnosis and treatment is a regular phenomenon in this sector. The equipments generate solid and liquid chemicals as waste whereas some equipments are also capable of emitting harmful radiation. The pharmaceutical industry is regularly coming out with new drugs to replace the existing ones. Though the absolute quantity of pollutants generated by the healthcare sector is small, the potential for harmful effects on the human population and other flora and fauna is significant, if recycling, disposal and mitigation efforts are not proper.
In a developing country like India, where the per capita income is raising gradually and size of the population is also expected to maintain its pace of growth in the coming years, there is significant potential for growth in the healthcare sector. There is a pressing need that attempts are made to ensure that the expansion in the sector takes place without causing much environmental degradation. Mathur et al. (2011) reported that though legal provisions exist in India [Biomedical Waste (management and handling) Rules, 1998], to mitigate the impact of hazardous and infectious hospital waste on the community, these provisions are yet to be fully implemented. It is essential that hospitals and medical practitioners monitor the environmental performance of medical support service providing firms to whom they are outsourcing. In this study, four Medical Support Service Providing firms (MSSPs) functioning in a city in South India were subjected to environmental performance analysis by implementing the proposed framework. These four MSSPs are providing medical support services to the hospitals in the city. The committee of decision makers formed for carrying out environmental performance evaluation of these MSSPs comprised of four experts, of whom three are medical practitioners in hospitals and the other one is an administrative officer in a hospital. The decision makers have 15, 18, 22 and 30 years of experience in the healthcare sector and are well exposed to working of MSSPs. The committee of decision makers finalized eight criteria based on which the environmental performance of the four MSSPs were to be evaluated. For arriving at the list of evaluation criteria, the committee of decision makers considered all relevant aspects of the health care sector and also considered the various environmental performance evaluation criteria available in the literature. The criteria finalized were: Stakeholders’ involvement and commitment (C1), Adoption of green technologies and practices (C2), Preference for environment friendly materials (C3), Green collaboration (C4), Regulatory conformance (C5), Staff training and involvement (C6), Recycling, reuse and disposal (C7) and Green image (C8).
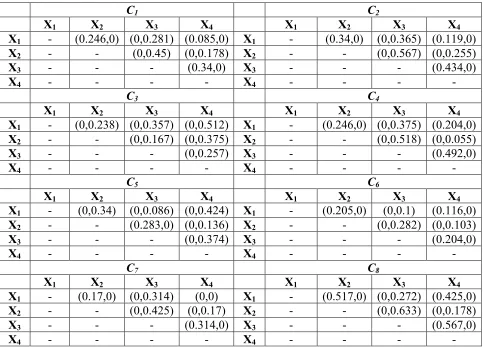
linguistic values for each MSSP, which are available in Table 4. The grey number equivalents of the linguistic valuations are calculated using Equations (2) and (3). The normalized grey decision matrix and the weighted normalized grey decision matrix are calculated using Equations (7) and (9) respectively. The distances between alternatives for each criterion are calculated and are presented in Table A1. The concordance and discordance matrices are formulated using Equations (10) and (11) respectively and are shown in Table A2. The Boolean matrices E and F are constructed using Equations (12) and (14) respectively and are shown in Table A3. The global matrix G is constructed by peer to peer multiplication of the elements of the matrices E and F using Equation (16) and is presented in Table 5. The grey best value and the grey worst value for the eight criteria are found out using Equations (17) and (18). Using Equations (19) - (25), ⊗ 𝑆#, ⊗ 𝑅# , ⊗ 𝑆∗, ⊗ 𝑆&, ⊗ 𝑅∗, ⊗ 𝑅&and ⊗ 𝑄
# values are calculated and are shown in
Table 6. From the grey values of ⊗ 𝑆# and ⊗ 𝑄#, the equivalent crisp values are found out and are shown in Table 6. The ranking list of the four MSSPs subjected to the analysis is obtained as MSSP2>MSSP1>MSSP4> MSSP3.
“ Insert Tables – 2,3,4,5 & 6 about here ”
4.2 Catering service providers to educational institutions
Catering Service Providers are another group of firms belonging to the category of service supply chain members. Since there is a lot of scope for improvement, the catering sector is capable of contributing a lot to the cause of environment protection. On the other hand, environmental degradation by the catering service providers can create a dent in the overall green image of the organizations that are outsourcing to the catering service providers. Hence, it is essential that organizations continuously analyse and monitor the environmental performance of the catering service providers, to whom the catering function is outsourced.
institutions in the city. The range of experience of the decision makers is 18 to 35 years. They have maintained consistent exposure to the catering activity in their respective educational institutions. The decision makers finalized seven criteria as the relevant ones for assessing the environmental performance of the CSPs. For arriving at the list of evaluation criteria, the committee of decision makers considered all relevant aspects of the catering sector and also considered the various environmental performance evaluation criteria available in the literature. The criteria were: Commitment of management (C1), Adoption of green technologies and practices (C2), Usage of green materials (C3), Green collaboration initiatives (C4), Regulatory conformance (C5), Training and motivation of employees (C6), and Recycling, reuse and disposal (C7).
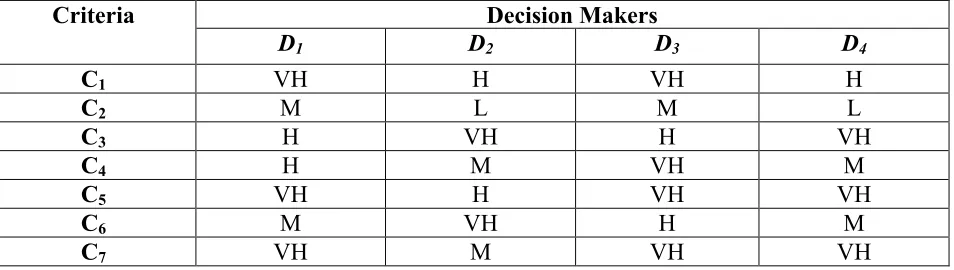
The four decision makers awarded linguistic valuations for the importance of seven criteria as shown in Table 7. They evaluated the four CSPs based on the seven criteria and awarded linguistic valuations as shown in Table 8. The grey number equivalents of the linguistic valuations are calculated using Equations (2) and (3). The normalized grey decision matrix and the weighted normalized grey decision matrix are calculated using Equations (7) and (9) respectively. The distances between alternatives for each criterion are calculated and are available in Table A4. The concordance and discordance matrices are formulated using Equations (10) and (11) respectively and are shown in Table A5. The Boolean matrices E and F are constructed using Equations (12) and (14) respectively and are shown in Table A6. The global matrix G is constructed by peer to peer multiplication of the elements of the matrices E and F using Equation (16) and is presented in Table 9. The grey best value and the grey worst value for the seven criteria are found out using Equations (17) and (18). Using Equations (19) - (25), ⊗ 𝑆#, ⊗ 𝑅# , ⊗ 𝑆∗, ⊗ 𝑆& ,⊗ 𝑅∗, ⊗ 𝑅&and ⊗ 𝑄
# values are calculated and are shown in
Table 10. From the grey values of ⊗ 𝑆# and ⊗ 𝑄#, the equivalent crisp values are found out and
are shown in Table 10. The ranking list of the four CSPs subjected to the analysis is obtained as CSP3> CSP2> CSP4> CSP1.
“ Insert Tables – 7, 8, 9 & 10 about here ”
5. Discussion
regulatory and contractual compliance, public perception and competitive advantage. The number of environmentally conscious customers is growing and has passed a threshold size to justify introducing green offerings in certain industry sectors. Improved environmental performance can result in increasing the green image and thus, in higher sales and profits in the long term.
Only when all supply chain participants have adopted green and sustainable practices, the entire chain can easily be greened and collaboration among them becomes easier and more effective. Hence, it is absolutely essential that every organization constantly analyses and monitors the green performance of the different supply chains, the organization is making use of. Many critical drawbacks pervert the existing environmental performance evaluation methods from making a significant contribution to the greening efforts in supply chain management. The major drawbacks with the existing methods are: incapable to capture holistic aspects, lack of suitability to the different levels of measurement, complexity in methods, requirement of intricate details, inability to capture vagueness in human judgment etc. In this paper, we have proposed a pragmatic framework by integrating the grey system theory, the ELECTRE and the VIKOR for evaluating the environmental performance of member firms of service supply chains.
Since services possess intangibility, inseparability and heterogeneity, evaluating service supply chain performance is a complex task. Since the evaluation results from evaluator’s view of linguistic variables, the analysis must be conducted in an uncertain environment. In order to overcome the issue, grey system theory needs to be incorporated into the performance analysis exercise. Grey system theory provides the suitable approach for analysis and modeling of systems with limited and incomplete information, and which may exhibit random uncertainty. The ELECTRE method is quick, operates with simple logic and has the strength of being able to detect the presence of incomparability. The major advantage of the VIKOR approach is that it also recommends a compromise solution in case the best ranked alternative does not enjoy acceptable advantage.
5.1 Medical support service providers to hospitals
MSSP2 was awarded impressive linguistic values by all the decision makers in all evaluation
criteria, except in the case of criteria C3 (Preference for environment friendly materials) and
hence emerged as the best performing firm. MSSP1 scored modest rankings in criteria C2
(Adoption of green technologies and practices) and in criteria C8 (Green image) and hence could
emerge only as the second ranked firm. MSSP4 fared very poorly in the case of criteria C3
(Preference for environment friendly materials) and criteria C5 (Regulatory conformance) and
hence got relegated to the third position. MSSP3 got very poor rankings in six out of the eight
criteria and is the worst performing firm.
5.2 Catering service providers to educational institutions
Four catering service providing firms (CSPs) providing catering services to the educational institutions, were subjected to the environmental performance evaluation exercise by implementing the proposed framework and the ranking list was obtained as CSP3>CSP2>CSP4>CSP1.The decision makers awarded very good ratings to the following four
criteria; Commitment of management (C1), Usage of green materials (C3), Regulatory
conformance (C5) and Recycling, reuse and disposal (C7). CSP3 was awarded impressive ratings
for all criteria by all decision makers, except criteria C2 (Adoption of green technologies and
practices) and hence emerged as the best performing firm. CSP2 received very good ratings for
criteria C4 (Green collaboration initiatives) and average ratings for all other criteria and emerged
as the second best performing firm. CSP4 scored moderate rankings in most of the criteria and
hence got relegated to the third position. CSP1 got very poor rankings in six out of the eight
criteria and is the worst performing firm.
6. Validation of the proposed framework
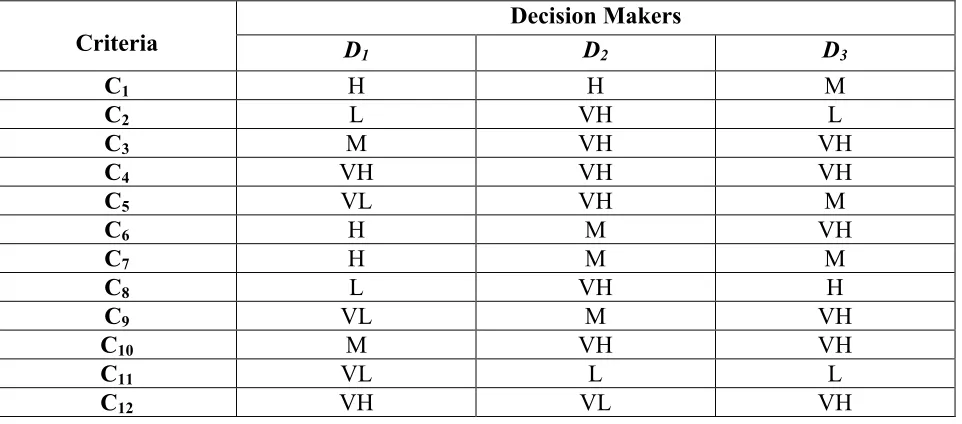
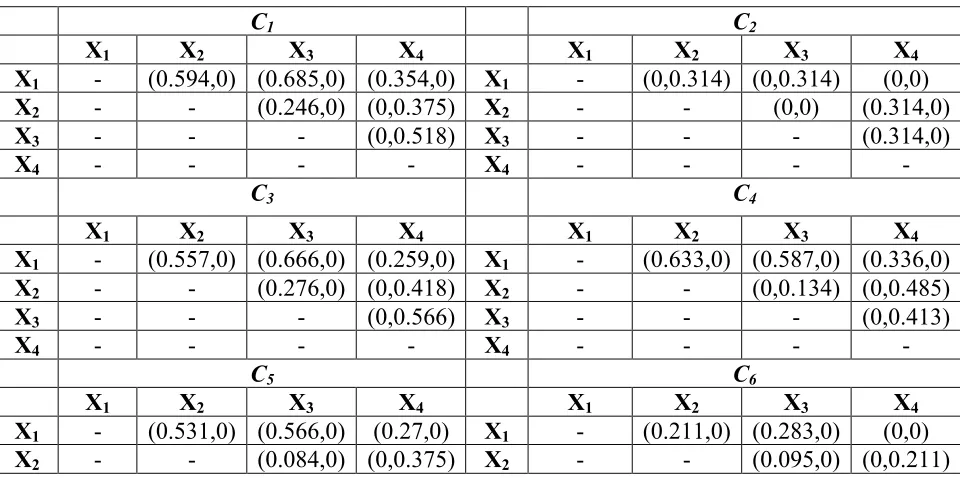
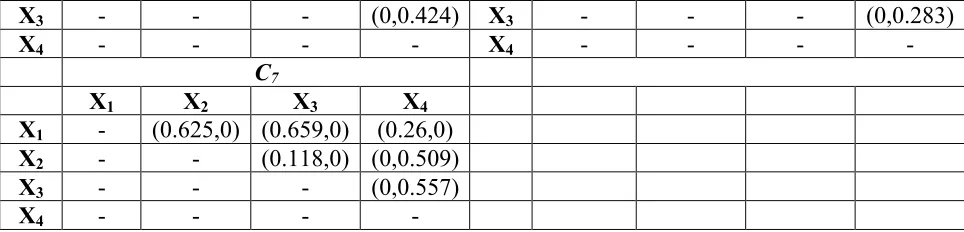
The framework proposed in this paper was validated with a published data set. Awasthi et al. (2010) carried out an analysis at City Logistics Projects (SUCCESS) in La Rochelle, France for analyzing the environmental performance of supply chain members. They employed the following 12 criteria for the analysis: Use of environment friendly technology (C1), Use of environment friendly materials (C2), Green market share (C3), Partnership with green organizations (C4), Management commitment (C5), Adherence to environmental policies (C6), Green R & D projects (C7), Staff training (C8), Lean process planning (C9), Design for environment (C10), Environmental certification (C11) and Pollution control initiatives (C12). The weights for importance of criteria suggested by the three decision makers and the ratings of the individual supply chain member firms are adopted from the paper by Awasthi et al. (2010) and are available in Tables 11 and 12 respectively. The linguistic valuations available in Tables 11 and 12 are converted into corresponding grey numbers for carrying out the calculations using Equations (2) and (3). The normalized grey decision matrix is constructed using Equation (7) and the weighted normalized grey decision matrix is formed using Equation (9). The distances between the alternatives for each criterion are calculated. The concordance and discordance matrices are formulated using Equations (10) and (11) respectively and are shown in Table A7. The Boolean matrices E and F are constructed using Equations (12) and (14) respectively and are shown in Table A8. The global matrix G is constructed by peer to peer multiplication of the elements of the matrices E and F using Equations (16) and is presented in Table 13. Thus the grey ELECTRE approach recommends the ranking order A1> A2 > A3 > A4 . A1 emerges as the best ranked firm followed by A2 and A3.
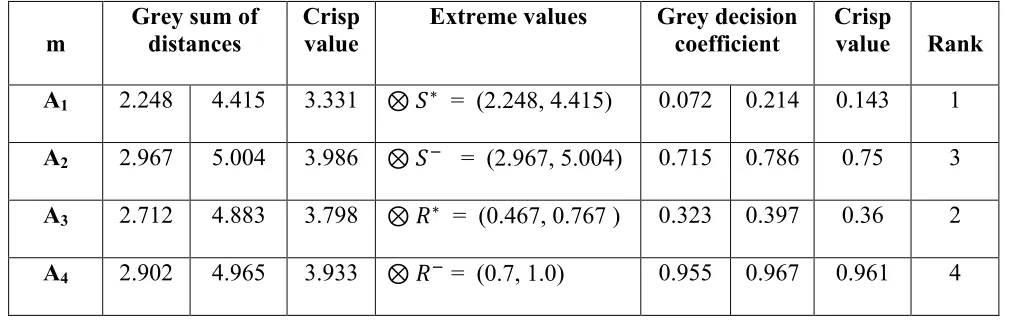
The grey VIKOR methodology is applied to the linguistic valuations available in Tables 11 and 12. The grey best value and grey worst value for the twelve criteria used are calculated using Equations (17) and (18) respectively. Using Equations (19) - (25), ⊗ 𝑆#, ⊗ 𝑅# , ⊗ 𝑆∗, ⊗ 𝑆& ,⊗
𝑅∗, ⊗ 𝑅& and ⊗ 𝑄
# values are calculated and are shown in Table 14. From the grey values of
⊗ 𝑆#and ⊗ 𝑄#, the equivalent crisp values are found out and are shown in Table 14. Based on the Qi values, it can be concluded that A1 emerges as the best ranked firm. Since m = 4, DQ value is 0.25. So, the best ranked firm does not enjoy acceptable advantage. Hence, a set of compromise solutions is proposed. It consists of three firms, A1 followed by A3 and A2.
7. Conclusion
Environmental management has become a vital issue for organisations as the emphasis on the environmental protection by organizational stakeholders, including stockholders, governments, customers, employees, competitors and communities keeps increasing. Programs such as design for the environment, life cycle analysis, total quality environmental management, green supply chain management and ISO 14000 standards have become widely practiced environmentally conscious practices. Both proactive and reactive methods have been implemented to protect the environment. With increasing government regulation and stronger public awareness in environmental protection, firms today simply cannot ignore environmental issues if they want to survive in the global market. In addition to complying with the environmental regulations for selling products and services in certain countries, firms need to implement strategies to voluntarily reduce the environmental impacts of their products and services. The integration of environment, economic and social performances to achieve sustainable development is a major business challenge for the new century.
With the growing awareness of environmental issues globally, governments and industry have recognized that they have vital roles in supporting and assuring sustainable development. For governments, laws and regulations have been issued to reduce and control greenhouse emissions, energy consumption, and environmental pollutions, etc. For industry, corporations are under tremendous pressure to comply with corporate social responsibility (CSR) requirements and to integrate environmental and social concerns in all spheres of activities. In consideration of the environmental concerns, companies worldwide have begun to adopt green supply chain management practices.
As Garvin (1993) said ‘‘If you cannot measure it, you cannot manage it’’, performance evaluation is an important part of the strategic management system of organizations as it affects the dynamics of the entire system. Performance evaluation in organizations serves the purposes of monitoring performance, identifying the areas that need attention, enhancing motivation, improving communications and strengthening accountability. GSCM performance evaluation that merely considers the initial inputs and the final outputs is in general insufficient since it ignores the relations among the divisions.
by the committee of experts constituted for the purpose. Environmental performance of four medical support service providers were evaluated by employing the proposed framework and the ranking list based on their environmental performance was obtained.
In the second case study, appropriate metrics for evaluating the environmental performance of catering service providing firms were identified by the committee of experts constituted for the purpose. Environmental performance of four catering service providers providing catering service to educational institutions in a city in south India were evaluated by employing the proposed framework and the ranking list based on their environmental performance was obtained. Organizations operating in the services sector can thus carry out the analysis of environmental performance of different member firms of supply chains employed by them and get a ranking list of the firms using the proposed framework. The framework can also be made use of, for analyzing the environmental performance of new members of supply chains before they are incorporated as part of the supply chains.
As with any methodology, the proposed framework has a few limitations. Practicing managers need to be exposed and trained to apply the mathematical techniques involved. A comparative evaluation of the environmental performance of the different supply chain members can be carried out. However the absolute scores of the environmental performance of the member firms cannot be obtained. The environmental performance evaluation exercise by employing the proposed framework will be able to bring about the real picture in the supply chains only if experienced and competent people are appointed to the committee of decision makers. Lack of consensus opinion while gathering the criteria for evaluation can delay the speedy implementation of the methodologies proposed. There is a need that more academicians and practicing managers devote their attention towards developing appropriate metrics and methodologies for analyzing environmental performance of supply chains belonging to different sectors of services.
Acknowledgement
The authors wish to thank the two anonymous reviewers for their excellent and insightful comments. We are sure that the readability of our paper has improved considerably after carrying out these modifications. In addition to reviewers, we sincerely thank special editors for their continuous encouragement and support.
References:
Aiello, G., Enea, M., Galante, G., 2006. A multi objective approach to facility layout problem by genetic search algorithm and Electre method. Robotics and Computer Integrated Manufacturing 22(5&6), 447 - 455.
Bai, C., Sarkis, J., 2010a. Green supplier development: analytical evaluation using rough set theory. Journal of Cleaner Production 18(12), 1200 - 1210.
Bai. C., Sarkis, J., 2010b. Integrating sustainability into supplier selection with grey system and rough set methodologies. International Journal of Production Economics 124 (1), 252 - 264. Bala, A., Paco Munoz, P., Rieradevall, J., Ysern, P., 2008. Experiences with greening suppliers. The UniversitatAutònoma de Barcelona. Journal of Cleaner Production 16 (15), 1610 – 1619. Baskaran, V., Nachiappan, S., Rahman, S., 2012. Indian textile suppliers' sustainability evaluation using the grey approach. International Journal of Production Economics 135 (2), 647 - 658.
Basu, R., Wright, J.N., 2008. Total supply chain management. London: Butterworth Heinemann. Bhattacharya, A., Geraghty, J., Young, P., 2010. Supplier selection paradigm: An integrated hierarchical QFD methodology under multiple criteria environment. Applied Soft Computing 10(4), 1013 - 1027.
Bhattacharya, A., Mohapatra, P., Kumar, V., Dey, P.K., Brady, M., Tiwari M.K., Nudurupati, S.S., 2014. Green supply chain performance measurement using fuzzy ANP based balanced scorecard: a collaborative decision making approach. Production Planning & Control: The Management of Operations 25(8), 698-714.
Bose, I., Pal, R., 2012. Do green supply chain management initiatives impact stock prices of firms?. Decision Support Systems 52 (3), 624–634.
Britto, A.J., Almeida, A.T., Mota, C.M.M., 2010. A multicriteria model for risk sorting of natural gas pipelines based on ELECTRE TRI integrating Utility Theory. European Journal of Operations Research 200(3), 812 - 821.
Buyukozkan, G., Cifci, G., 2011. A novel fuzzy multi criteria decision framework for sustainable supplier selection with incomplete information. Computers in Industry 62(2), 164 – 174.
Buyukozkan, C., Cifci, G., 2012a. A novel hybrid MCDM approach based on fuzzy DEMATEL, fuzzy ANP and fuzzy TOPSIS to evaluate green suppliers. Expert Systems with Applications 39(3), 3000 - 3011.
Buyukozkan, G., Çifci, G., 2012b. Evaluation of the green supply chain management practices: a fuzzy ANP approach. Production Planning & Control 23(6), 405 – 418.
Chai, J., Liu, J.N.K., Ngai, E.W.T., 2013. Application of decision making techniques in supplier selection: A systematic review of literature. Expert Systems with Applications, 40(10), 3872 – 3885.
Chen, C.C., Tseng, M.L., Lin, Y.H., Lin, Z.S., 2010. Implementation of green supply chain management in uncertainty. In: International Conference on IEEM, IEEE 7 - 10 Dec, 260 - 264. Chen,W.H., 2005. Distribution system restoration using hybrid fuzzy grey method, IEEE Transactions on Power Systems 20, 199 - 205.
Chiou, C.Y., Hsu, C.W., Hwang, W.Y., 2008. Comparative investigation on green supplier selection of the American, Japanese and Taiwanese electronics industry in China. In: International Conference on IE&EM, IEEE 8 - 11 Dec, 1909 -1914.
Chiou, T.Y., Chan, H.K., Lettice, F., Chung, S.H., 2011. The influence of greening the suppliers and green innovation on environmental performance and competitive advantage in Taiwan. Transportation Research, Part E 47(6), 822 - 836.
De Almeida, A.T., 2007. Multicriteria decision model for outsourcing contracts selection based on utility function and ELECTRE method. Computers & Operations Research 34(12), 3569 - 3574.
De Brito, M.P., Carbose, V., Blanquart, C.M., 2008. Towards a sustainable fashion retail supply chain in Europe: Organisation and performance, International Journal of Production Economics 114(2), 534-553.
Deng, J.L., 1988. The basic methods of grey system. Wuhan: Huazhong University of Technology Press.
Deng, J.L., 1989. Introduction to grey system.The Journal of Grey system (UK) 1(1), 1 - 24. Deng, J.L., 2002. Grey system theory. Huazhong University of Science and Technology Press. Diabat, A,, Govindan, K., 2011. An analysis of the drivers affecting the implementation of green supply chain management. Resources Conservation and Recycling 55(6), 659 - 667.
Diabat, A., Khodaverdi, R., Olfat, L., 2013. An exploration of green supply chain practices and performances in an automotive industry. International Journal of Advanced Manufacturing Technology 68(1-4), 949 - 961.
Eltayeb, T.K., Zailani, S., Ramayah, T., 2011. Green supply chain initiatives among certified companies in Malaysia and environmental sustainability: investigating the outcomes. Resources Conservation and Recycling 55(5), 495 - 506.
Feyziogelu, O., Buyukozkan, G., 2010. Evaluation of green suppliers considering decision criteria dependencies. In: Lecture Notes in Economics and Mathematical Systems 1, 634, Multiple Criteria Decision Making for Sustainable Energy and Transportation Systems, Part 2, 145 - 154.
Garvin, D.A., 1993. Building a learning organization. Harvard Business Review 71 (4), 78 - 81. Georgiadis, P., Besiou, M., 2010. Environmental and economical sustainability of WEEE closed-loop supply chains with recycling: a system dynamics analysis. International Journal of Advanced Manufacturing Technology 47(5-8), 475–493.
Giannoulis, C., Ishizaka, A., 2010. A Web-based decision support system with Electre III for a personalised ranking of British universities. Decision Support Systems 48 (3), 488 - 497.
Gimenez, C., Sierra, V., Rodon, J., 2012. Sustainable operations: Their impact on the triple bottom line. International Journal of Production Economics 140(1), 149 - 159.
Govindan, K., Kalian, M., Kannan, D., Haq, A.N., 2014. Barriers analysis for green supply chain management implementation in Indian industries using analytic hierarchy process. International Journal of Production Economics 147(B), 555 - 568.
Govindan, K., Rajendran, S., Sarkis, J., Murugesan, P., 2013. Multi criteria decision making approaches for green supplier evaluation and selection; a literature review. Journal of Cleaner Production, doi:10.1016/j.jclepro.2013.06.046
Grisi, R.M., Guerra, L., Naviglio, G., 2010. Supplier performance evaluation for green supply chain management. Business Performance Measurement and Management, Part 4, 149 - 163. Handfield, R.B., Walton, S.V., Seegers, L.K., Melnyk, S. A., 1997. Green value chain practices in the furniture industry. Journal of Operations Management 15(4), 293 – 315.
Handfield, R., Walton, S.V., Sroufe, R., Melnyk, S.A., 2002. Applying environmental criteria to supplier assessment: a study in the application of the analytical hierarchy process. European Journal of Operational Research 141(1), 70 - 87.
Hassini, E., Surti, C., Searcy, C., 2012. A literature review and a case study of sustainable supply chains with a focus on metrics. International Journal of Production Economics 140(1), 69-82. Hong-Jun, L., Bin, L., 2010. A research on supplier assessment indices system of green purchasing. In: International Conference on ICEE, IEEE 13-14 March, 314 - 317.
Hsu, C.W., Hu, A.H., 2009. Applying hazardous substance management to supplier selection using analytic network process. Journal of Cleaner Production 17(2), 255 - 264.
Huang, B., Wang, T., Xue, X., 2012. Service selecting approach based on domain specified quality of service model and its application in logistics. The Service Industries Journal 32(9), 1571-1588.
Humphreys, P.K., McIvor, R., Chan, F.T.S., 2003a. Using case based reasoning to evaluate supplier environmental management performance. Expert Systems with Applications 25(2), 141 - 153.
Humphreys, P.K., Wong, Y.K., Chan, F.T.S., 2003b. Integrating environmental criteriainto the supplier selection process. Journal of Materials Processing Technology138(1-3), 349 - 356. Humphreys, P., McCloskey, A., McIvor, R., Maguire, L., Glackin, C., 2006. Employing dynamic fuzzy membership functions to assess environmental performance in the supplier selection process. International Journal of Production Research 44 (12), 2379 - 2419.
Jahan, A., Mustafa, F., Ismail, M.Y., Sapuan, S.M., 2011. A comprehensive VIKOR method for material selection. Materials &Design 32(3), 1215 - 1221.
Jain, V., Wadhwa, S., Deshmukh, S.G., 2009. Select supplier related issues in modelling a dynamic supply chain: potential, challenges and direction for future research. International Journal of Production Research 47(11), 3013-3039.
Kumar, A., Jain, V., 2010. Supplier selection: a green approach with carbon footprint monitoring. In: International Conference on SCMIS, IEEE 6-9 Oct, 1 - 9.
Kumaraswamy, A.H., Bhattacharya, A., Kumar,V., Brady, M., 2011. An integrated QFD-TOPSIS methodology for supplier selection in SMEs. Proceedings of the Third International Conference on Computational Intelligence, Modelling and Simulation (CIMSiM), 20-22 Sept., Langkawi, 271 – 276.
Kung, C.Y., Wen, K.L., 2007. Applying Grey Relational Analysis and Grey Decision-Making to evaluate the relationship between company attributes and its financial performance - A case study of venture capital enterprises in Taiwan. Decision Support Systems 43 (3), 842 - 852. Kuo, M.S., Liang, G.S., 2011. Combining VIKOR with GRA techniques to evaluate service quality of airports under fuzzy environment. Expert Systems with Applications 38(3), 1304-1312.
Kuo, R.J., Lin, Y.J., 2011. Supplier selection using analytic network process and data envelopment analysis. International Journal of Production Research 50(11), 2852 - 2863. Kuo, R.J., Wang, Y.C., Tien, F.C., 2010. Integration of artificial neural network and MADA methods for green supplier selection. Journal of Cleaner Production 18(12), 1161 - 1170.
Large, R.O., Thomsen, C.G., 2011. Drivers of green supply management performance: evidence from Germany. Journal of Purchasing and Supply Management 17 (3), 176 - 184.
Lee, H.I., Kang, H.Y., Hsu, C. F., Hung, H.C., 2009. A green supplier selection model for high tech industry. Expert Systems with Applications 36(4), 7917 - 7927.
Li, X., Zhao, C., 2009. Selection of suppliers of vehicle components based on green supply chain. In: International Conference on IE&EM, IEEE 21-23, Oct, 1588 - 1591.
Lin, C.T., Chang, C.W., Chen, C.B., 2006. The worst ill conditioned silicon wafer slicing machine detected by using grey relational analysis. International Journal of Advanced Manufacturing Technology 31(3-4), 388 - 395.
Lin, R.J., 2013. Using fuzzy DEMATEL to evaluate the green supply chain management practices. Journal of Cleaner Production 40, 32 - 39.
Liou, J.J.H., Tsai, C.Y., Lin,R.H., Tzeng, G.H., 2011. A modified VIKOR multiple criteria decision method for improving domestic airlines service quality. Journal of Air Transport Management 17(2), 57 - 61.
Liu, P. and Zhang, X., 2011. Research on the supplier selection of a supply chain based on entropy weight and improved ELECTRE-III method. International Journal of Production Research 49(3), 637-646.
Mathur, V., Dwivedi, S., Hassan, M.A., Misra, R.P., 2011. Knowledge, attitude and practices about bio medical waste management among healthcare personnel: A cross sectional study. Indian Journal of Community Medicine 36(2), 143 - 145.
Min, H., Kim, I., 2012. Green supply chain research: past, present, and future. Logistics Research 4(1-2), 39 - 47.
Mirhedayatian, S.M., Azadi, M., Saen, R.F., 2014. A novel network data envelopment analysis model for evaluating green supply chain management. International Journal of Production Economics 147(B), 544 - 554.
Montazer, G.A., Saremi, H.Q.,Ramezani, M., 2009. Design a new mixed expert decision aiding system using fuzzy ELECTRE III method for vendor selection. Expert Systems with Applications 36(8), 10837–10847.
Noci, G., 1997. Designing ‘Green’ vendor rating systems for the assessment of a supplier’s environmental performance. European Journal of Purchasing and Supply Management 3(2), 103 - 114.
Olson, D.L., Wu, D., 2006. Simulation of fuzzy multi attribute models for grey relationships, European Journal of Operations Research 175(2), 111 - 120.
Opricovic, S., 2011. Fuzzy VIKOR with an application to water resources planning. Expert Systems with Applications 38(10), 12983 - 12990.
Opricovic, S., Tzeng, G.H., 2004. Compromise solution by MCDM methods: A comparative analysis of VIKOR and TOPSIS. European Journal of Operations Research 156(2), 445-455. Opricovic, S., Tzeng, G.H., 2002. Multicriteria planning of post earthquake sustainable reconstruction. Computer Aided Civil and Infrastructure Engineering 17(3), 211-220.
Ozcan, T., Celebi, N., Esnaf, S., 2011. Comparative analysis of multi-criteria decision making methodologies and implementation of a warehouse location selection problem. Expert Systems with Applications 38(8), 9773 - 9779.
OuYeng, Y.P., Shieh, H.M., Leu, J.D., Tzeng, G.H., 2009. A VIKOR based multiple criteria decision method for improving information security risk. International Journal of Information Technology & Decision Making 8(2), 267 - 288.
Papadopoulos, A., Karagiannidis, A., 2008. Application of the multi criteria analysis method Electre III for the optimisation of decentralised energy systems. Omega 36(5), 766 - 776.
Pirraglia, A., Saloni, D.E., 2012. Measuring environmental improvements image in companies implementing green manufacturing by means of a fuzzy logic model for decision making purposes. International Journal of Advanced Manufacturing Technology 61(5–8), 703–711. Rezaei, J., Fahim, P.B.M., Tavasszy, L., 2014. Supplier selection in the airline retail industry using a funnel methodology: Conjunctive screening method and fuzzy AHP. Expert Systems with Applications 41(18), 8165 – 8179.
Roy, B., 1973. How outranking relation helps multiple criteria decision making. In: Cochrane, J., Zeleny, M. (Eds.), Topics in Multiple Criteria Decision Making. University of South Carolina Press, Columbia, 179 - 201.
San Cristobal, J.R., 2011. Multi criteria decision making in the selection of a renewable energy project in Spain: The Vikor method. Renewable Energy 36(2), 498 - 502.
Seuring, S., Sarkis, J., Muller, M., Rao, P., 2008. Sustainability and supply chain management - an introduction to the special issue. Journal of Cleaner Production 16(15), 1545 - 1551.
Sevkli, M., 2010. An application of the fuzzy ELECTRE method for supplier selection. International Journal of Production Research 48(12), 3393-3405.
Shang, K.C., Lu, C.S., Li, S., 2010. A taxonomy of green supply chain management capability among electronic related manufacturing firms in Taiwan. Journal of Environmental Management 91(5), 1218 - 1226.
Shanian, A., Savadogo, O., 2006. A material selection model based on the concept of multiple attribute decision making. Materials and Design 27(4), 329 - 337.
Shen, L., Olfat, L., Govindan, K., Khodaverdi, R., Diabat, A., 2013. A fuzzy multi criteria approach for evaluating green supplier’s performance in green supply chain with linguistic preferences. Resources, Conservation and Recycling 74, 170 - 179.
Thongchattu, C., Siripokapirom, S., 2010. Green supplier selection consensus by neural network. In: International Conference on ICMEE, IEEE 1-3 Aug, 313 - 316.
Tseng, M.L., 2010. Using linguistic preferences and grey relational analysis to evaluate the environmental knowledge management capacities. Expert Systems with Applications 37(1), 70-81.
Tseng, M.L., 2011. Green supply chain management with linguistic preferences and incomplete information. Applied Soft Computing 11(8), 4894–4903.
Tseng, Y.J.Y.F.Y., Huang, F.Y., 2011. A green assembly sequence planning model with a closed-loop assembly and disassembly sequence planning using a particle swarm optimization method. International Journal of Advanced Manufacturing Technology 57(9–12), 1183–1197. Tseng, M. L., Chiu, A.S.F., 2013. Evaluating firm’s green supply chain management in linguistic preferences. Journal of Cleaner Production 40, 22–31.
Tuzkaya, G., Ozgen, A., Ozgen, D., Tuzkaya, U.R., 2009. Environmental performance evaluation of suppliers: A hybrid fuzzy multi criteria decision approach. International Journal of Environmental Science and Technology 6(3), 477 - 490.
Vachon, S., Klassen, R.D., 2006. Green project partnership in the supply chain: the case of the package printing industry. Journal of Cleaner Production 14(6-7), 661 - 671.
Wen, U.P., Chi, J.M., 2010. Developing green supplier selection procedure: a DEA approach. In: International Conference on IE&EM, IEEE 29-31 Oct, 79 - 74.
Wu, H.H., 2002. A comparative study of using grey relational analysis in multiple attribute decision making problems, Quality Engineering 15(2), 209 - 217.
Xiao, X., 2006. Green supply chain management in the UK and China construction industry, Master thesis, School of Environmental Sciences, University of East Anglia.
Yan, G., 2009. Research on green suppliers’ evaluation based on AHP & genetic algorithm International Conference on SPS, IEEE 15-17 May, 615 - 619.
Yang, C.C., Chen, B.S., 2006. Supplier selection using combined analytical hierarchy process and grey relational analysis. Journal of Manufacturing Technology Management 17(7), 926 - 941.
Yang, Y., Wu, L., 2008. Extension method for green supplier selection. In: International Conference on WiCom, IEEE 12 – 14, Oct, 1 - 4.
Yeh, W.C., Chuang, M.C., 2011. Using multi objective genetic algorithm for partner selection in green supply chain problems. Expert Systems with Applications 38(4), 4244 - 4253.
Yin, R., 1984. Case study research: Design and methods. Sage publications. Beverly Hills, California.
Yu, C., Wong, T.N., 2014. A supplier pre-selection model for multiple products with synergy effect. International Journal of Production Research 52(17), 5206-5222.
Zarandi, M. H. F., Mansour, S., Hosseinijou, S. A., Avazbeigi, M., 2011. A material selection methodology and expert system for sustainable product design. International Journal of Advanced Manufacturing Technology 57(9–12), 885–903.
Zhang, H.C., Li, J.,Merchant, M.E., 2003. Using fuzzy multi-agent decision-making inenvironmentally conscious supplier management. CIRP Annals – Manufacturing Technology 52(1), 385 - 388.
Zhu, Q., Sarkis, J., 2006. An intersectoral comparison of green supply chain management in China: drivers and practices. Journal of Cleaner Production 14(5), 472 - 486.
Zhu, Q., Sarkis, J., Lai, K., 2007a. Green supply chain management: pressures, practices and performance within Chinese automobile industry. Journal of Cleaner Production 15(11-12), 1041–1052.
Zhu, Q., Sarkis, J., Lai, K. 2008a. Green supply chain management implications for closing the loop. Transportation Part E: Logistics and Transportation Review 44(1), 1–18.
[image:24.612.68.546.241.723.2]Zhu, Q., Sarkis, J., Cordeiro, J., Lai, K. L., 2008b. Firm level correlates of emergent green supply chain management practices in the Chinese context. Omega 36(4), 577–591.
Table 1 Evaluation criteria for environmental performance
Criteria Authors
Adherence to environmental
policies Awasthi et al. (2010)
Air pollution treatment cost Yeh and Chuang (2011) Alternative green supply chain
systems, projects, practices, etc. Buyukozkan and Cifci (2011, 2012b) Carbon footprint Kumar and Jain (2010)
Cleaner production Chen et al. (2010) Compliance to Government
regulations. Handfield et al. (2002)
Current environmental efficiency Noci (1997); Grisi et al. (2010)
Design for environment Humphreys et al. (2003a, b), Humphreys et al. (2006), Awasthi et al. (2010)
Ecodesign Hong-jun and Bin (2010)
Energy conservation Lu et al. (2007), Shen et al. (2013)
Environment management system Noci (1997), Zhang et al., (2003), Humphreys et al.,(2003a, b), Humphreys et al. (2006), Chiou et al. (2008), Li and Zhao (2009), Yan (2009),Lee et al. (2009), Tuzkaya et al. (2009), Chen et al. (2010), Grisi et al. (2010), Kuo et al. (2010), Shang et al. (2010),Thongchattu and Siripokapiram (2010), Shen et al. (2013)
Environment protection Yang and Wu (2008)
Environmental authentication Awasthi et al. (2010), Hong-jun and Bin (2010) Environmental commitment Large and Thomsen (2011)
Environmental competences Humphreys et al., (2003a, b), Humphreys et al. (2006), Grisi et al. (2010)
Environmental performance Chiou et al. (2008), Chiou et al. (2011), Feyzioglu and Buyukozkan (2010), Large and Thomsen (2011) Environmental programs
at the supplier’s facilities
Handfield et al. (2002)
Environmental improvement costs Humphreys et al., (2003a, b), Humphreys et al. (2006), Tuzkaya et al. (2009), Kuo et al. (2010)
Green collaboration with suppliers Large and Thomsen (2011)
Green certification Awasthi et al. (2010), Tseng (2011)
Green competencies Noci (1997), Humphreys et al. (2003a,b), Chiou et al. (2008), Lee et al. (2009),
Green design Chen et al. (2010)
Green image Noci (1997),Humphreys et al., (2003a, b), Humphreys et al. (2006),Lee et al. (2009), Tuzkaya et al. (2009), Grisi et al. (2010),Shen et al. (2013),
Green knowledge transfer Bai and Sarkis (2010a)
Green logistics dimension Buyukozkan and Cifci (2011, 2012b) Green management system Wen and Chi (2010)
Green managerial innovation Chiou et al. (2011) Green market share Awasthi et al. (2010) Green organizational activities
dimension
Buyukozkan and Cifci (2011, 2012b)
Green process Hsu and Hu (2009), Tuzkaya et al. (2009), Tseng (2011) Green process innovation Chiou et al. (2011)
Green product Noci (1997), Humphreys et al. (2003a,b), Lee et al. (2009), Tuzkaya et al. (2009), Kuo et al. (2010), Shang et
al.(2010), Tseng (2011), Shen et al. (2013) Green product innovation Chiou et al. (2011)
Green projects partnership Vachon and Klassen (2006)
Green purchasing Lu et al. (2007), Hsu and Hu (2009), Chen et al. (2010), Shang et al. (2010), Tseng (2011), Shen et al. (2013) Green R & D Projects Awasthi et al. (2010)
Green supplier assessment Large and Thomsen (2011) Greening the supplier Chiou et al. (2011)
Management support Humphreys et al. (2003a,b), Hsu and Hu (2009), Awasthi et al. (2010), Kuo et al. (2010), Tseng (2011), Shen et al. (2013)
Internal green production plan Chen et al. (2010) Partnership with green
organization Awasthi et al. (2010)
Pollution control Lee et al. (2009), Tuzkaya et al. (2009), Tseng (2011), Shen et al. (2013)
Pollution control initiatives Awasthi et al. (2010) Purchasing’s environmental
capabilities
Large and Thomsen (2011)
R&D green products Chen et al. (2010) Regulatory conformance Tuzkaya et al. (2009)
Recycle Bala et. al (2008)
Reuse Bala et. al (2008)
Social responsibility & environmental competencies
Buyukozkan and Cifci (2011, 2012b)
Staff environmental training Awasthi et al. (2010), Shen et al. (2013) Use of environmental friendly
materials Awasthi et al. (2010)
Use of environment friendly
[image:26.612.71.548.75.160.2]technology Lu et al. (2007), Hsu and Hu (2009), Lee et al. (2009), Awasthi et al. (2010), Tseng (2011), Shen et al. (2013) Waste management Handfield et al. (2002)
Table 2
Definitions of linguistic variables for importance of criteria and for the ratings of firms For the importance of criteria For the ratings of firms
Linguistic Variables Grey numbers Linguistic Variables Grey numbers
Very Low (VL) (0.0, 0.3) Very Poor (VP) (0, 3)
Low (L) (0.1, 0.5) Poor (P) (1, 5)
Medium (M) (0.3, 0.7) Fair (F) (3, 7)
High(H) (0.5, 0.9) Good(G) (5, 9)
[image:26.612.68.552.230.349.2]Very High (VH) (0.7, 1.0) Very Good (VG) (7, 10)
Table 3
MSSPs: Linguistic assessments for the 8 criteria
Criteria Decision Makers
D1 D2 D3 D4
C1 M VH H VH
C2 L H M H
C3 M L M H
C4 H VH VH H
C5 L VL VL L
C6 M L L M
C7 H M M VH
C8 L M L L
Table 4
MSSPs: Linguistic assessments for the four alternatives
Criteria
Alternatives
MSSP1 MSSP2 MSSP3 MSSP4
D1 D2 D3 D3 D1 D2 D3 D4 D1 D2 D3 D4 D1 D2 D3 D4
[image:26.612.67.547.423.570.2]C2 F F P F F G G G P P VP F G F F P
C3 G F P F F P P F P F P P P VP VP F
C4 G F F G VG G VG G F
PP
P F P G G VG G
C5 G G F G F F P F F G F G F P P F
C6 G G G G VG VG G VG F G F G G G VG G
C7 F G F F G F G G P F P F F G F F
[image:27.612.69.547.73.178.2]C8 F P P F VG G G VG F P VP P G G F G
Table 5
MSSPs:The global matrix G
m MSSP1 MSSP2 MSSP3 MSSP4
MSSP1 - 0 1 1
MSSP2 1 - 1 1
MSSP3 0 0 - 0
MSSP4 0 0 1 -
Table 6
[image:27.612.70.550.250.324.2]MSSPs: Sum of distances, decision coefficients and ranks of the firms
Table 7
CSPs: Linguistic assessments for the 7 criteria
Criteria Decision Makers
D1 D2 D3 D4
C1 VH H VH H
C2 M L M L
C3 H VH H VH
C4 H M VH M
C5 VH H VH VH
C6 M VH H M
C7 VH M VH VH
m Grey sum of
[image:27.612.71.548.583.718.2]Table 8
CSPs: Linguistic assessments for the four alternatives
Criteria
Alternatives
CSP1 CSP2 CSP3 CSP4
D1 D2 D3 D3 D1 D2 D3 D4 D1 D2 D3 D4 D1 D2 D3 D4
C1 F P P VP G F F G G G VG VG F F P P
C2 F G P G P P G P F P F P G F P G
C3 P VP F VP G F F F G VG G G P P F P
C4 P P P P VG F VG G F VG F G P F F P
C5 P VP F P G F F G G F G G F P F P
C6 F F P F G F F F F G G F F P F F
[image:28.612.62.549.461.535.2]C7 P F VP VP G G F G G VG F VG P F P P
Table 9
CSPs: The global matrix G
m CSP1 CSP2 CSP3 CSP4
CSP1 - 0 0 0
CSP2 1 - 0 1
CSP3 1 1 - 1
CSP4 1 0 0 -
Table 10
CSPs: Sum of distances, decision coefficients and ranks of the firms
m Grey sum of
[image:28.612.59.555.617.713.2]Table 11
Logistics Project: Linguistic assessments for the 12 criteria Source: Awasthi et al. (2010)
Criteria
Decision Makers
D1 D2 D3
C1 H H M
C2 L VH L
C3 M VH VH
C4 VH VH VH
C5 VL VH M
C6 H M VH
C7 H M M
C8 L VH H
C9 VL M VH
C10 M VH VH
C11 VL L L
[image:29.612.68.549.266.478.2]C12 VH VL VH
Table 12
Logistics Project: Linguistic assessments for the four alternatives Source: Awasthi et al. (2010)
Criteria
Alternatives
A1 A2 A3 A4
D1 D2 D3 D1 D2 D3 D1 D2 D3 D1 D2 D3
C1 P F P VP F VG VG G VG VP VG VG
C2 VG VG G VG F P P VP G VG P F
C3 F G VG VP P P P P G VG G F
C4 P VG VG G F VP G F VG VP VP VP
C5 F G VG P P VG VP VP VP F VP P
[image:29.612.68.548.572.716.2]C6 P VP F G F VP VG F F P VP F
C7 VP G F VG VP VG G VP VG VG P P
C8 VP VP G G VG VG F VG VP G G VP
C9 F VG F VP P VG F F VP P VG VG
C10 G G VG F VP F F G VP P G P
C11 P VG VP G G G F F G G F G
[image:30.612.69.547.73.176.2]C12 G P VG G G F F P VG VG VG VG
Table 13
Logistics Project: The global matrix G
m A1 A2 A3 A4
A1 - 1 1 1
A2 0 - 0 1
A3 0 0 - 0
[image:30.612.54.560.438.599.2]A4 0 0 0 -
Table 14
Logistics Project: Sum of distances, decision coefficients and ranks of the firms
Appendix – A: Grey Arithmetic
Let X be the universal set. A grey set G of X is defined by its two mappings .
m Grey sum of distances Crisp value Extreme values Grey decision coefficient Crisp value Rank
A1 2.248 4.415 3.331 ⊗ 𝑆∗ = (2.248, 4.415) 0.072 0.214 0.143 1
A2 2.967 5.004 3.986 ⊗ 𝑆& = (2.967, 5.004) 0.715 0.786 0.75 3
A3 2.712 4.883 3.798 ⊗ 𝑅∗ = (0.467, 0.767 ) 0.323 0.397 0.36 2
𝐺 = µµ, 𝑥 ∶ 𝑥 ⟶ 0 , 1
, 𝑥 ∶ 𝑥 ⟶ 0 , 1 ( 1 )
whereµ, 𝑥 ≥ µ, 𝑥 , 𝑥 𝜖 𝑋, 𝑋 = 𝑅
A grey number is one of which the exact value is unknown, while the upper and/or the lower limits can be estimated. Generally, grey number is written as ⊗ 𝑥, ⊗ 𝑥 = 𝑥 66 .
If only the lower limit of xcan be possibly estimated, x is defined as lower limit grey number and if only the upper limit of x can be estimated, x is defined as upper limit grey number. If the lower and upper limits of x can be estimated, xis defined as interval grey number.
The basic operation laws of grey numbers ⊗ 𝑥7 = 𝑥7 , 𝑥7 and ⊗ 𝑥8 = 𝑥8 , 𝑥8
are expressed as follows:
Addition: ⊗ 𝑥7 + ⊗ 𝑥8 = 𝑥7+ 𝑥8 , 𝑥7+ 𝑥8
Subtraction: ⊗ 𝑥7− ⊗ 𝑥8 = 𝑥7− 𝑥8 , 𝑥7 − 𝑥8
Multiplication: ⊗ 𝑥7 × ⊗ 𝑥8 = <=> ?@?A , ?@?A , ?@?A , ?@?A ,
<BC ?@?A , ?@?A , ?@?A , ?@?A
Division: ⊗ 𝑥7 ÷ ⊗ 𝑥8 = 𝑥7 , 𝑥7 × ?7
A ,
7 ?A
The Modowski space distance of two grey numbers ⊗ 𝑥7 and ⊗ 𝑥8 is defined as
𝐿 ⊗ 𝑥7, ⊗ 𝑥8 = (𝑥7− 𝑥8)𝒑 + ( 𝑥
7− 𝑥8)𝒑
𝟏 𝒑
Appendix –B: