Contents lists available atScienceDirect
Surface & Coatings Technology
journal homepage:www.elsevier.com/locate/surfcoat
Process parameter optimisation of laser clad iron based alloy: Predictive
models of deposition e
ffi
ciency, porosity and dilution
L. Reddy
a, S.P. Preston
b, P.H. Shipway
a, C. Davis
c, T. Hussain
a,⁎ aFaculty of Engineering, The University of Nottingham, University Park, Nottingham NG7 2RD, UK bSchool of Mathematics, The University of Nottingham, University Park, Nottingham NG7 2RD, UKcMaterials and Corrosion Team, Uniper Technologies Limited, Technology Centre, Ratcliffe on Soar, Nottingham NG11 0EE, UK
A R T I C L E I N F O
Keywords:
Process modelling NanoSteel Laser cladding Porosity Dilution Boiler coatings
A B S T R A C T
As a candidate coating material for heat-exchanger surfaces in commercial power generation boiler, an amor-phous/glass forming Fe-Cr-B alloy NanoSteel SHS 7170 was deposited by a 2 kWfibre laser onto a boiler grade steel substrate (15Mo3). A comprehensive trial with 28 single track optimisation runs was carried out to develop models of the influence of three processing parameters, laser power, laser traverse speed and powder feed rate, on powder deposition efficiency, dilution and porosity. It was found that deposition efficiency is dependent on laser power and powder feed rate, increasing with increasing power and decreasing powder feed rate when tested within the parameter window of laser power ranging from 0.4 to 2 kW; traverse speed varying from 150 to 1200 mm min‑1; and powder feed rate varying from 4 to 10 g min‑1. Similarly, it was found that dilution is also dependent on laser power and powder feed rate. Dilution increases with increasing power and decreases with increasing powder feed rate within the same parameter window discussed above. This means that through processing parameter selection, these properties can be adjusted to suit their application. Porosity was found to be independent of processing parameters and instead mostly dependent on the feedstock material. A model was produced for predicting porosity within a powder feedstock, found to be 8.5%. These models were used to successfully produce an optimised coating.
1. Introduction
The use of advanced coatings in industrial applications is both cri-tical and widespread. Coatings find many uses in industries varying from conventional power generation, renewable energy, oil and gas, automotive, aerospace, mining, iron and steel to outer space. Coatings can offer a low cost alternative to bulk material components, or can allow the advantages of two different materials with unique properties to be combined into a single unit. Candidate coating materials are often highly alloyed or contain exotic elements to provide specialised per-formance. Laser cladding is a weld type coating deposition technique in which a high energy laser is passed over the surface of a substrate, creating a meltpool. The cladding material, in the form of either powder or wire, if fed into this meltpool, forms a metallurgical bond once so-lidified.
As a technique that has wide spread usage, there is obviously in-terest in producing predictive models for the coating characteristics of laser cladding. There are three main properties that need to be con-sidered when producing coatings; the clad dimensions, dilution and porosity. Dilution is the mixing of the substrate material with the
coating material altering composition which could ultimately be dele-terious to performance. Attempts to model these properties, and others such as feed geometries and stand-offdistances have been carried out previously [1,2]. A popular technique used is linear regression through a trial and error approach. Whilst these techniques can agree on which parameters have an influence on coating deposition, they differ vastly in the influence these parameters play. Whilst these models may explain empirical results, [3] showed that the models vary vastly between coating and substrate materials, and even vary within the same mate-rials. The influence of traverse speed on clad height for example can range from v‑1to v‑5/4[4–6]. Other statistical empirical techniques have also been employed [7,8]. Analysis of variance (ANOVA) was used to model the deposition of a titanium alloy onto a substrate of the same composition [7]. The importance each variable plays in these models vary vastly from the models mentioned above. As well as these statis-tical models, theorestatis-tical models exist; these are primarily focused on laser processing technologies in a broader context, but obviously have applications for laser cladding [8].
The capture efficiency is simple to calculate empirically, however attempts to model the capture efficiency can be made through
https://doi.org/10.1016/j.surfcoat.2018.05.054
Received 22 December 2017; Received in revised form 1 May 2018; Accepted 26 May 2018
⁎Corresponding author.
E-mail address:[email protected](T. Hussain).
Available online 26 May 2018
consideration of energy balance. Previous work looking at the energy balance in laser processing has focused on its application in calculating melt depth and profile. Others have found application for the technique specifically in laser cladding and for calculating clad geometry in multi pass setups [9]. Another approach to predict capture efficiency is to look at powder feed geometry. Models have shown that beam diver-gence and variations in particle size will attenuate the beam by dif-fering amounts [10]. This differing energy can be taken into account when looking at energy balance models. As capture efficiency is a problem that will only affect powder fed laser cladding systems, not wire fed setups.
A breadth of dilution models draw on original mathematical work on laser hardening [11]. This work models heatflow within a substrate under Gaussian and non-Gaussian sources, and was later built on using classical heatflow equations in two dimensions using a rectangular source [12]. Whilst looking only at laser surface treatment and not specifically laser cladding, the numerical calculations were able to predict melt depth and heat affected zones. These numerical models have been built upon to further improve their applicability, such as by modifying the geometry of the laser source beam to more closely match different experimental setups, and moving the models from the numerical, to analytical regimes [8]. Others, using the same fundamental work with the classical heat flow equations have produced semi-empirical models to predict the melt profile of multi-pass laser processing techniques.
Mathematical porosity modelling looked at two types of porosity; inter-run porosity and porosity within the feedstock powder. Inter-run porosity occurs when a gap is formed between successive depositions in multi clad coatings. This problem occurs predominantly in wire fed systems. It has been shown that this type of porosity can be minimised by keeping the clad bead contact angle below a critical level, dependent on the other coating parameters [4]. The technique used in this work for calculating porosity involves estimating powder pore size. The problem of estimating true volume distributions from cross sectional images of discrete particles is well established. The basis of estimating volume of regular particles [13] was used to develop key models in estimating the weighted volume by mean bisector of randomly shaped particles [14]. These methods were used for biological measurement; however has found application across a range offields, including re-cently in grain size measurements.
In this work, single track trials of NanoSteel SHS 7170 were applied using a 2 kW fibre laser onto a carbon steel substrate. These were analysed using optical and scanning electron microscopy so that theo-retical-empirical models of the influence of key coating parameters (deposition efficiency, dilution and porosity) on thefinal clad can be produced. The aim of this work was to develop a mathematical model to optimise NanoSteel SHS 7170 coating that can also be translated to other materials without significant modification. The ultimate goal was to develop optimised overlap coatings with desired characteristics and performance.
2. Experimental method
2.1. Materials
The Fe-based alloy powder SHS 7170 (The NanoSteel Company Inc., RI, USA) was used as a feedstock. The composition was measured by X-ray Fluorescence (XRF), Inductively Coupled Plasma Mass Spectroscopy (ICP-MS), and combustion methods to be Cr 20.3, W 6.3, B 3.6, Mn 2.1, Mo 4.8, C 1.0, Si 1.6 and Fe Bal. (all in wt%) [15]. A 15Mo3 substrate was used which has the nominal composition Fe 98.3, Cr 0.2, W 0.1, Ni 0.1, Mn 0.4, Mo 0.3, C 0.2, Si 0.2 and Cu 0.2 (all in wt%) [16].
2.2. Powder size characterisation
The size distribution of the powder was measured using laser dif-fractometry in a Mastersizer 3000 (Malvern Instruments, UK). The powder had a supplier provided size fraction of +15–53μm. The Mastersizer measurement shows the feedstock had an average particle size of 28.2μm and 10% of particles were smaller than 17.6μm and 90% smaller than 45.3μm. This distribution is shown inFig. 1.
2.3. Laser cladding of coating
[image:2.595.140.457.53.292.2]spot size of 4 mm was achieved using a 20 mm defocus. The powder feed rate, table traverse speed and laser power were varied in different combinations to produce 28 unique coating parameters. These para-meters had power ranging from 0.4 to 2 kW; traverse speed varying from 150 to 1200 mm min‑1; and powder feed rate varying from 4 to 10 g min‑1.
Following the mathematical modelling, one set of optimum pro-cessing parameters was selected from this study to develop overlapping tracks. The optimum processing parameters were selected to produce a coating with properties ideal for use in high temperature corrosion applications. The performance of these coatings is studied elsewhere [17]. The same laser set up was used to deposit the NanoSteel SHS 7170 on to a 20 mm × 90 mm × 6 mm 15Mo3 substrate. The coating was produced by laying parallel overlapping beads. An overlap percentage of 60% was used, and successive tracks were all coated in the same direction, maintaining the front fed orientation of the laser.
2.4. Material characterisation
Cross-sections were cut of each of the coating parameter track
perpendicular to the direction of cladding using a SiC precision cutting saw. These sections were mounted in a conductive resin (Bakelite) then ground and polished to a 1μm diamond finish using standard me-tallographic preparation techniques. Micrographs were produced using an Eclipse LV100ND optical microscope with NIS elements D software (Nikon Metrology NV, UK). The image analysis software ImageJ (National Institutes of Health, MD) was used to analyse the micrographs tofind the cross-sectional area above the substrate, cross-sectional area below the substrate and the porosity fraction. The porosity in the powder was measured using the same preparation techniques and mi-croscope. ImageJ was again used to measure the particle and pore diameter for a sample of 200 particles. The optical techniques used for measuring porosity in the powder were also used to measure porosity in the coatings.
Scanning Electron Microscope (SEM) analysis was carried out on the polished cross sections of the overlapping tracks. An S-3400 N SEM (Hitachi High Technologies, IL, USA) was used in hi-vac mode with a 20 kV beam accelerating voltage. This was accompanied by Energy Dispersive X-ray (EDX) Spectrometry on an x-max 80 mm2spectrometer (Oxford Instruments, UK) to determine the elemental composition within the coating. Micrographs requiring topographical information were taken in Secondary Electron (SE) mode and those requiring ele-mental distribution were taken using Back Scattered Electron (BSE) mode.
3. Results and discussion
3.1. Powder characteristics
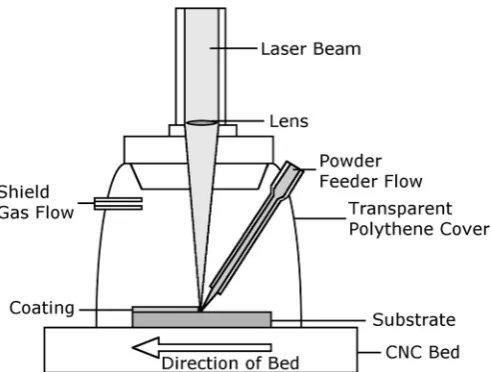
[image:3.595.41.287.54.240.2]BSE SEM images of the powder cross-section show different contrast regions within the particles. The bulk of the particles contain a dark chromium and boron rich dendrite phase within a lighter matrix. This region is clearly not amorphous. This can be seen in Fig. 3. The amorphous fraction measured in the XRD is likely to arise from the outer shell that has formed on some of the particles. These can be seen inFig. 3to be unstructured, and their morphology better seen inFig. 4. This is contrary to some previous research showing the amorphous fraction arises from the smaller size fraction of the particles [18].Fig. 3 shows that even the small particles are structured. The dark region in the centre ofFig. 3(a) is a pore formed during powder formation. Fig. 2.A schematic of the 2 kW Ytterbium doped fibre laser used at the
University of Nottingham in a front fed powder configuration. The laser beam, powder feed setup, substrate positioning and environmental chamber compo-nents are all shown.
[image:3.595.129.470.522.680.2]Parameters.
Symbol Definition Symbol Definition Ac Area of clad above
substrate
rs Laser spot radius Am Area of clad below
substrate
s Distance for pore to travel to surface Amax Max cross-sectional area
of clad
t Minimum time to escape
Aobs Observed cross-sectional area of clad
Tmelt(p) Melting temperature of powder
C(p) Specific heat of powder Tmelt(s) Melting temperature of substrate
C(s) Specific heat of substrate Troom Room temperature D Area dilution (fraction) v Traverse speed of laser
F Force vpore Velocity of rising pore
g Acceleration due to gravity
Vpore Volume of pore Lf(p) Latent heat of fusion of
powder
z Thickness
Lf(s) Latent heat of fusion of substrate
α Absorbance of powder
n Number of bins in z η Dynamic viscosity of molten powder P(r) Laser power incident on
substrate at melt radius
ηd Laser power dependent deposition efficiency
P0 Laser power ηi Laser power
independent deposition efficiency PFR Powder feed rate ηmelt Substrate melting
efficiency r Melt radius of laser spot μ Log-normal
distribution mean ro Observed radius of
powder particle
ρ(p) Powder density
rp True radius of powder particle
ρ(s) Substrate density
rpore Radius of pore within powder
σ2 Log-normal distribution variance
3.2. Microstructure of clads
The initial coating characterisation was carried out using optical microscopy of the cross-sections of the clad tracks to examine a larger
field of view. There were several key measurements taken to determine suitability of the clads. To achieve a good clad, a produced coating must be thick enough that it can provide sufficient protection. Whilst con-sidering this, a coating must also be as thin as possible whilst main-taining adequate protection to reduce weight and material costs. The measured thickness of the clads ranged from 129μm to 1554μm. The area above and below the clad was measured so that area dilution could be calculated from Eq.(1). The definitions of the cross-sectional areas above and below the substrate are defined schematically inFig. 5. This gave area dilutions ranging from 0% to 48% across the 28 trials per-formed. For a good clad, dilution must be high enough to allow for good metallurgical bonding of the coating, however low enough that mixing of substrate with coating is not deleterious to performance. Porosity can act as pathways between the external environment and the substrate which the coating is being applied too. As such porosity should be kept to a minimum. The measured porosity in the samples ranged from 1% to 8%.
= +
D A
A A
m
c m (1)
BSE micrographs of the clads revealed a similar internal structure across all of the clads. As well as the pores that were clearly visible in the optical micrographs such as inFig. 5, there is also some phase segregation that can be observed.
3.3. Processing parameter models
3.3.1. Deposition efficiency
[image:4.595.308.555.57.263.2] [image:4.595.309.556.501.698.2]By determining a model for the deposition efficiency of the laser cladding process, a calculation can be made to determine the amount of feedstock material lost. Knowing a model means that laser parameters can be modified to minimise this feedstock loss. Laser power in-dependent powder deposition efficiency is the deposition efficiency that is constant across all processing parameters. It can be calculated from the fed mass per unit length and cross-sectional area of the clad mea-sured above the substrate. This deposition efficiency is a ratio of the Fig. 4.SE micrograph of the morphology of NanoSteel SHS 7170 powder showing non-spherical morphologies.
mass of feedstock provided in a given length and the mass of powder incident on the clad in a given area. This can be seen in Eq.(2).
=
η A vρ
PFR i
obs ( )p
(2) From a plot of area against fed mass per unit length, as in Eq.(2), the deposition efficiency can be calculated. If it is assumed that de-position efficiency is dependent on the powder feed geometry and properties affecting the powder feed, such as its shape or density, is expected that deposition efficiency will be constant across all coating parameters as these factors remain constant. Conversely, if the powder feed setup were to change, for example through a change in feedstock material, feedstock manufacture or powder feed geometry, this de-position efficiency would need to be recalculated. This recalculated deposition efficiency will encompass the influence that these changed parameters such as feedstock material, feedstock manufacture or powder feed geometry have on the prediction. Taking the density to be 7650 kg m3[15], Fig. 6is produced from the 28 trial clad results. It shows the above assumption to be invalid, that deposition efficiency is not solely dependent on fed mass per unit length but that there is also a dependence on energy per unit length. The higher the energy per unit length, the greater the observed area for a given fed mass per unit length. The deposition efficiencies presented at the different energies per unit length are all forced through zero as this is physically sig-nificant. If there is zero fed mass per unit length then the observed cross sectional area will be zero.
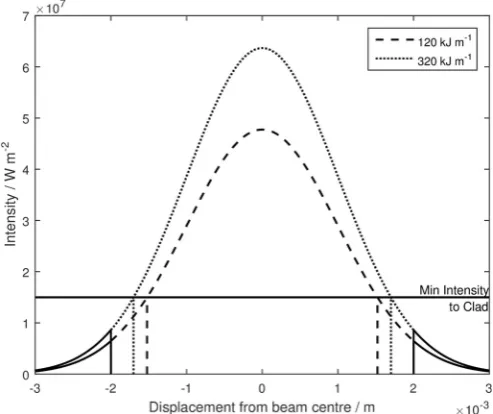
This difference in observed cross-sectional area at constant fed mass per unit length can be accounted for by assuming a Gaussian beam profile. A Gaussian distribution within the laser spot would produce a region at high radius within the laser beam spot that does not receive enough power to melt incoming powder. Increasing the energy per unit length will increase this melt radius taking it closer to the spot radius and therefore increasing the amount of powder that can be melted. Fig. 7is a visual representation of this.
Using knowledge of the intensity within a Gaussian power dis-tribution, Eq.(3), it can be shown through simple algebra that the melt radius is given by Eq.(4). Eq.(5)shows the minimum power required to melt the powder. The power dependent deposition efficiency shown in Eq.(6)can therefore be calculated as the ratio of the melt spot area to the laser spot area.
⎜ ⎟
= ⎛
⎝ − ⎞
⎠ P r
P exp
r r
( ) 2
s
0
2
2
(3)
⎜ ⎟
= ⎛
⎝ ⎞ ⎠
r r ln P
P r
2 ( )
s 0
(4)
= − +
P r( ) PFR C( ( )p(Tmelt p( ) Troom) Lf p( )) (5)
= ⎛ ⎝
⎜ − + ⎞
⎠ ⎟
η ln P
PFR C( (T T ) L )
d
p melt p room f p 0
( ) ( ) ( ) (6)
[image:5.595.42.287.55.254.2]Eq.(6)is true only under two conditions. Firstly, P0≥P(r). Below this limit, the efficiency is zero as no powder can be captured. Secondly, r≤r0. Beyond this point all powder can be melted and the efficiency is unity. This power dependent deposition efficiency can be used in a correction to Eq.(2). By considering the deposition efficiency to be a Fig. 6.Observed cross sectional area against fed mass per unit length showing
[image:5.595.309.556.58.265.2] [image:5.595.307.556.326.439.2]deposition efficiency at different energy per unit lengths (EL). Data points show experimental data and lines show bestfit for calculating deposition efficiency. These lines do notfit the data well. The R2value of the set is 0.92.
Fig. 7.Beam intensity through beam showing beam spot size with solid lines and melt spot size with broken lines at 120 kJ m−1and 320 kJ m−1. The ver-tical broken lines show the effective melt radius increasing as the energy per unit length is increased.
[image:5.595.308.556.510.707.2]product of the power dependent deposition efficiency and a power in-dependent deposition efficiency, Eq.(2)can be used to produce more accurate predictions. The power independent deposition efficiency ac-counts for factors such as reflectance of the powder and vaporisation of the melt. In this model it is calculated empirically from the measured data. Calculation of the power independent deposition efficiency can be seen in Fig. 8. The data used to calculate the power dependent de-position efficiency can be found inTable 1.
The thickness of clad required varies depending on application of thefinal coating. A thicker coating may be required to improve per-formance, or a thinner coating required for lower cost. However by increasing deposition efficiency, the amount of feedstock required to produce the desired thickness of coating can be decreased. This reduces wastage and therefor total overall material costs. It is discussed above that the power independent deposition efficiency is constant regardless of processing parameters. The power dependent deposition efficiency is maximum when the condition r≥rsis met. When this is combined with Eq.(4)and Eq.(5), the criteria for maximum clad efficiency are pro-duced as shown in Eq. (7). Deposition efficiency increases with in-creasing power and dein-creasing powder feed rate. When considering parameter selection, it must be noted that as power independent de-position efficiency is not affected by processing parameters, the pro-cessing parameters may not be able to be tailored to achieve 100% total deposition efficiency. This is of particular importance in industrial laser cladding systems with very high power (i.e. 20 kW), where power in-dependent deposition efficiency is likely to be maximised at all rea-sonable operating parameters through Eq.(7). This model is also re-levant within these high power industrial laser systems for feedstocks with very high melting temperatures. To achieve the greatest total deposition efficiency, power independent deposition must be max-imised, as in Eq.(7).
≥ − +
P0 PFRe C2( ( )p(Tmelt p( ) Troom) Lf p( )) (7)
3.3.2. Dilution
Area dilution can be calculated from knowledge of the cross-sec-tional area of the clad above and below the surface of the substrate [19]. In welding literature, Eq.(1)is well established for calculating the area dilution. In order to be able to predict the area dilution, it follows from Eq.(1)that we need to be able to predict the cross-sectional area of the clad above and below the surface of the substrate. The cross-sectional area above the substrate is straightforward to calculate from the assumptions used in calculating the deposition efficiency above. This can be seen in Eq.(8), a rearrangement of Eq.(2). The cross-sec-tional area of the clad below the substrate can be calculated simply from the energy per unit length incident on the substrate and the vo-lume of substrate material that energy per unit length is sufficient to melt. This is shown in Eq.(9)from the heat capacity equation. Thefinal addition to this prediction is that the energy per unit length reaching the substrate is the total energy per unit length provided by the laser minus the energy required to melt the clad material. This gives a more comprehensive prediction of the cross-sectional area below the sub-strate surface seen in Eq.(10).
=
A PFR
vρ η η c
p d i
( ) (8)
= ⎛ ⎝
⎞
⎠ +
A P
v ρ C T L
1
( Δ )
m
Substrate ( )s ( )s ( )s f s( ) (9)
= −
+ + A
ρ (C ΔT L )
m P
v
PFR C T L
v
s s s f
( Δ )
( ) ( ) ( ) p p f p
s
0 ( ) ( ) ( )
( ) (10)
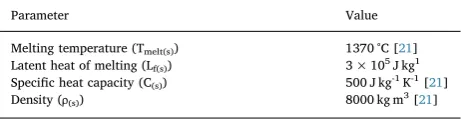
[image:6.595.308.555.56.254.2] [image:6.595.42.282.79.138.2] [image:6.595.310.465.313.374.2]There are three factors to be considered when working out the proportion of the system energy that goes into melting the substrate. Thefirst of these factors is absorbance of the powder. This is the frac-tion of the incoming energy that the powder particle is able to absorb, with any remaining fraction being reflected away and lost. This loss factor reduces the total power going into the clad-substrate system. It is assumed that all power is incident on the powder, and excess heating is transferred to the substrate by conduction. A value for absorbance of 0.12 was used [20]. The second loss factor comes from the deposition efficiency that was calculated above. This loss factor can be affected by powder feed geometry as well as a number of other variables, which have been previously outlined inSection 3.3.1where deposition effi -ciency is discussed. Thefinal factor is substrate melting efficiency. This encompasses all of the remaining loss factors such as heatflow within the substrate, geometric effects and conductive heat losses in the system, all factors that will vary greatly between laser setups. This is calculated empirically by comparing the predicted cross sectional area by the measured cross-sectional area. It is expected that this factor will encompass such losses as heating of the substrate to areas that do not melt and radiation of energy away from the clad. Combining these three factors, the predicted area of the clad below the substrate can be cal-culated using Eq.(11). This was used to produceFig. 9using the data in Table 1andTable 2. A value for latent heat of melting for 15Mo3 could not be found in the literature so a value for low alloy steel was used as a substitute.Fig. 9plots the experimentally observed cross-sectional area of the clads against their predicted values as calculated from Eq.(11). Table 1
Parameters needed for calculating power dependent deposition efficiency.
Parameter Value
Melting temperature (Tmelt(p)) 1126 °C [15] Latent heat of melting (Lf(p)) 3 × 10⁵J kg−1[15] Specific heat capacity (C(p)) 750 J kg−1K−1[15] Room temperature (Troom) 20 °C
Fig. 9.Determination of substrate melting efficiency from plot of empirically observed melt area against prediction of melt area. The solid line shows the ideal relationship where the predicted values agree with those measured. The substrate melting efficiency is calculated from the gradient of this line.
Table 2
Parameters needed for calculating substrate melting efficiency.
Parameter Value
[image:6.595.317.548.685.745.2]The line shows the point at which the two values match. This was used to determine the substrate melting efficiency as 5%.
= ⎛
⎝ −
⎞ ⎠ +
+
A
η α
ρ (C ΔT L )
m melt
P v
η PFR C T L
v
s s s f
( Δ )
( ) ( ) ( )
i p p f p
s
0 ( ) ( ) ( )
( ) (11)
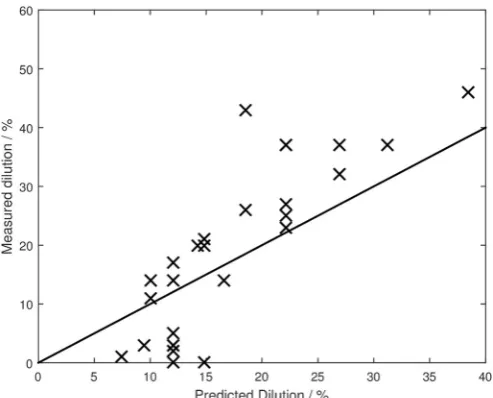
[image:7.595.40.287.55.254.2]By combining Eq.(1), Eq.(8)and Eq.(11), a predictive equation for the dilution can be found as Eq.(12). This has been used to compare the predicted dilution to the measured area dilution as can be seen in Fig. 10. It can be seen from this that as power increases, so does dilu-tion, and that the inverse is true of powder feed rate. This allows di-lution to befine-tuned using only two parameters. If strong adhesion is needed, power can be increased and powder feed rate decreased, however if low dilution is required, power can be minimised.
= − +
+ ⎛
⎝ + − +
⎞ ⎠
D η αP η η PFR C T L
η αP PFR C T L η η η η C T L
( Δ )
( Δ ) ( Δ )
melt melt i p p f p
melt
ρ s
ρ c s s f s d i melt i p p f p
0 ( ) ( ) ( )
0 ( )
( ) ( ) ( ) ( ) ( ) ( ) ( )
(12)
3.3.3. Porosity
When coating materials, especially with powders, porosity can arise in the coating. Depending of thefinal application of the coating, por-osity may be desirable, or undesirable. In either case it being able to predict the source and amount of porosity is important. Empirical models exist for predicting porosity, however they are material de-pendent and do not identify the causes of porosity. By developing a model to calculate the source of porosity from a single cause, a more accurate prediction of porosity can be made. There are two possible sources for porosity that can be considered. The first is a geometric effect arising when the powder particles do not fully melt, and create voids when placed in the laser spot. When looking at the cross-sectional images of the coatings used, such asFig. 5, there are no signs that the powder particles have not been fully melted and there is no evidence of their original shape in the clad. The voids all have a very symmetrical shape all suggesting that the pores are not caused by unmelted parti-cles. The other option is that the pores are formed by outgassing. This is related to gas being released from the powder when it is melted. This released gas is trapped in bubbles as the melt solidifies.
It has been shown above, as the fed mass per unit length increases, so does the observed cross-sectional area. This would result in the porosity percentage due the mechanism above being constant across all
fed mass per unit lengths. The method by which pores may escape could be by rising to the surface of the melt before it solidifies. This would be dependent of two factors; the speed at which the melt solidifies and the speed at which the pores rise. The speed at which the melt solidifies is dependent on the rate of heat loss from the melt. Assuming this is constant then the parameter that will affect this is the energy per unit mass. So long as enough energy is supplied to melt the incoming powder, any excess energy is assumed to heat the melt (with an ap-propriate loss factor). The greater this overheating, the longer the melt will take to cool below its melting point and solidify, suggesting the porosity percentage will be linearly dependent on energy per unit length. The speed at which the pores rise is dependent on two factors; the buoyancy of the pores and the drag acting on the pores.
The buoyancy of the pores can be calculated using Eq.(13). When this is combined with stokes law shown in Eq.(14), the terminal ve-locity of the particle can be calculated by Eq.(15). By assuming that acceleration of the bubbles is instantaneous from the point at which they form to their terminal velocity, a minimum time to escape can be calculated by Eq.(16).
=
F 43ρ( )pπrpore3 g (13)
=
F 6πηrpore porev (14)
=
v ρ r g
η 2
9 pore
p pore ( ) 2
(15)
=
t ηs
ρ r g
9 2( )p pore2
(16) Using the values inTable 3, a minimum timescale to escape can be calculated at ~0.06 s. This is shorter than the typical solidification time at these temperatures calculated in the literature for laser cladding at 0.1 s [22]. The calculated minimum timescale to escape is shorter than the typical solidification time to escape, initially suggesting that no porosity should be observed. However it must be taken into account that this is a minimum time to escape and the true value will be higher than this. It must also be taken into account that the calculation of this value has many limitations. The value for viscosity was not measured directly, nor could a true value be found in the literature. Instead, the viscosity of Fe0.8Cr0.2at 1600 °C, ~150% of the melting temperature, was used. Whilst this is not ideal, it is known that highly alloyed ma-terials tend to have higher viscosities than their lower alloyed coun-terparts. As such, the use of Fe0.8Cr0.2in this calculation will likely lower the viscosity producing a shorter minimum time to escape than the true value, further supporting the outgassing theory. Furthermore, density of melt is taken to be the same as that which is measured at room temperature. The true value for density is likely lower than this, following the trend of other materials in reducing density as tempera-ture increases. A reduced density would result in a longer minimum time to escape, again supporting the outgassing theory. The powder is produced to a maximum particle radius of 27μm. The larger a pore, the greater the time to escape will be, as can be seen in Eq.(16). As such a maximum pore size was used equal to the maximum radius of the powder particles. A minimum distance was also used from the minimum clad height produced.
[image:7.595.311.553.668.743.2]Fig. 10.Comparison of empirically measured dilution in samples compared to the dilution predicted at corresponding processing parameters with the line showing a perfect agreement.
Table 3
Parameters needed for calculating minimum timescale to escape.
Parameter Value
Dynamic viscosity (η) 5.5 × 10⁻³Pa s [23] Distance (s) 0.129 mm Density (ρ(p)) 7590 kg m−3[24] Room temperature (Troom) 20 °C
In order to further validate the outgassing theory, a comparison must be made between the porosity present in the feedstock powder and the porosity found in the coating. If these values are the same, then it supports the theory that porosity is caused by outgassing. In order to do this, an accurate volume of pores within the feedstock must be es-timated. When looking at a 2D section through a particle, the depth at which the section is taken is unknown, and therefore the observed ra-dius of the particle may not necessarily be representative of the true radius of the particle. We must first start with the assumption that sample preparation is perfect, and as such, the thickness at which a section is taken, z, has equal probability of occurring at all thicknesses. This is described by the cumulative distribution function shown in Eq. (17). This thickness can be used to relate the constant true radius, rpore, to the random variable, the observed radius in the given section, ro,by Eq.(18).
= ≤ = ⎧ ⎨ ⎪ ⎩ ⎪ ≤ < < ≥
F P Z r
a z z z z z ( ) ( ) 0 0 0 1 z Z
rpore pore
(17)
= −
ro rpore2 Z2 (18)
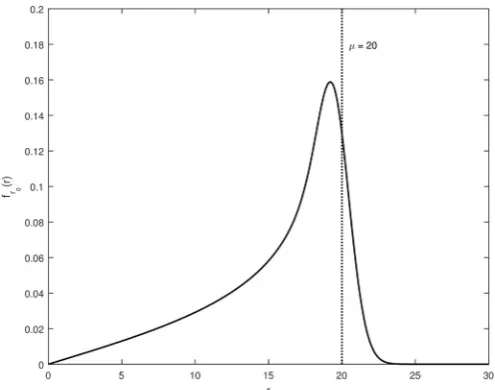
In order to predict a distribution of observed radiuses in a range of particles, it is important tofirst be able to predict the distribution of observed radiuses in a sample of identical particles with the same ra-diuses. To do this we need to produce the cumulative distribution function shown in Eq.(19). Taking Eq.(19), and substituting Eq.(17) and Eq. (18), we can produce the cumulative distribution function shown in Eq.(20). By differentiating this cumulative distribution, the probability density function of observed radius can be found for a set of random sections taken from a sample of identical particles. This Prob-ability Density Function (PDF) is shown in Eq.(21), and can be seen graphically inFig. 11.
= ≤
Fro( )r P r(o r) (19)
= − − ≤ ≤
F r r r
r for r r
( ) 1 0
r pore pore pore 2 2 o (20) ⎜ ⎟ = ⎧ ⎨ ⎪ ⎩ ⎪ < ⎛ ⎝ ⎞ ⎠ ≤ ≤ > −
F f r
r r r r a ( ) 0 0 0 0 r r r
r r r pore
1 o o pore pore2 2
(21) The special case of a sample distribution containing only particles of a single true radius, is solved in Eq.(21). Empirical data shows that many gas atomised powdersfit a log-normal distribution, and the as-sumption is made that the distribution of pores within the powder is also log-normal [25]. In order to determine the observed radius dis-tribution in a log-normally distributed sample of particles, the prob-ability density function of which is described by Eq. (22), the true probability density function must be convolved with that of a sample with uniform true radius. This is described in Eq.(23), and is visually represented inFig. 12.
= + ⎛ ⎝ ⎜ ⎜ ⎜ ⎜ ⎜ − ⎛ ⎝ ⎜ ⎜ ⎞ ⎠ ⎟ ⎟ + ⎞ ⎠ ⎟ ⎟ ⎟ ⎟ ⎟ +
(
)
(
)
f r r π( ) 1
2 ln 1
exp ln
2 ln 1 r σ μ r μ σ μ 1 2 pore σ μ 2 2 2 (22)
∫
= + − ⎛ ⎝ ⎜ ⎜ ⎜ ⎜ ⎜ − ⎛ ⎝ ⎜ ⎜ ⎞ ⎠ ⎟ ⎟ + ⎞ ⎠ ⎟ ⎟ ⎟ ⎟ ⎟ ∞ +(
)
(
)
f rr π r r
r
( ) 1
2 ln 1 ( )
exp ln
2 ln 1 d r
pore μσ pore
r
μ
σ μ
0 2 2
[image:8.595.308.556.55.250.2]1 2 o σ μ 2 2 2 (23) Eq.(23)describes how the probability density function of the ob-served particle radius depends on the mean,μ, and variance,σ2, of an underlying log-normal distribution of particle radius. Calculating the porosity fraction requiresμ, which in practice is not directly observed, however it can be inferred byfitting the distribution in Eq.(23)to the empirical distribution of observed particle radius. Wefit this distribu-tion by minimising, with respect toμandσ2, the Kolmogorov-Smirnoff distance, shown in Eq. (24), between Fro, which is the CDF corre-sponding to the PDF in Eq.(23), and F(r), which is the empirical CDF of the observed particle radius.
Fig. 11.The Probability Density Function characterises the distribution of the observed radius from taking random cross sections through pores with true radius rpore.
[image:8.595.40.289.427.709.2]−
F r μ σ F r
|ro( ; , ) ( )| (24)
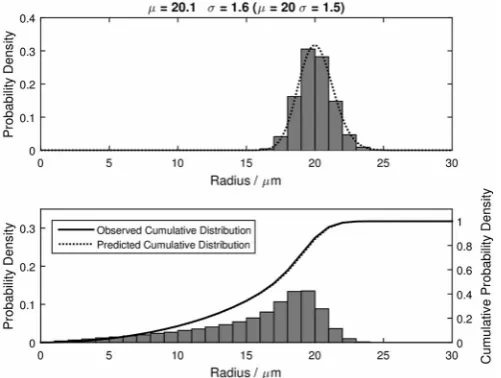
This can be achieved by computing Eq. (24) for a grid of (μ,σ2) values and identifying for which it is smallest. Afinal matrix size of 101 × 101 was chosen with the values of mean and variance equally spaced between the limits. The resultantfit is shown inFig. 13. It can be seen that the predicted value is incorrect by 0.5% for the mean and 8% for the variance. As the mean is the value that we are looking for it was decided that the model with this grid size was a goodfit. To check the validity of the model further, the number of particles needed to allow for an accurate prediction was calculated. This was done by running simulated data sets of varying sizes and comparing the predicted input to the true input. Sample sizes were tested at increasing orders of magnitude. Whilst samples sizes of the order 101varies greatly from the true mean, at samples sizers of the order 102and above the difference between the true input and the predicted input varied by ~0.2μm. as such a sample size of ~100 particles was deemed suitable to produce
[image:9.595.39.290.57.246.2]reliable results. The fit of a 100 particle simulation can be seen in Fig. 14.
Having shown that the method works well using simulated data, it was carried out on a sample of 80 pores. Using the process outlined, a mean pore diameter for the sample was calculated to be 6.2μm. Using this value, combined with the mean particle diameter of the original powder sample, the porosity volume fraction has been calculated at 8.5%. Measurements of the porosity in the produced clad produced an average of 3.4% ± 0.4%, just below the value calculated. This dis-crepancy may be accounted for by the escape time calculated earlier in this section. As the escape time for trapped pores, and the solidification time the clad are similar time scales, it is reasonable to expect some of these pores to have escaped. From this, it is concluded that the porosity is caused by outgassing and as such processing parameter optimisation will not affect thefinal porosity of the clad.
3.4. Microstructure of overlap clad
Based on the parameters determined above, the parameters were selected to produce the most desirable clad. The porosity of the clad is not determined by the processing parameters and as such no optimi-sation of porosity is possible for the given feedstock. To minimise di-lution, the power must be as low as possible and the powder feed rate as high as possible, however to maximise the deposition efficiency, Eq.(7) must be satisfied requiring power to be as high as possible and powder feed rate as low as possible. Two overlapping clad sections were pro-duced, thefirst with a power of 800 W, traverse speed of 300 mm min‑1, and powder feed rate of 4 g min‑1. The second had a power of 1000 W, traverse speed of 300 mm min‑1, and powder feed rate of 4 g min‑1. A section of thefirst clad produced can be seen inFig. 15. Of the two clads produced, the most successful was the clad produced using a power of 1000 W. The power independent capture efficiency calculated from this overlap trial alone is 43%, slightly below the value predicted by the model of 52%. The dilution in this clad is measured to be 7%, compared to the model prediction of 13%. The porosity in the overlap clad was lower than expected at 0.7%.
4. Conclusion
[image:9.595.309.557.60.237.2]In this study, the Fe-Cr-B alloy NanoSteel SHS 1770 was deposited onto a low alloy steel substrate via laser cladding. The aim was to de-velop the optimal overlapping coating and produce a predictive Fig. 13.Probability Density of true pore distribution (top) and observed pore
[image:9.595.40.288.315.504.2]radius (bottom) within a simulated data set along with the predicted probability distribution (top) and predicted cumulative probability distribution in solid line and true cumulative probability distribution in dotted line (bottom) on a 101 × 101 grid with 10,000 samples.
Fig. 14.Probability Density of true pore distribution (top) and observed pore radius (bottom) within a simulated data set along with the predicted probability distribution (top) and predicted cumulative probability distribution in solid line and true cumulative probability distribution in dotted line (bottom) on a 101 × 101 grid with 100 samples.
mathematical model for determining the processing parameters needed to produce this. The following conclusions can be made:
•
Powder deposition efficiency comprises two parts. The first is parameter independent and is calculated empirically. The second is dependent on the ratio of laser power to powder feed rate. Maximum deposition efficiency occurs when the inequality P0≥PFRe2(C(p)(Tmelt(p)−Troom) +Lf(p)) is satisfied.•
Dilution can be predicted with Eq. (12). It is dependent on laser power and powder feed rate, as well as material dependent factors such as melting point and specific heat capacity. Dilution is mini-mised when laser power is minimini-mised and powder feed rate is maximised. A substrate melting efficiency must be calculated em-pirically to predict dilution.•
The porosity is shown to be caused by outgassing, and therefore is independent of processing parameters. A method for calculating expected porosity within powders has been produced given a cross-section of powder particles.•
The models have been validated through the production of over-lapping clads and comparison of their measured parameters to those predicted by the model.5. Acknowledgments
This work was supported by the Engineering and Physical Sciences Research Council [grant number EP/L016362/1]; in the form of an EngD studentship and industrial funding from Uniper Technologies Limited.
References
[1] A.J. Pinkerton, L. Li, The significance of deposition point standoffvariations in multiple-layer coaxial laser cladding (coaxial cladding standoffeffects), Int J Mach Tool Manu 44 (2004) 573–584.
[2] H. Tan, W. Shang, F. Zhang, A.T. Clare, X. Lin, J. Chen, Process mechanisms based on powderflow spatial distribution in direct metal deposition, J. Mater. Process. Technol. 254 (2018) 361–372.
[3] M. Ansari, R.S. Razavi, M. Barekat, An empirical-statistical model for coaxial laser cladding of NiCrAlY powder on Inconel 738 superalloy, Opt. Laser Technol. 86 (2016) 136–144.
[4] U. de Oliveira, V. Ocelík, J.T.M. De Hosson, Analysis of coaxial laser cladding processing conditions, Surf. Coat. Technol. 197 (2005) 127–136.
[5] M. Berekat, R. Shoja Razavi, A. Ghasemi, Nd:YAG laser cladding of Co–Cr–Mo alloy onγ-TiAl substrate, Opt. Laser Technol. 80 (2016) 145–152.
[6] V. Ocelík, U. De Oliveira, M. de Boer, J.T.M. De Hosson, Thick Co-based coating on cast iron by side laser cladding: Analysis of processing conditions and coating properties, Surf. Coat. Technol. 201 (2007) 5875–5883.
[7] Y.W. Sun, M.Z. Hao, Statistical analysis and optimization of process parameters in Ti6Al4V laser cladding using Nd:YAG laser, Opt. Lasers Eng. 50 (2012) 985–995. [8] N. Ahmed, K.T. Voisey, D.G. McCartney, Investigation into the effect of beamshape
on melt pool characteristics using analytical modelling, Opt. Lasers Eng. 48 (2010) 548–554.
[9] M. Picasso, C.F. Marsden, J.D. Wagniere, A. Frenk, M. Rappaz, A simple but realistic model for laser cladding, Metall. Mater. Trans. B Process Metall. Mater. Process. Sci. 25 (1994) 281–291.
[10] I. Tabernero, A. Lamikiz, S. Martinez, E. Ukar, L.N.L. de Lacalle, Modelling of en-ergy attenuation due to powderflow-laser beam interaction during laser cladding process, J. Mater. Process. Technol. 212 (2012) 516–522.
[11] H.R. Shercliff, M.F. Ashby, The prediction of case depth in laser transformation hardening, Metall. Trans. A. 22 (1991) 2459–2466.
[12] P.H. Steen, P. Ehrhard, A. Schussler, Depth of melt-pool and heat-affected zone in laser-surface treatments, Metall. Mater. Trans. A 25 (1994) 427–435.
[13] H.J.G. Gundersen, E.B. Jensen, Particle sizes and their distributions estimated from line- and point-sampled intercepts. Including graphical unfolding, Journal of Microscopy 131 (1983) 291–310.
[14] H.J.G. Gundersen, E.B. Jensen, Steriological estimation of the volume weighted mean volume of arbitary particles observed on random sections, J. Microsc. 138 (1985) 127–142.
[15] K. Chokethawai, Microstructural Evolution in Fe-Cr-B based Alloy Powder and Thermaly Sprayed Coatings and Their Wear Performance, (2010).
[16] Sandvik Materials Technology, Sandvik 15Mo3 tube and pipe, Seamless Datasheet, 2017.
[17] L. Reddy, P. Shipway, C. Davis, T. Hussain, HVOF and laser-cladded Fe-Cr-B coating in simulated biomass combustion: microstructure andfireside corrosion, Oxid. Met. 87 (2017) 825–835.
[18] K. Chokethawai, D.G. McCartney, P.H. Shipway, Microstructure evolution and thermal stability of an Fe-based amorphous alloy powder and thermally sprayed coatings, J. Alloys Compd. 480 (2009) 351–359.
[19] B. Song, T. Hussain, K.T. Voisey, Laser cladding of Ni50Cr: a parametric and dilu-tion study, Phys. Procedia 83 (2016) 706–715.
[20] T.J. Wieting, J.L. DeRosa, Effects of surface condition on the infrared absorptivity of 304 stainless steel, J. Appl. Phys. 50 (1979) 1071–1078.
[21] SteelSS, Data Table for: High alloy: 16Mo3, (2011).
[22] V. Ocelik, I. Furar, J.T.M. De Hosson, Microstructure and properties of laser clad coatings studied by orientation imaging microscopy, Acta Mater. 58 (2010) 6763–6772.
[23] R. Novakovic, J. Brillo, Thermodynamics, thermophysical and structural properties of liquid Fe-Cr alloys, J. Mol. Liq. 200 (2014) 153–159.
[24] I. ShipMate, Material Safety Data Sheet: SHS 7170 Thermal Spray Powder, The NanoSteel Company Inc., Providence, Rhode Island, 2011.