1 The Role of Small Specimen Creep Testing within a Life Assessment Framework for High Temperature Power Plant.
A. Morrisa, B. Cacciapuotib, W. Sunb
a EDF Energy (UK), Coal Gas and Renewables, Central Technical Organisation, Barnwood, Gloucester GL4 3RS UK
b Department of Mechanical, Materials and Manufacturing Engineering, University of Nottingham, Nottingham NG7 2RD UK
Abstract
The safe operation of components operating at high temperature and pressure faces numerous challenges associated with ageing materials and maintaining commercial viability whilst economies transition to a lower carbon future as part of their climate change commitments. Due to these challenges the plant operator faces increasing pressure to ensure that any capital or operational expenditures are optimised and must ensure that they duly recognise plant age, condition, operating regime and ultimately the planned closure date.
This review, for the first time, describes how small specimen creep testing can be applied within a practical and deployable life assessment framework and in conjunction with other assessment techniques. The current state of the art for small specimen creep testing is critically reviewed; this also includes a review of traditional techniques used on site for the metallurgical assessment of material condition, with examples from site investigations and assessment campaigns in both conventional and nuclear plant applications.
In order to enhance the current practice for assessing the condition of creep ageing components this review proposes the more proactive use of small specimen testing methods for the in-service condition assessment of power plant materials, notably earlier in the plant lifecycle and within a holistic life assessment framework. This is intended to provide a means of calibrating the time dependent response of the component or system being monitored, thereby providing a key reference in-service strain rate measurement, or material property evaluation, that can subsequently be used with other traditionally deployed assessment methods to define a more targeted and cost-effective forward inspection plan. The review describes how small specimen creep testing methods and other complementary tools can be use in a new and structured approach to life management.
The current status of small specimen testing methods, for both conventional and nuclear applications, is described along with a detailed discussion on current practice for in-service creep life assessment, with a case study used to illustrate the main principals. A case study is presented for ageing CMV (0.5%Cr0.5%Mo0.25%V) main steam pipework due to the extensive amount of through life data available, which highlights the particular challenges associated with the interpretation of various types of site outage inspection data, in conjunction with on-load plant operational data. The current approach to the assessment of component condition follows well established inspection based practices defined in various industry good practice guides, with expert elicitation and experience used to judge the condition of the component, system and operational risk on return to service.
2 highlighted other aspects of the current approach to in-service condition assessment that could be improved to support the plant owner. This specifically refers to the potential to develop and implement novel life assessment models that can take advantage of the significant amount of site data currently routinely acquired during plant outage overhauls. There is a clear need to provide the plant owner with more reliable and effective life prediction tools, based on earlier and more rigorous assessment of life consumption. The proposed application of small specimen testing described in this paper is equally applicable to both conventional and nuclear plant applications and a range of components, from static pressure systems to high temperature turbine rotors.
Nomenclature
A, B, C, …, I Coefficient in parametric equation
A’ Material constant
a' Elliptical ring half-axis
ap Receiving hole radius in small punch creep test b Length of impression creep test specimen
b' Elliptical ring half-axis
bT Two-bar specimen width
d Width of impression creep test indenter
d’ Thickness of the ring in the axis direction
d0 Thickness of the ring in the radial direction dT Two-bar specimen thickness
DT Diameter of the loading pins
h High of impression creep test specimen
h' Cut depth
k Length of the loading pins supporting end
KSP Correction factor LT Initial bar length
n Material constant 𝒑̅ Mean indenter pressure
P Applied load
R Radius of the circular ring
Rs Punch radius
t, tf Current and fracture thickness of small punch specimen wt Wall thickness
t0 Initial thickness of small punch creep test specimen w Width of impression creep test specimen
α Stress multiplier
β Conversion factor
Δ, Δf Creep displacement and creep displacement at fracture ∆̇ Creep displacement rate
ε Strain at the contact boundary 𝜺𝒔𝒔𝒄 Creep strain in the steady-state 𝜺̇𝒎𝒊𝒏𝒔𝒔 Minimum creep strain rate
η Conversion factor
σm Membrane stress
3 𝝈𝒓𝒆𝒇 Equivalent uniaxial stress
ϕ Outer diameter
1
Introduction
Power stations are designed and maintained to operate for long periods safely and reliably in accordance with statutory requirements. In the UK these statutory provisions are detailed in the pressure systems safety regulations (PSSR) [1], which are applicable to both conventional and civil nuclear generating plant. Further to the PSSR, UK civil nuclear advanced gas cooled reactor (AGR) generating plant is subject to licence conditions stipulated by the office for nuclear regulation (ONR) [2]. The aim of these regulations is to prevent injury from the hazard posed by high stored energy systems as a result of a failure.
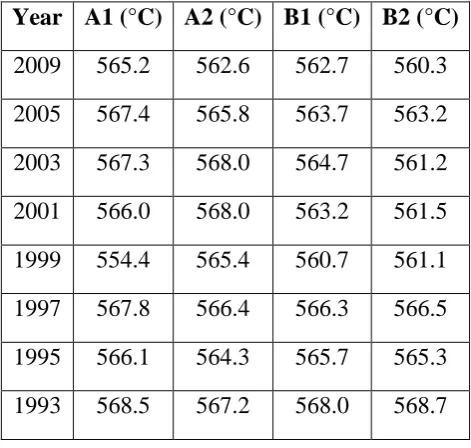
Subsequent pressure system inspections must be undertaken by competent persons in accordance with written schemes of examination that identifies the systems or components requiring inspection and takes into account the relevant degradation and ageing mechanisms, asset condition including past inspection, assessment history and intended future operation. The inspection periodicity between major statutory outages on UK conventional fossil fired generating plant is every 4 years, with a short interim outage scheduled after 2 years. Typically, AGR generating plant is subject to a periodic pressure systems outage inspection every 3 years. Understanding residual life (and critically the mode of failure and rate of deterioration) is essential to maintain safety and to enable the utility to plan for any repair or replacement activities in a timely and cost-effective manner. The operational duty of the high temperature and pressure steam circuits differ considerably between an AGR plant and a conventional fossil fired plant. Large conventional fossil fired plant are operated far more flexibly and at higher temperatures than AGR plant (design temperature of 568°C for conventional fossil fired plant vs. 540°C for AGR plant), but with similar maximum pressures of ~170bar, which reflect conditions as the steam exits the boiler.
There are other high temperature components aside from pressure systems in operation that could equally benefit from the use of small specimen creep testing, such as high pressure (170 bar) and intermediate pressure (40 bar) steam turbine rotors. The potential use of small specimen creep testing on these components is however considered more difficult due to limited access, since periodic overhauls typically occur every 12 years and with the turbines removed from berth. On these rotors access to the most relevant locations for material sampling is more restricted, for example the turbine disc steeples are of great interest, however these locations are precision machined and a sample could not be feasibly extracted without undertaking a costly repair to the disc head. Hence, the use of small specimen creep testing of material extracted from these components is more likely to be a practical choice on a rotor that has been retired from service, where the information obtained from the test could be used to provide a more informed view on the condition of other rotors in-service.
The review published by Hyde et al [3] in 2007 focussed on the use of small specimen testing methods to satisfy data requirements. This review is applicable to both conventional and nuclear plant applications and is focussed on providing a review of the current state-of-the-art of small specimen creep testing but with a focus on plant applications. Subsequently the review emphasises the following;
4
A proposal is presented for the more pro-active use of small specimen testing methods to improve the approach to creep life expiry and subsequent run-repair-replace decisions. Examples of in-service inspection data and a detailed case study based on high temperature and pressure pipework on conventional fossil fired plant operation is used to illustrate the above points. Pipework systems are chosen for the case study because of the extensive amount of through life inspection data available as well as extensive research studies related to material creep behaviour and modes of failure.
Understanding the contribution of prior service duty to creep life consumption and a prediction of the future rate of ageing is essential if a utility is to optimise its generating output and return on investment, with respect to both maintenance and capital infrastructure costs.
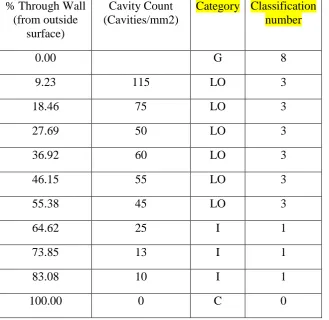
Figure 1 shows historical operating data from two 2000MW fossil fired conventional power stations presented as unit operating hours divided by unit starts; the data presented for each station has been averaged across all of the units on each site. This shows a dramatic variation in operating hours-to-starts ratio ranging from > 500 during the early operational years, which reflects significant operation at constant (base) load to a dramatic change in the mid 1990’s, to around 25. This significant reduction in hours-to-starts ratio indicates a move to more flexible plant operation, which is driven by the demands of the commercial market. Figure 2 shows specific unit average operating hours and starts for station ‘A’. If all eight 500MW units operating in stations ‘A’ and ‘B’ are considered the range of unit operating hours is from 250Khr to 280Khr and the range of unit operating starts is from 2500 to 4100. To put this operational data into context particular reference is made to a UK parliamentary study on UK energy policy [4], which describes the significant impact associated with these operational figures as a result of the privatisation of the central electricity generating board (CEGB) in 1990.
Both current and future operation is greatly influenced by legislation regarding environmental compliance. As a consequence of this legislation it is anticipated that stations ‘A’ and ‘B’ will from 2016 onwards revert to limited annual operational hours and unit starts (up to ~ 2000 h and 100-200 starts). This shows the challenges associated with optimal deployment of small specimen testing methods (or any other monitoring or life assessment approach); these methods have to account for a wide range of operating duty throughout the stations operational life.
In the UK, the approach to managing the integrity of the high pressure and temperature pipework systems and components on conventional fossil fired plant is based primarily on an inspection based assessment (IBA) approach. This IBA approach is implemented in line with the statutory outage inspection periodicity and consequently it has no specific requirement to provide longer-term predictions of component degradation rates.
For the utility the goal of optimised life management would be realised with the following:
Timely replacement of life expired components (maximising the useful service life), allowing the utility to budget and plan for cost-effective replacement,
Continual optimisation of inspection plans during unit shutdowns; making the best use of all available condition monitoring and outage overhaul data,
The more timely use of on-load monitor data and outage inspection findings to update and manage the plant risk profile within acceptable levels,
5 In this context, the development and more proactive use of small specimen creep testing methods for the assessment of the integrity of high temperature and pressure systems provides a significant opportunity to reach this goal, but in conjunction with other complementary assessment tools that are outlined in this review.
2
Specialised Small Specimen Creep Testing
In the last 20 years small specimen creep testing techniques (SSTT) have been increasingly developed to evaluate creep properties for materials relevant to components operating at high temperature in power plant applications, to assess their remaining life and avoidance of premature failures [5]. A way forward to establish this key material data is considered to be the use of standard size uniaxial creep tests, which are well-standardised mechanical test techniques, but requiring a large amount of material to be sampled from the operating components. Furthermore, it is often needed to perform analyses on critical locations on operating components, e.g. the heat-affected zone of welds, or to risk rank the most vulnerable operating components within a larger population. In order to avoid these particular difficulties, innovative non-invasive testing techniques, such as the small punch, impression, small two-bar and small ring creep tests, have been investigated by several authors, because of the relatively small volume of material they require. In practice, these non-destructive techniques have been used to provide a ranking of material creep strength, thereby assigning a suitable inspection priority that has been adopted during a plant outage [6]. Furthermore, small punch creep testing has found applications in the nuclear field, especially for the characterization of irradiated materials (see Section 5.4).
2.1 Scoop sampling
In order to manufacture miniature specimens from in-service components, scoop sampling techniques are currently used for industrial procedures [7, 8]. Rolls-Royce produced the SSamTM-2 sampler for the extraction of material samples (Figure 3); the machine has a length of 420 mm and presents a hemispherical shell cutter of 50 mm in diameter, which can remove a “button” shaped sample of material, that is, typically, 25 mm in diameter and 4 mm thick [8]. Rolls-Royce has also designed two other smaller samplers, one able to fit within a 38 mm diameter tube bore and the second within a 30 mm annulus [8]. Scoop sampling techniques are such that the wall thickness of the component does not become smaller than the design wall thickness after some material has been removed [9]. Nevertheless, an increase of the creep strain rate in the sample area has been observed by finite element (FE) analyses of drum, steam pipes and turbine rotor bore. This is due to the increase in stress at the bottom of the of the excavation, which is up to 1.2-1.5 times greater than the stresses in the intact wall in the same depth from the external surface of the component [10, 11]. In order to assess the creep damage due to this stress increment caused by the scoop sampling, Klevtsov and Dedov carried out FE analyses of a steam pipe with an outer diameter, ϕ, of 325 mm and a wall thickness, wt, of 30 mm, and creep cavity count on three bends steam pipes of 12Ch1MF and 15Ch1M1F [11]. Two important conclusions can be deducted from their research: after 23-27 khr of service, the analysed components presented the same creep damage in the region under the scooping area and at a distance of 10 mm from that; also tensile properties of the materials remained the same during the service and were independent of the excavation location and of the specimen typology [11].
6 Rouse et al. investigated the effects of scoop sampling on the creep response of straight pipe sections with different geometries, for a range of cut depths from 1 to 5 mm and for different load conditions, for the material 0.5Cr0.5Mo0.25V at 640°C [16]. They found that the presence of the excavation generates a localized stress around the base of the excavated notch. In the case of a static application of the load to the pipe, the condition is considered safe if the stress at the base of the excavation concentration does not exceed the magnitude of the stress at the inner surface. This condition is achieved only when the depth of the excavation, h’, is 1 mm for a pipe section with ϕ=360 mm and wt=60 mm. Rouse at al. also propose a parametric equation which can estimate the scoop sample riser effect for a wide range of materials and pipe geometries, here given in equation (1), where A, B, C, …, I are fitting constants [16]. Future study is needed on the effects of scoop sampling on the sampled component under the effects of cyclic load conditions.
𝜎𝑅 𝜎𝑀𝐷𝐻(
𝜙
𝑤𝑡, ℎ′) = 𝐴 𝜙4 𝑤𝑡+ 𝐵
𝜙3 𝑤𝑡+ 𝐶
𝜙2
𝑤𝑡+ 𝐷ℎ′2+ 𝐸 ( 𝜙2
𝑤𝑡+ ℎ′2) + 𝐹 𝜙
𝑤𝑡+ 𝐺ℎ′ + 𝐻 (𝜙
𝑤𝑡+ ℎ′) + 𝐼
(1)
These studies on the effect of the scoop excavation suggest that a degree of prior assessment is required before a sampling exercise is conducted to consider the excavation depth, component geometry, material type, its condition and the operational duty of the plant. The study by Rouse et al [16] considers operating temperatures at 640oC, which is much higher than the typical plant operating temperatures (~ 570oC) that Brett’s study alludes to. This emphasises the need to measure on plant or estimate by analysis, the operating temperature related to a proposed sampling location due to the temperature.
For practical purposes a scoop sample location would be identified as a location on a future inspection schedule, noting that the additional cost and effort for the inspection of scoop sample locations typically is insignificant when compared to the full inspection scope during an outage. Ideally all scoop sample locations would be accessible for repair should the need be foreseen. 2.2 Reference Stress Method
A major concern in the evaluation of test data of small specimen creep testing techniques is their correlation with uniaxial creep data. The approach currently used for data conversion is the reference stress method [17, 18]. For materials obeying the Norton creep law, here reported in equation (1), where A’ and n are material constants, the reference stress method consists in calculating two reference parameters, η and β, such that a relationship between the equivalent uniaxial stress, σref, and the applied stress, σ, and a relationship between the creep strain rate in the
steady-state, ε̇ssc , and the creep displacement rate obtained by SSTT, Δ̇𝑐, are established.
𝜀̇𝑚𝑖𝑛 = 𝐴′𝜎𝑛 (1)
Δ̇𝑐 can be expressed as a function of the creep material properties, the dimensions of the specimen and the applied stress, as reported in equation (2).
Δ̇𝑐 = 𝑓
1(𝑛)𝑓2(𝑑𝑖𝑚𝑒𝑛𝑠𝑖𝑜𝑛𝑠)𝐴′𝜎𝑛 (2)
7 can be defined as in equation (3). It should be noted that the EGL does not vary with n since none of the terms in equation (3) does.
𝐸𝐺𝐿 =𝑓1(𝑛)
𝜂𝑛 𝑓2(𝑑𝑖𝑚𝑒𝑛𝑠𝑖𝑜𝑛𝑠)
(3)
If s is a characteristic dimension of the sample, the reference parameter β can be expressed as in equation (4) and again it should be noted that this constant is independent of n.
𝛽 =𝐸𝐺𝐿 𝑠
(4)
Finally, equations (5) and (6) represent the sought relationships for Δ̇𝑐 and ε̇ ss c .
Δ̇𝑐 = 𝐸𝐺𝐿 𝐴′𝜎𝑛 = 𝛽𝑠𝐴′𝜎𝑛 = 𝛽𝑠 ε̇ ss c (𝜎
𝑟𝑒𝑓) (5)
𝜎𝑟𝑒𝑓 = 𝜂𝜎 (6)
2.3 Codes and Standards for Small Specimen Creep Testing Techniques
Standards for small specimen creep testing techniques still do not exist, but two Codes of Practice have been released for small punch creep test by the European Committee for Standardisation in 2006 [5] and by the Standardization Administration of China in 2012 [19, 20]. Efforts in developing a standard draft for SPCT are also ongoing in Japan, but an English version does not exist yet [21]. In the USA, an ASTM Standard test method for small punch testing of ultra-high molecular weight polyethylene used in surgical implants has been released, but does not concern creep testing [22].
The European CEN CWA 15627 [5], last updated in 2007, has been accepted as a first incentive for industrial applications all through the world, even if it is far away to be a standard and certainly needs to be improved [23]. The CEN Code of Practice consists of two parts, Part A: A Code of Practice for Small Punch Creep Testing, and Part B: A Code of Practice for Small Punch Creep Testing for Tensile and Fracture Behaviour. Part A is related to specifications for the test rig, test procedure and interpretation of results for small punch test designed for material characterisation [5]. Part B is focused on the test rig, test procedure, test specimen preparation, interpretation of results and methods for deriving the yield strength, the ductile-to-brittle transition temperature (DBTT) and the fracture toughness from SPCT [5, 23]. Hurst and Matocha published a critical review on the CEN CWA 15627 also suggesting some potential improvements of the code [23]. One of their concerns is related to the Shear Punch test, which is not included in the code, even if it has been proven to be a reliable technique for the evaluation of tensile properties [23, 24].
8 2.4 Currently Used Test Methods
Reliable bulk behaviour can be obtained if at least 8 grains are contained through the specimen thickness. Among the small specimens described in this section, the smallest dimension of the samples is the small punch disc thickness, equal to 0.5 mm. So, the materials generally used in power plant have at least 20 grains through such a thickness, allowing consisted results to be obtained.
2.4.1 Impression Creep Test
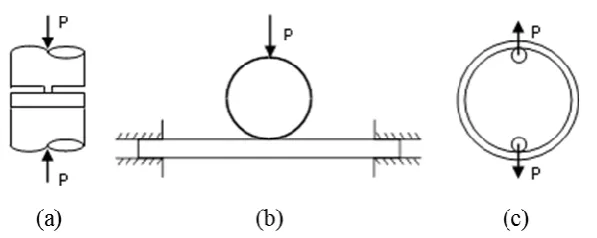
In the impression creep test (ICT) a steady constant load, P, is applied to a flat-ended indenter in contact with the specimen at a fixed temperature. The test output is the variation of the indenter displacement with time, which is related to the creep properties of the small volume of material in the contact region between the specimen and the indenter. Figure 4-a shows the typical test geometry. If the indenter is rectangular, the reference stress approach can be used to establish the corresponding equivalent uniaxial stress, σref, and the creep strain rate in the steady-state, ε̇ssc , for
materials obeying the Norton creep law[26]. Equations (7) and (8), where d is the indenter width, express the relationships between them and the mean indenter pressure, 𝑝̅, and creep displacement rate, Δ̇. The reference stress parameter, η and β, do not depend on the impression depth, if the creep displacement Δ is relatively small compared to the specimen thickness.
𝜎𝑟𝑒𝑓 = 𝜂𝑝̅ (7)
𝜀̇𝑠𝑠𝑐 = Δ̇ 𝛽𝑑
(8)
Once Δ̇𝑐 is known, for example by FE analyses, for different values of n, it is possible to calculate β through equation (9), by using assumed values for the stress multiplier, α [26]. The value of α such that β does not vary with n, is the reference stress parameter η [26].
𝛽 = Δ̇
𝑑𝐴′(𝛼𝜎)𝑛
(9)
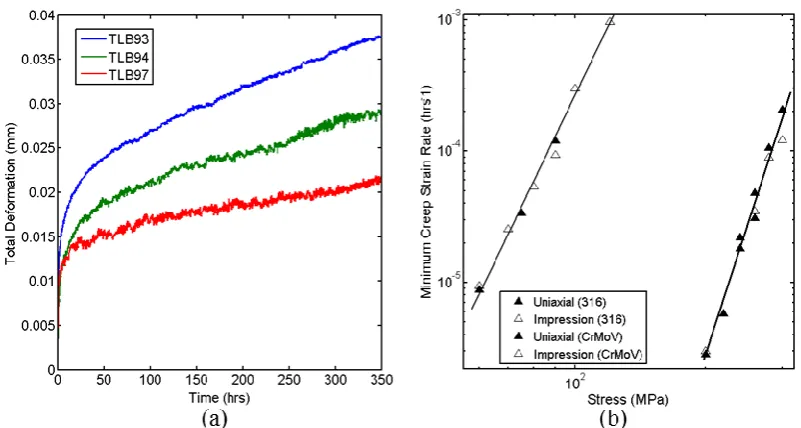
The η and β values for the recommended geometry (w×b×h = 10×10×2.5 mm) are η = 0.43 and β = 2.18, for an indenter width of d = 1 mm [26]. A typical set of data obtained from such tests for a high temperature CMV (0.5%Cr0.5%Mo0.25%V) steel is shown in Figure 6. Impression creep test data lie on the same straight line of uniaxial test data, confirming the reliability of the ICT. The slight fluctuations in the data observed are mainly caused by temperature variations within the furnace and laboratory. However, it can be seen in Figure 6-a that these variations are typically well within ±1 μm [27].
2.4.2 Small Punch Creep Test
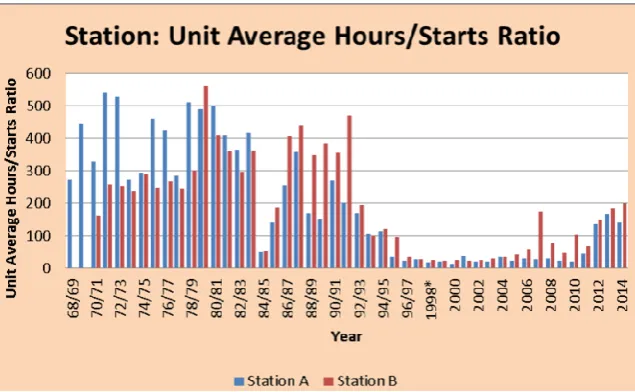
The small punch creep test (SPCT) consists of the application of a constant load, P, to a hemispherical indenter in contact with a disc specimen clamped between an upper and lower die containing the receiving hole. Figure 4-b shows the sketch of typical specimen and punch, while a schematic cross section of the test rig is given in Figure 7-a.
9 the punch radius, Rs, between 1 and 1.50 mm. Li and Sturm [28] found a third order polynomial
based on Chakrabarty’s membrane theory [29] and valid for Rs=1.25 mm and ap=2 mm (receiving
hole diameter), which correlates the strain, ε, at the contact boundary between the punch and the disc and the central displacement of the punch, Δ, as shown in equation (10). An empirical relationship between the applied load and the membrane stress, σm, is also given in the CEN Code
of Practice and is here reported in equation (11) [5].
𝜀 = 0.17959Δ + 0.09357Δ2+ 0.0044Δ3 (10)
𝑃 𝜎⁄ 𝑚 = 1.72476Δ + 0.05638Δ2+ 0.17688Δ3 (11)
These relationships are only valid when bending deformation of the specimen is negligible and thus the deformation mode can be assumed to be governed by membrane stretching. This happens when large deformations are exhibited by the specimen during the test, that is, from an engineering estimation, when Δ>0.8 mm [5]. However, according to many researchers, during small punch creep test the specimen deformation is caused by bending prior to membrane stretching [30-32] and a recent study, confirming this theory, suggests upper limits to Δ, depending on the specimen and the punch dimensions [33], as shown in Table 1.
Table 1. Conditions for the applicability of Chakrabarty’s theory for small punch data interpretation from Ref. [33].
{
0.8 < Δ < 0.95 mm if 1.04 ≤ 𝑅𝑠 < 1.25 mm 0.8 < Δ < 1.15 mm if 1.25 ≤ 𝑅𝑠 < 1.50 mm
Δ > 0.8 mm if 𝑅𝑠 = 1.50 mm.
Another empirical relationship, always derived by Chakrabarty’s membrane theory, is reported in an annex of the Code of practice [5], and can be used to derive the load to be applied for the SPCT, here given in equation (12), where KSP is a correction factor depending on the tested material.
𝑃 𝜎⁄ 𝑚 = 3.33𝐾𝑆𝑃𝑅𝑠−0.2𝑎𝑝1.2𝑡0 (12)
In order to find KSP, at least five small punch creep tests are necessary as well as a comparison with
a conventional creep test [5, 34]. This parameter generally ranges between 1 and 1.5 [35]. An additional difficulty in SPCT data interpretation is the not negligible variation of the reference parameters due to large deformations involved in the test [34] and, although it is still possible to define η, as in equation (13), in virtue of equation (10) a constant EGL, and thus a constant β, cannot be determined [36].
𝜂 =0.6𝜋 𝐾𝑆𝑃 (
𝑎𝑝 𝑅𝑠)
0.2 (13)
Figure 7-b shows typical small punch creep test data output, in terms of displacements versus time, for a P91 steel at 600 °C, while Figure 7-c shows converted creep rupture data (using equation (11), with KSP = 1.275), obtained from a SPCT on a P91 steel at 650 °C, compared with corresponding
uniaxial data. SPCT data are in good agreement with uniaxial data. 2.4.3 Small Ring Creep Test
10 analytical solution for the load-line displacement rate of the elliptical ring in the secondary region of the creep curve has been developed at the University of Nottingham in 2009 by assuming as the main hypotheses the effects of the shear stresses to be negligible, bending as the governing deformation mode, and material obeying Norton’s creep law [36]. The solution is given in equation (14), where a’ and b’ are the ellipse half-axes and 𝑏0 and d’ are the thicknesses in the radial and axis directions, respectively, P is the applied load, while Int2 is defined in equation (15), where θ is
the angular coordinate of the small ring system, as shown in Figure 5, and θ’ the value of θ for null bending moment, M. If the ring is circular a’=b’=R, where R is the radius of the ring.
∆̇= (2𝑛 + 1
𝑛 )
𝑛
𝐼𝑛𝑡2(𝑛, 𝑎′/𝑏′)4𝑎′𝑏′ 𝑑′ 𝐴′ (
𝑃𝑎′ 𝑏0𝑑′2)
2 (14)
𝐼𝑛𝑡2(𝑛, 𝑎′
𝑏′) = − ∫ {(𝑐𝑜𝑠𝜃 − 𝑐𝑜𝑠𝜃′)𝑛(1 − 𝑐𝑜𝑠𝜃)√[( 𝑎 𝑏)
2
𝑠𝑖𝑛2𝜃 + 𝑐𝑜𝑠2𝜃]} 𝜃′
0
𝑑𝜃
+ ∫ {(𝑐𝑜𝑠𝜃′ − 𝑐𝑜𝑠𝜃)𝑛(1 − 𝑐𝑜𝑠𝜃)√[(𝑎 𝑏)
2
𝑠𝑖𝑛2𝜃 + 𝑐𝑜𝑠2𝜃]} 𝜃′
0
𝑑𝜃
(15)
By virtue of the reference stress method, the equivalent uniaxial creep stress and the equivalent uniaxial creep strain rate for the load-line deformation rate, ∆̇, are given in equations (16) and (17) [36, 37]. For the full mathematical treatment refer to Ref. [36].
𝜎𝑟𝑒𝑓 = 𝜂𝑏𝑃𝑎′
0𝑑′2
(16)
𝜀̇𝑐(𝜎 𝑟𝑒𝑓) =
𝑑′ 4𝑎′𝑏′𝛽∆̇
(17)
Large deformations involved during the test do not significantly affect the conversion parameter η, the thickness in the radial direction, 𝑏0, and the thickness axis direction, d’; while they affect a’, which decreases during the test as well as σref ; the conversion parameter β also varies with the ratio
a’/b’ at each instant of time [36, 37]. As a consequence, the creep curve still shows primary and secondary regions, but the latter is characterised by a finite curvature rather than a constant rate [37]. In other words, with this test, a constant strain rate is not quite achieved, but it is still possible to calculate the equivalent uniaxial data by using the method proposed by Hyde et al., which consists in calculating the instantaneous values of a’/b’, η, β, σref and 𝜀̇𝑐 at many intervals in the
secondary region; the average of the calculated values of σref and 𝜀̇𝑐 can be then assumed to be the
equivalent uniaxial data [37]. In order to obtain a better defined steady-state, Hyde et al. are developing a software capable of varying the load during the test according to equation (16) as the specimen shape changes [37].
11 2.4.4 Small Two-Bar Creep Test
Another small specimen experimental technique which has been recently developed at the University of Nottingham by Hyde et al. is the two-bar specimen (TBS) test [38]. Figure 9-a shows the typical test rig, while Figure 9-b shows the typical two-bar specimen, which consists of two relatively slim bars connected by supporting ends. The sample is creep tested by applying a constant load to the supporting ends through the use of two pins (Figure 9-a). The specimen geometry comprises of the initial bar length, LT, which is the distance between the centres of the loading pins,
the length of the loading pins supporting end, k, the specimen thickness, dT, the diameter of the
loading pins, DT, and the bar width, bT [38]. Hyde et al. recommended LT/bT=4.5, DT/(2bT)=1.25, k/
DT=1.3 [38] and a bar length, LT, of 26 mm, which is larger than the diameter of the small punch
creep test specimen recommended in the CEN Code of Practice [5], i.e. 8 mm, and of the impression creep test specimen recommended in ref. [26]. The equivalent uniaxial creep stress and the equivalent uniaxial creep strain rate are again defined through the reference stress method and here given in equations (18) and (19), where η and β are determined by FE analyses, as for impression creep test, and their values are 0.9866 and 1.456, respectively [38]. However those values were obtained by the use of Norton’s law, thus the FE analyses could well predict the primary and secondary region of the creep curve, but not the tertiary region. Consequently, further investigation in determination of the reference stress parameters is ongoing [39].
𝜎𝑟𝑒𝑓 = 𝜂2𝑏𝑃
𝑇𝑑𝑇
(18)
𝜀̇𝑐(𝜎 𝑟𝑒𝑓) =
∆̇ 𝐿𝑇𝛽
(19)
During the test, the creep deformation of the specimen is essentially due to stretching under uniaxial stress, as well as the rupture of the bars. Bending occurs in the area of the contact between the sample and the pins, but it has be proven not have a significant effect on the failure mode and on creep deformation [39]. This behaviour of the specimen is also observed by FE analysis results, as shown in the contour plot presented in Figure 10, where the specimen failure of P91 steel at 600 °C and applied stress of 170 MPa is achieved when the damage variable, ω, approaches unity. The two-bar test is very close to the uniaxial test and this is also the reason why η is almost 1.
Typical small two-bar creep test data output and the corresponding correlation with uniaxial tests are shown in Figure 11. TBS data are in good agreement with uniaxial data, as their MSR trend is still on the same straight line of the uniaxial data, as well as for impression and small ring creep tests data.
2.5 Evaluation of Current Test Methods
The selection of a small specimen creep test technique is dictated by factors such as, economics, the type of data required, e.g. creep rupture data or creep strain rate data, material to be tested and the test conditions [40].
12 which does not allow the material to exhibit creep damage [41]. The deformations involved during the test are very small, of the order of μm, requiring very accurate data acquisition and temperature control systems. Furthermore, FE analyses of this test are complicated by the contact interaction between the indenter and the specimen. The same problem is observed in numerical simulations of small punch creep test, where the contact is also non-linear.
The small punch creep test potentially allows the entire characterisation of material behaviour up to failure, because the specimen is taken to rupture and it can also be used to perform focused analyses on critical locations of operating components. Despite these advantages the interaction of several linearities, such as large deformations, large strains, linear material behaviour and non-linear contact interactions between the specimen and the punch, induces a complex multi-axial stress field in the specimen which also evolves in time [42-45]. This affects the SPCT fracture mechanism and introduces several challenges into the identification of a robust correlation to convert SPCT data into respective standard uniaxial creep test data [34, 46]. Another major concern is the non-repeatability of the testing method, since the experimental results depend on the set up geometry [5]. For this reason, a well-established and universally accepted method for data interpretation still does not exist.
Progresses in the understanding of the complex behaviour of the specimen have been made through FE analyses and microstructural studies. In particular, the implementation in a commercial FE code of the Liu and Murakami damage model [47], by the use of a subroutine, leads to good simulation of the crack propagation in the small punch specimen, as shown in Figure 12, where a comparison between SEM images of interrupted tests and FE results of P91 steel is proposed. Figure 12 also confirms Chakrabarty and other researchers’ statement that the necking occurs at a certain distance from the specimen centre due to friction [29, 31, 33, 48] and that the zone affected by the maximum damage spread from the bottom of the specimen through the thickness in the necking area, as reported in the open literature [32, 49, 50]. The creep mechanism characterising the deformation of the specimen, that is represented by dislocation creep in the secondary creep regime and inter-granular cavitation when the tertiary creep stage is reached, is not affected by the different temperature values of the test, 600 °C, and of that assumed for the material properties in the numerical simulations, 650 °C [33, 51]. Figure 13 shows the typical uniaxial creep test output in terms of strain versus time, and illustrates that the crack propagation starts in the tertiary region of the creep curve. By comparing Figure 7-b, Figure 12 and Figure 13 the different behaviour of the small punch specimen with respect to the uniaxial specimen is evident. In fact, the crack propagation in the small punch disc starts in the secondary region of the creep curve instead of the tertiary region, as observed for the typical uniaxial specimen.
Difficulties in obtaining good agreement between FE analyses and small punch test output are due to the effects on the specimen time to failure of punch load misalignments, of initial plasticity, and of the approximation of the friction formulation used in the FE analyses for the interactions between the specimens and the testing machine components [33]. An increase of the failure life has been found to be up to 10 times when initial plastic deformation is included in the model [30]; the time to failure can also increase up to 8 times when the friction coefficient between the specimen and the punch varies from 0 to 0.5 [51-53]. Punch load misalignments can also increase the time to failure by up to 1.49 times, in the worst possible situations [54].
13 than that applied to other miniature specimens. As shown in Figure 8-b, the minimum creep strain rate data obtained from circular and elliptical ring creep test at stresses between 50 and 65 MPa lie on the same straight line as the uniaxial data obtained at higher stresses, between 70 and 100 MPa. The slight deviation of the elliptical ring data from the straight line is less or equal than the typical scatter of creep tests, which is of 8%. Future development involves the establishment of time-dependent geometric correction functions to compensate for the effects of geometry changes during the deformation process [36, 37].
The small two-bar creep test allows production of full uniaxial creep curves, but further experimental data and validation are necessary. With this technique, the pins must be made of a material characterised by higher creep strength than that of the specimen, therefore there is a limitation in the range of materials which can be potentially tested. In the case of testing high creep strength materials, e.g. Nickel based super-alloys for turbine blades, using the two-bar specimen, careful consideration of the specimen design should be given. Relatively larger diameter pins and smaller cross-sectional areas of the test sections of the two-bar specimen should be adopted to reduce the mean contact stresses between the pins and the specimen. In such a case, the material for the pins can be chosen to have a similar creep strength as that of the test material. The contact between the pins and the specimen induces a bending deformation in the extreme regions of the specimen, while the stress distribution in the bars is almost constant [39]. In view of this feature, the reference stress parameters for this specimen type are almost one, as the stress field in the effective section of the structure is considerably similar to that found in conventional uniaxial creep test specimen. Furthermore, the specimen is taken to failure, therefore contrary to the impression creep and the small ring creep tests, the tertiary creep region of the material can be characterised and the failure behaviour identified.
In conclusion, good agreement between small specimen creep data and uniaxial creep data have been obtained with all of the techniques described so far, particularly with good correlation against minimum creep strain rates. Both small punch and small two-bar creep tests are able to predict the specimen failure life, but difficulties in data interpretation of small punch data have not been overcome yet, while, methods for data interpretation of the two-bar test are still under investigation, even though this test has already been validated for steel materials and a nickel-based super-alloy material. Impression and small ring creep tests are both suitable for the determination of the steady-state creep properties. The noise in the impression creep test output can be of the same order of the output itself, since very small deformation occur during the test. An opposite problem has been observed for the small ring creep test, during which the specimen shape varies, making the reference stress to change as well. As a final consideration, small specimen creep testing techniques look very promising for determining creep properties and providing information about failure, even though further experimental and numerical investigations are needed.
The current status of the techniques can be summarised as;
Provide estimates of minimum creep strain rate that show good comparison to uniaxial data, (can we differentiate to comment on which test is better for low and high stress tests – in this context ‘low’ implies plant stress levels, so circa 40-70MPa)
Impression creep specimens have been used to support operational run-repair-replace decisions on components,
The small two-bar creep test specimen is the only method considered to be capable of providing a full uniaxial creep curve,
14
Material is typically sampled from the surface of a component, which confers the following opportunities;
- Correlation against other current methods for assessing the condition of the bulk component, such as surface creep replicas, hardness tests,
- Provides component specific data on the in-service creep strain rate, which can be compared against the response from a representative structural model, thereby allowing a more objective assessment of component condition,
Sampling the material from the surface also presents similar issues faced by other surface techniques such as creep replicas and hardness testing, since the through section stress state is not directly accounted for. However, the use of a structural model that can account for the stress state provides a means of eliminating some of the current shortfalls associated with interpretation of surface creep replicas and hardness data.
3
Industry Practice for Condition Monitoring and Life Management
A range of non-destructive inspection based assessment techniques and surveys are routinely used during a statutory plant shutdown to support an evaluation of the creep damage accumulated in a component operating at high temperature. These techniques do not provide a direct measure of accumulated creep damage (life consumption); however they support the subsequent residual life assessment by reference to similar components and systems on sister plant. The current assessment approach requires extensive data mining and review of large quantities of site metallurgical data, from a number of different power stations and at different times in their lifecycle. A range of inspection and metallurgical assessment techniques are routinely used to assess the condition of components during a plant outage, such as; surface replication, surface hardness, ultrasonic inspection, magnetic particle inspection and physical dimension measurements using calipers and micrometers. The selection and use of these techniques is influenced by a host of considerations such as cost, perceived risk, familiarity and confidence with the techniques, plant access, accuracy, reliability, regulator preference and tradition. In addition, on-load monitoring of pressure and temperature conditions can be used to provide a generally conservative estimate of the residual creep life. This involves using sampled operational steam or metal temperature data coupled with steam pressure data, with an appropriate creep rupture expression to determine the residual creep life; this is illustrated in more detail in section 3.1.2.
It is standard practice to use multiple assessment techniques, such as outage overhaul inspections and on-load monitoring to evaluate component condition. This is necessary because of the intrinsic scatter in the material creep properties and uncertainty in some of the load components, such as loads from fixed supports and reaction loads from adjacent components and systems, which can also vary as the plant is cycled on and off load. It should be noted that modern plant design can limit the ability (access) to deploy some of these traditional techniques.
For example, heat recovery steam generators (HRSGs) are designed so that it is not possible to use traditional diametral strain measurements on the steam headers. This provides a requirement to consider the use of the novel techniques to assess creep life consumption such as optical strain gauges [55], Alternating Current Potential Drop [56] and small specimen testing techniques such as impression creep, small punch and ring specimens [3, 36].
15 rate information, and balanced against other relevant condition assessment data obtained during the plant outage. This would demonstrate a truly holistic approach and is considered to be the ultimate aim for optimal plant integrity management. Figure 14 shows a schematic of the current integrity management approach. Particular reference is made to the two following aspects; 1) miniature specimen testing, which could provide significant benefits to the utility with respect to maintaining safe operation, maximizing availability and optimising operational and capital costs, and 2) more proactive use of on-load data assessment.
3.1 Inspection Planning and Reporting
The inspection planning process is driven by the need for the utility to demonstrate compliance with PSSR requirements [1] and is applicable to both conventional and nuclear AGR pressure systems. The inspection plans are developed by a ‘competent body’ that can demonstrate that its staff are suitably qualified and experienced.
It is common practice in the UK for large conventional fossil fired stations to prepare a technical review document about three months before the statutory outage. This gives an overview of the previous operational history, maintenance, replacement, inspection and assessment history of all the pressure systems for the Unit. Operating AGR plants are subject to additional licence requirements [2], which for example define requirements for sites to produce periodic safety reviews in support of the stations risk management process.
There is a statutory requirement for the ‘competent person’ to compile a written report of the outage examination within 28 days of return to service, which is agreed with site representatives and the technical inspection body. Subsequently, detailed component and system specific integrity assessment reports and safety cases follow on after return to service.
3.1.1 Off-load: Outage Works
The following outage inspection techniques are applicable to both conventional and AGR high temperature and pressure systems. None of these techniques are used as systematic input into a predictive creep life assessment model of the piping system or other high temperature components.
Pipe movement
Pipe movement is obtained via hot and cold surveys of pipe work hanger positions, an example of one type of pipe hanger set-up is shown in Figure 14. In this arrangement there are two spring loaded pipe hanger supports either side of the main steam pipe, with connections to structural steelwork above and connections to the main steam pipe via a ring (trunnion) clamp below (out of the image). This arrangement is designed to ensure that a constant load is imposed on the pipe as it moves up or down with normal plant operation. These hot and cold surveys provide information on pipework operational loads (between cold condition and full load hot operation), which can be compared against the design basis and prompting readjustment of hangers as required.
Passive strain measurement
16 conventional fossil fired plant diametral surveys show much greater than expected variability and emphasises the need for good procedural control on site if such methods are to be relied on.
More recent developments to improve the accuracy and reliability of passive strain measurement include the ARCMAC high temperature optical strain measurement system [58, 59]. The ARCMAC system uses stud-welded optical targets attached to the component in a bi-axial arrangement, which is illuminated from a light source within a purpose designed camera system with a telecentric lens and beam splitter arrangement. The attachment if the stud-welded optical gauge is facilitated by the use of a purpose designed gauge carrier that allows consistent gauge installation, along with the installation of a suitable protective cover. The optical arrangement and illumination ensures that accurate measurements of strain can be captured even if the camera system is not located precisely normal to the target gauge. The strain measurement resolution is ~ 60 micro-strain with an error of <10%. Gauge images captured during subsequent shutdown periods enables the creep strain rate to be deduced. The author has un-published data from validation tests at 600°C and a period of that 20Khr operation, (with test periodically interrupted to obtain gauge images and thereby simulate intended use on site), which shows strain resolution and repeatability that is in very good agreement with the laboratory creep test extensometer instrumentation. Further extensions to these optical strain measurement techniques have been developed using surface speckle coatings and digital image correlation techniques to provide a non-contact surface strain distribution (across a weldment), with reference images from an adjacent ARCMAC gauge to provide a calibration strain reference [60, 61].
Surface Creep replicas
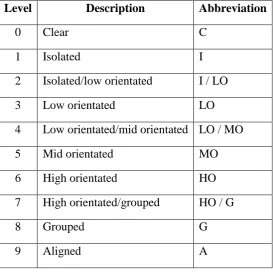
These are targeted at regions considered to be more prone to creep damage accumulation, such as weldments, pipe penetrations (fillet welds), attachment welds, pipe bends and pipe terminal positions. The requirement for creep replicas is dependent on the age of the plant and the perceived risk, which may be influenced for example by adverse readings from routine passive strain measurement campaigns or known periods of mal-operation evident from reviews of operational data. It is not unusual for several hundred replicas to be taken during an outage on a single Unit. The surface replica technique involves capturing the surface features on a film that can subsequently be examined under a microscope. This involves careful surface preparation by grinding the surface with progressively finer abrasive papers, with final polishing. This process should be undertaken with great care to avoid removing the creep damaged surface and also to ensure that any surface oxidation and decarburised layers are removed. The prepared surface for replica assessment typically covers a surface area of 25 x 50mm is then etched with a dilute acid such as Nital to reveal the microstructure. A soft cellulose acetate strip is then pressed onto the surface and allowed to dry before spraying with a matt black paint. This provides a contrast under white light when the replica is removed and examined under the microscope. 0Carefully applied this process should reveal creep cavities that can subsequently be counted per mm2 and classified, which is described in further detail in section 4. It should be noted that different types of steel may require a modified process to the above in order to obtain the best quality surface replica.
17 The repair or return to service decision is invariably supplemented by experiential knowledge, as indicated in the current condition assessment route, Figure ; usually with a recommendation to further inspect at the next interim or major outage. The importance of experiential knowledge should not be underestimated in the decision process due to the significant differences in creep degradation characteristics of power plant materials in widespread use such as CMV and modified 9%Cr steels (P91).
Surface Hardness
These outage measurements are targeted at regions considered to be more prone to creep damage accumulation, with the key aspect being the change in surface hardness captured at successive inspections. It is custom and practice to cross-check these results against periodic trends from surface creep replicas obtained from an adjacent location.
This is essentially a similar approach to surface creep replication and is frequently used during an outage to provide a large amount of data, with the key feature of the subsequent assessment being the change in surface hardness at a repeat location between periodic inspection intervals. It is custom and practice to cross-check with other site metallurgical techniques, such as surface creep replicas obtained from an adjacent location on the component.
There are a range of portable site hardness test tools available, either using ultrasonic contact impedance, direct measurement or dynamic rebound, such as the Equotip system, which uses the impact and rebound velocities to determine the surface hardness value. It is necessary to prepare the surface before testing (to remove hard scale), and these methods are frequently used on site during the outage. Various industrial studies associated with the performance (accuracy and repeatability) of these techniques have been undertaken. For the dynamic rebound systems the characteristics are (assuming trained and competent operators and for specimens in the range 180-300HB);
Low standard deviation,
Error typically ~ 5% ,
Error is significantly influenced by the hardness of the specimen, with the error increasing with softer materials),
Results can be influenced by the angle of the probe.
Again, decisions on repair or return to service options that use hardness data is typically based on rate of change in hardness and experiential knowledge from hardness trends associated with other similar components, material, service age and duty. This information is not used in a predictive life assessment model.
Material composition checks
This standard practice confirms that the correct materials have been installed on plant. In some instances rogue materials have been identified, hence composition checks are recommended good practice. For on-site composition checks portable x-ray flourescence analysers are typically used. 3.1.2 On-load: Use of Operational Data
18 the Unit is prone to temperature instability then the sampling interval should be reduced. These techniques are applicable to both conventional and AGR high temperature pressure systems. In addition, most Stations will invariably have installed additional surface mounted or deep drilled thermocouples on key components or on components being monitored as part of a safety case. This data is stored in the plant historian and various data sampling frequencies can be defined. Typically if a plant transient is being monitored the thermocouple sampling interval may be as frequent as every 15-30 seconds. For longer term creep temperature monitoring the sampling interval could be relaxed to several minutes. With respect to creep temperature monitoring the decision on the sampling interval is influenced by the stability of operation; if the unit being monitored is prone to temperature instability then the sampling interval should be reduced. Hence, some judgement and experience is needed in order to define the required sampling interval prior to any computation being undertaken.
Once this data is collected the utility evaluates what is termed as the creep effective temperature (CET); defined as the average temperature at which all of the creep damage (over the monitored period) can be equated to. This approach typically uses the design pressure in the computation, although it is possible to also use the measured operational pressure. However, for the purposes of the CET calculation the design pressure is usually sufficient. For UK conventional plant designs 0.5%Cr0.5%Mo0.25%V (CMV) steels are typically used for main steam line construction.
The creep rupture life calculation, using CET, gives a value of creep rupture life, which is dependent upon stress and temperature. Equation (5) is used to estimate the creep rupture life of CMV material and is based on the Manson-Brown 4th degree polynomial formula.
log 𝑡𝑟− 𝑓
(𝑇 − 𝑔)ℎ = 𝑎 + 𝑏 log 𝜎 + 𝑐(log 𝜎)2+ 𝑑(log 𝜎)3+ 𝑒(log 𝜎)4
(5)
Where;
σ = 1.25 x Creep Reference Stress (MPa) a = -0.10086133
b = 0.2521769
c = -0.27441233
d = 0.12751693
e = -0.02218978
f = 8.659
g = 650
h = 0.95
tr = predicted time to creep rupture (h)
T = temperature in Kelvin.
19
Mean Diameter Hoop Stress = P(𝐷0− t)/2t (6)
Where;
P = Operating Pressure
D0 = Pipe Outside Diameter
t = Wall Thickness
Figure 18 shows the effect of changes in operating temperature from 568°C to 578°C against the minimum creep rupture life, for two operating stress levels of 42 and 47MPa of a typical main steam line based on nominal dimensions of 360mm outside diameter, 60mm wall thickness with an operating pressure of 168bar. The subsequent mean diameter hoop stress is 42MPa and it can be observed that an increase in operating temperature of ~5°C or an increase in stress of ~ 10% results in a reduction in creep rupture life of ~ 20Khr. Information presented later in this section provides examples of plant temperature data trends that show that abnormal operating temperatures are not uncommon; in addition practical experience during periodic plant overhauls regularly shows evidence of the biasing of observed creep damage around pipework sections due to in-service system loading effects.
The above example is significant for the following reasons:
1. Relatively modest increases in operating conditions (temperature and stress) result in a significant reduction in creep rupture life.
2. The reduction in creep rupture life of ~ 20Khr, due to variation in temperature or stress is approximately equivalent to a typical 4-year operating period for a large conventional fossil fired power station.
3. Stations would prefer to be able to plan future outage scope and replacement strategies with more certainty for budgetary purposes; the example presented shows the dilemma that Stations face as Unit operation nears the end of practical commercial life.
From the perspective of the station operator the sensitivity to modest increases in operating conditions makes planning the scope of subsequent outages or replacement exercises fraught with uncertainty. This uncertainty triggers a natural response to conduct more sampling inspections at subsequent outages and may result in premature replacement of large sections of pipework systems, driven by an inspection scope that in reality is out of step with real material condition.
Figure 19 shows an example of a typical steam temperature trace obtained at the final superheater outlet from a boiler on a 500MW conventional unit, with temperatures plotted from two of the four outlet steam legs (A1 and B1) during a run-up to full load. In this example, steam temperature is sampled at one minute intervals. Since there are four main steam lines exiting the boiler on a typical 500MW unit it is not unusual to find each of the four steam outlet legs operating at different CET’s. In this example there are a number of temperature excursions that significantly exceed the 568oC design temperature. Hence, the primary use of the CET computation is to provide a
systematic process to identify operational issues and to prompt a correction. In addition, historical CET computations on units and across steam systems and components can be used to support the definition of the inspection scope prior to the next statutory outage.
20 temperatures to cycle beyond 600oC, which is the limit of the CMV creep rupture in equation 5. In
such cases, the use of the CET data is problematical and a consequence of such adverse operation is that more ‘inspection sampling’ during an outage is usually stipulated in order to determine if the operational instability has manifested itself as an unexpected accumulation of creep damage or the initiation of damage (metallurgical or physical macro-cracks) at weldments. Hence, unstable temperature excursions as illustrated in Figure 19 above should be avoided wherever possible. Unstable operation of can also result in severe (rapid) thermal transients occurring on plant, which can result in the initiation of fatigue cracks in weldments and for high temperature systems propagation via creep crack growth through wall [62].
Figures 20 and 21 show the design of steam headers, which are another significant class of high temperature thick sectioned components installed in a boiler. These components are subject to very similar outage inspections and on-line CET assessments as described for main steam pipes, however these are considered to be more complex to assess due to the numerous penetrations in the header shell and difference in stiffness between the relatively rigid header shell and the thin interconnecting boiler tubes. Steam headers ensure proper distribution of steam across the boiler space, with the boiler tubes providing the heat transfer surface within the furnace of a conventional boiler. There are many different designs of steam header (material and geometry) within a typical conventional fossil fired boiler. With respect to the use of small specimen testing the critical areas on the header are usually the inter-ligament positions between boiler stub tube connections. The photograph in Figure 21 shows the limited access available on this particular design for material extraction. For this situation the approach would be to take a reference small specimen sample from the adjacent and accessible header shell, providing a reference data set. This reference data would then be supplemented by a computational model of the header, which uses on-line temperature and pressure measurements to determine the theoretical residual life at the inter-ligament positions. Reference to the process outlined in Figure 14 indicates how the small specimen testing and on-line data analysis would be used interatively over an extended period of service to establish the residual life, along with periodic inspection data acquired during periodic overhauls.
3.2 Holistic Condition Assessment
The main objective of the owner of a large power station is to maximise plant availability and profitability, whilst maintaining safety. In order to achieve this objective the station must be able to understand, with good certainty, the remaining life of the assets at any time during the operation of the asset so that it can cost-effectively plan future inspections, refurbishments and replacements as required.
This requirement to understand with certainty the remaining life becomes ever more acute in commercial electricity generation where the profitability is marginal, whether caused by government or environmental policy, market prices, taxation or other factors. At the time of writing this paper these factors are all significantly influencing the profitability of large scale conventional plant generation in the UK.
21 to arrive at an agreed view of the condition of the asset and any needed future monitoring or changes in future inspection scope.
Hence the current approach is defined as ‘inspection based’ and usually results in an incremental increase to future inspection sample size to contain a perceived emerging threat. This current approach is outlined in Figure 14.
However, the current ‘holistic’ condition assessment process does not;
Stipulate predictive life assessments beyond the next major statutory outage, which in the UK occurs every 4 years,
Seek to integrate the various disparate data sets obtained from the plant outage or on-load monitoring.
Figure 14 seeks to illustrate two significant missing activities, namely 1) miniature specimen testing and 2) on-load condition assessment, which could fruitfully be exploited to provide a more predictive life assessment approach and thereby satisfy the main objectives of the plant owner outlined at the beginning of this section.
The following case study illustrates how creep life assessments and decisions are currently achieved.
4
Case Study: Ageing Main Steam Pipework
The data presented in this case study is based on conventional plant operation and focused on information and techniques currently used to assess the remaining creep life and hence decide on replacement.
The through life integrity of main steam CMV butt welded pipework systems has been dominated by the condition of the weldments, which have typically been addressed by means of periodic inspection, weld repair or pipe spool replacement. Most of the integrity issues associated with the weldments have manifested as circumferentially distributed creep cavitation or subsequent circumferential cracking. This damage is affected by pipework system loads and it is not uncommon to find the observed weld damage biased (creep cavitation or depth of cracking) around the circumference of the pipe weld. Invariably at the latter stages of a stations life the location and condition of all the major welds has been established and procedures are in place to implement any needed repair and replacement activities.
However, the failure of parent material is more likely to occur due to the acting pipe hoop stress, which can potentially initiate longitudinal cracking. It is very difficult to comprehensively identify those parent material regions close to creep life expiry, noting the large volume of parent material in typical pipework systems. As the pipe system enters the later stages of life conducting piecemeal butt weld replacement by the insertion of new pipe spools becomes more difficult due to the aged condition of the cut faces of the original pipe section, which is typically assessed by on-site surface replication and hardness testing. This ‘test’ of the parent material condition, when conducting pipe spool replacements, is often used as an opportunistic indicator of parent material condition (through thickness).


![Figure 7. (a) Cross section of a typical experimental set-up used for small punch creep tests with dimensions in [mm], from Ref](https://thumb-us.123doks.com/thumbv2/123dok_us/8578602.369476/50.595.61.545.45.513/figure-cross-section-typical-experimental-small-punch-dimensions.webp)

